


It is known that UVB radiation (wavelength 290–315 nm) stimulates cutaneous synthesis of vitamin D and that geographical location, time of day and year (season), skin pigmentation, sunscreen use and clothing may influence the amount of UVB reaching the skin for synthesis of vitamin D( Reference Webb 1 ). Excess exposure to UV light can, however, increase the risks of photoageing and skin cancer( Reference Armstrong and Kricker 2 ), causing a challenge for public health advice to minimize these risks, but at the same time maintain vitamin D requirements. Diet makes little contribution to vitamin D requirements as foods that are naturally rich in vitamin D are few and not widely consumed( Reference O’Mahony, Stepien and Gibney 3 ). A small number of foods are fortified with vitamin D. However, the number and types of foods fortified with vitamin D differ significantly between countries due to varied country-specific policies on food fortification( Reference O’Mahony, Stepien and Gibney 3 ).
The climate in Kuala Lumpur (3°N), Malaysia, is fairly consistent throughout the year, with relatively uniform temperature (average 20–30°C) and high humidity and rainfall. Yet, low vitamin D status (defined as serum 25-hydroxyvitamin D<50 nmol/l) has been reported in those living in urban areas in Malaysia( Reference Poh, Ng and Siti Haslinda 4 – Reference Al-Sadat, Majid and Sim 6 ). Lifestyle behaviours which reduce sunlight exposure (e.g. sun avoidance and excessive clothing) have been suggested as contributing factors, although the method (questionnaire) used to assess UVB exposure was subjective( Reference Musa, Chee and Pendek 5 ). Further examination of population UVB exposure in Malaysia with objective measurements is therefore needed.
Studies in the UK consistently show that people with darker skin have lower vitamin D status compared with Caucasians( Reference Macdonald, Mavroeidi and Fraser 7 , Reference Darling, Hart and Macdonald 8 ). The amount of melanin in the skin is thought to interfere with vitamin D synthesis by blocking out UVB light and may explain the increased risk of vitamin D deficiency among Asians in the UK( Reference Norman 9 ). Recent small studies, however, reported that skin pigmentation has no role in the cutaneous synthesis of vitamin D( Reference Bogh, Schmedes and Philipsen 10 , Reference Hakim, Hart and McCabe 11 ). Limited UVB exposure and cultural practices (i.e. wearing clothing that covers exposed skin) have also been associated with poor vitamin D status among Asians residing in the UK( Reference Kift, Berry and Vail 12 ). However, no longitudinal data have so far studied the effect of migration from low to high latitude on personal sunlight behaviour. It is uncertain whether UVB exposure among Asians living at high latitude is the same as that in Asians living at the lower latitude of their home country.
The aims of the current longitudinal study were to compare sunlight behaviour among Asians living in Kuala Lumpur (KL; 3°N), Malaysia, and Aberdeen (AB; 57°N), UK, and to assess the relative contributions of UVB exposure and diet to total vitamin D intakes in these two cities.
Methods
Participants
The present study was conducted at universities in AB and KL. In the UK, people from Asian countries who were currently visiting or residing in AB and intending to stay for a minimum of 1 year were invited to participate. In KL, only citizens of Malaysia were included. Posters were placed around the university and in public common areas (i.e. hospitals, mosques and church halls) as well as on Facebook. Potential participants were excluded if they were bed-bound or hospitalized.
Number of participants recruited
Based on cross-sectional data among Asians in Surrey (sd of standard erythemal dose (SED) in summer=3·1)( Reference Macdonald, Mavroeidi and Fraser 7 ), recruiting sixty-eight participants at each site would be sufficient to detect a mean difference of 1·5 SED between season, with 5% significance and 80% power. This sample size was estimated using PS Power and Sample Size Calculation version 3.0.43. After allowing for a 20% dropout, a total of eighty-two participants at each site were required.
Study protocol
In AB, participants were recruited in autumn (September–November) and assessed every 3 months for 1 year (winter, December–February; spring, March–May; summer, June–August). In KL, recruitment was performed during the south-west monsoon (SWM; June–August, relatively dry period) and repeated during the north-east monsoon (NEM; November–February, rainy season).
A web-based questionnaire was designed with two options of language (English and Malay) for the KL site and English for the AB site. Basic demographic information (e.g. date of birth, place of birth, sex, ethnicity, country of living before departure to AB (for participants in AB only)) were asked at baseline only. Participants did not have to complete the questionnaire in one sitting; they could pause and come back to it at a later time. Reminder emails with a link to access their personal questionnaires were sent 7, 14 and 28 d after participants’ first login to start the questionnaire. During the next season, participants were contacted via email with a unique link to access their personal questionnaire. Similarly, reminder emails to complete the questionnaire were sent at the same intervals (7, 14 and 28 d) after the initial email of that season.
After completing the online questionnaire, participants in KL were asked to attend an appointment for anthropometric measurements (baseline only). Body weight was measured with a TANITA digital weighing scale model HD-309 (TANITA Corp., Tokyo, Japan) to the nearest 0·1 kg while height was measured with a portable SECA bodymeter model 206 (SECA, Hamburg, Germany) to the nearest 0·1 cm. In AB, no visits were carried out and participants self-reported their body weight and height on the online questionnaire.
Sunlight behaviour and UVB exposure
Body surface area (BSA) exposure, previous sun exposure and holidays abroad were assessed by a questionnaire adapted from a previous study( Reference Macdonald, Mavroeidi and Fraser 7 ). Each participant self-assigned a Fitzpatrick skin type (ranging from I, always burns never tans; to VI, never burns, tans easily)( Reference Fitzpatrick 13 ) based on evaluation of their skin colour. They were asked to estimate the fairest colour the skin on the back of their hand could be (without sun exposure), using a photograph of different skin colours for reference.
Two polysulfone film badges which measure UVB exposure were given to the participants (during the study visit in KL and sent by post in AB). Participants were instructed to wear the badges on their outdoor clothing for a total of seven consecutive days (one badge for 4 d and the second badge for 3 d). Once used, the badges were kept in a sealed envelope. The absorbance of the badges was read on a spectrophotometer (Perkin Elmer UV/VIS Lambda 2 Spectrophotometer) at the University of Aberdeen, before and after use, at a wavelength of 330 nm. SED was calculated using the following equation:
 $$\eqalign{{\rm SED}{\equals}&10\!\cdot\!7\left[ {\Delta {\rm A}_{{330}} } \right]{\plus}14\!\cdot\!3\left[ {\Delta {\rm A}_{{{\rm 330}}} } \right]^{2} {\minus}26\!\cdot\!4\left[ {\Delta {\rm A}_{{330}} } \right]^{3} \cr & {\plus}89\!\cdot\!1\left[ {\Delta {\rm A}_{{{\rm 330}}} } \right]^{4},}$$
where ΔA330 is the change in absorbance of the film badge pre- to post-UVB exposure( Reference Challoner, Corless and Davis 14 , Reference Diffey 15 ).
The equivalent vitamin D intake was estimated from the SED measurements, based on observations that 100% of pale skin exposed to the minimal erythemal dose of sunlight (MED) is sufficient to produce 387·5 µg (15500 IU) vitamin D( Reference Holick 16 ). One MED is defined as the minimum amount of UVB to cause erythema or slight pink coloration of the skin after sunlight exposure. As 1 MED is equivalent to 320 J/m2 for Fitzpatrick skin type II, and 1 SED is equivalent to UVB exposure of 100 J/m2, this means that whole-body exposure of type II skin to 1 SED sunlight would produce 122·5 µg (4900 IU) vitamin D. For other Fitzpatrick skin types, 1 MED is equivalent to 200 J/m2 (2 SED) for skin type I, 250–350 J/m2 (average=300 J/m2 or 3 SED) for skin type II, 300–500 J/m2 (4 SED) for skin type III, 450–600 J/m2 (5·3 SED) for skin type IV, 600–900 J/m2 (7·5 SED) for skin type V and 600–2000 J/m2 (13 SED) for skin type VI. Consequently, specific skin-type factors (STF) as suggested by Godar et al. were used when calculating the amount of vitamin D that can be made for a given UVB exposure, for each skin type( Reference Godar, Pope and Grant 17 ). The usual BSA exposed to sunlight was also incorporated into the calculation. Thus, the equation for estimating cutaneous synthesis of vitamin D was as follows:
 $${\rm Cutaneous\,\,vitamin\,\,D }\,\,\left( {{\rm IU}} \right) & \quad {\equals}{\rm 4900}{\times}{\rm STF}{\times}{\rm daily\,\,sunlight\,\,exposure }\,\,\left( {{\rm SED}} \right){\times}{\rm BSA }\,\,\left( {\rm \,\%\,} \right),$$
where vitamin D (µg)=vitamin D (IU)/40.
Dietary vitamin D intake
Dietary vitamin D was assessed by a questionnaire which listed common vitamin D-rich foods and also supplement intake. Participants were asked to determine the frequency and amount of intake as well as the brand name for commercial products (breakfast cereals, margarine/butter and dietary supplement) in a week during each season. Since the Malaysian food composition database does not contain data for vitamin D( Reference Tee, Ismail and Nasir 18 ), the vitamin D content of raw foods was obtained from McCance and Widdowson’s The Composition of Foods ( 19 ), while the information for commercial products was taken from the packaging labels.
Statistical analysis
All analyses were carried out using the statistical software package IBM SPSS Statistics version 22. Data were checked for normality and when the distribution was skewed, the natural logarithm was used to transform the data (dietary vitamin D intake, UVB exposure, cutaneous vitamin D and total vitamin D intake). Variables were described using mean and standard deviation or median and 25th–75th percentile as appropriate. Categorical variables were described with number and percentage. Comparisons between characteristics at each study site were undertaken using the independent t test or χ 2 test, as appropriate. Non-parametric tests (i.e. Wilcoxon signed-rank test and Mann–Whitney U test) were used when the data remained skewed after the natural log-transformation was performed. P<0·05 was considered to indicate a statistically significant difference.
Results
Participants’ baseline characteristics
A total of 115 Asians (74% female) in KL were recruited during SWM, with 102 participants continuing to take part in NEM. In AB, eighty-five Asians (61% female) were recruited in autumn with retention rates of 92% at 12 months (Fig. 1). The physical characteristics of the study population are presented in Table 1. Participants in AB were slightly older, heavier and had a higher BMI compared with those in KL (P<0·01). The majority (~70%) of participants at both sites reported to have skin types II and III, and about a quarter of participants (21%) in KL reported to have skin type I (P=0·024).
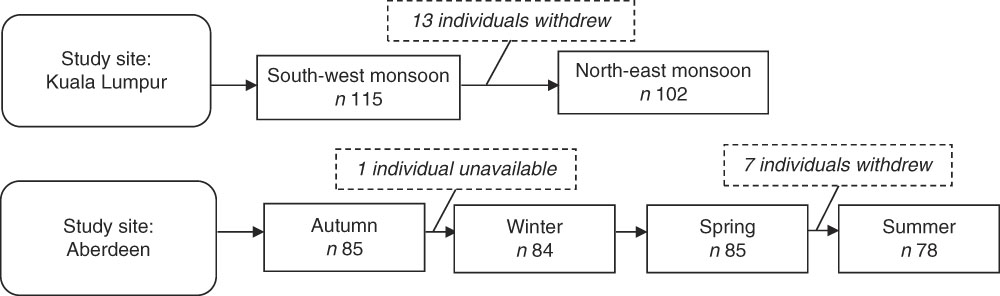
Fig. 1 Recruitment and retention of participants at the two study sites: Kuala Lumpur, Malaysia (3°N) and Aberdeen, UK (57°N)
Table 1 Participants’ baseline physical characteristics and comparison between the two study sites: Asians aged 20–50 years from Kuala Lumpur, Malaysia (3°N) and Aberdeen, UK (57°N)

P25, 25th percentile; P75, 75th percentile.
* Values presented are mean and sd.
† Mann–Whitney U test.
‡ Independent t test.
§ Pearson χ 2 test.
Personal sunlight behaviour
In AB, at each season, approximately half (~40–50%) of the Asians reported spending between 30 min and 2 h outside during weekdays and weekend (Table 2). There was a higher proportion of participants spending more than 2 h outside during the weekend compared with weekdays. No seasonal difference was found for the time spent outside on weekdays, but more participants (31%) were outside for between 15 and 30 min at the weekend in winter, compared with other seasons (autumn, 14%; spring, 18%; summer, 14%; P=0·01). A similar trend was seen in KL where nearly half the participants reported spending between 30 min and 2 h outside during weekdays and weekend. However, there was a lower proportion of participants who spent between 30 min and 2 h outside in NEM (41%) compared with SWM (53%, P=0·028) during weekdays. No seasonal difference was observed for the time spent outside at the weekend in KL.
Table 2 Participants’ personal sunlight behaviour at the two study sites: Asians aged 20–50 years from Kuala Lumpur, Malaysia (3°N) and Aberdeen, UK (57°N)

SWM, south-west monsoon; NEM, north-east monsoon; BSA, body surface area (5%, face only; 10%, face and hands; 25%, face and hands plus arms/legs; 60%, face and hands plus arm/legs and some/all of the trunk).
* Fisher’s exact test.
The majority of participants in AB exposed face and hands only (10% BSA) when outside (84% in autumn, 83% in winter, 80% in spring, 71% in summer). Compared with winter, more participants exposed 25% BSA in summer (2% v. 27%) and fewer participants exposed only 5% BSA (14% v. 3%; P<0·01). A high proportion of participants in KL (65% in SWM and 62% in NEM) exposed 10% BSA while outside, with no evidence of seasonal variation in BSA exposed. Only about a quarter of the participants in both locations reported using sunscreen when outdoors with no seasonal difference.
Seasonal estimates of daily vitamin D intake from diet and cutaneous (UVB) sources
Dietary vitamin D intake and UVB exposure were compared between Asians in AB and KL during times of ambient UVB radiation in AB (summer and spring; Table 3). There were no seasonal differences in estimated dietary vitamin D intake among Asians in AB and KL. Median dietary vitamin D intake was higher in AB (3·50 µg/d (140 IU/d)), year-round, than intakes in KL (2·08 µg/d (83 IU/d)). Dietary intakes were below the Recommended Nutrient Intake (RNI) in both locations (UK RNI=10 µg/d (400 IU/d); Malaysian RNI=15 µg/d (600 IU/d))( 20 , 21 ). The major contributor to dietary vitamin D intake was fresh oily fish, providing an average of 66% of intake in AB and 59% in KL, followed by eggs (17% in AB, 22% in KL) and canned oily fish (e.g. sardines and tuna; 10% in AB, 14% in KL).
Table 3 Seasonal estimates of participants’ daily vitamin D intake from diet and cutaneous (UVB) sources at the two study sites: Asians aged 20–50 years from Kuala Lumpur, Malaysia (3°N) and Aberdeen, UK (57°N)
SED, standard erythemal dose; P25, 25th percentile; P75, 75th percentile; AB, Aberdeen; KL, Kuala Lumpur; SWM, south-west monsoon; NEM, north-east monsoon.
To convert to µg/d, divide IU/d values by 40.
* Estimated from SED, body surface area exposed and skin type.
† Repeated-measures ANOVA using natural log-transformed data.
‡ Paired t test using natural log-transformed data.
§ Mann–Whitney U test.
║ Wilcoxon signed-rank test.
¶ Independent t test using natural log-transformed data.
The polysulfone film badges revealed substantially lower median daily UVB exposure in autumn (0·04 SED/d) and winter (0·02 SED/d) compared with spring (0·22 SED/d) and summer (0·25 SED/d; P<0·001) in AB. In KL, median daily UVB exposure was higher in SWM (0·20 SED/d) compared with NEM (0·14 SED/d; P=0·001). UVB exposure of Asians in AB during summer was higher than that for KL participants in both SWM (P=0·017) and NEM (P<0·001). The SED dose received in spring in AB was also higher than in NEM in KL (P=0·003). UVB exposure in AB was lower in autumn and winter compared with SWM and NEM in KL (P<0·001).
After considering skin type factors and BSA exposed, median total vitamin D (diet plus cutaneous sources) was higher in AB only during summer (8·45 µg/d (338 IU/d)) when compared with KL (SWM=6·03 µg/d (241 IU/d); NEM=5·35 µg/d (214 IU/d)), but intakes across the year were comparable (AB=5·75 µg/d (230 IU/d); KL=6·15 µg/d (246 IU/d)). Sunlight was the major source of vitamin D in KL year-round (60%; 3·33 µg/d (133 IU/d)), but not in AB (38%; 2·00 µg/d (80 IU/d)).
Discussion
The present study is the first longitudinal one comparing sunlight behaviours, UVB exposure and dietary vitamin D intake between Asians living near the equator in KL and at a higher latitude in AB. Sunlight behaviours were similar between the two populations. The results demonstrate a higher UVB exposure (SED) during SWM compared with NEM in KL and this could possibly be due to participants spending less time outdoors in NEM as the latter is the rainy season. Indeed, the proportion of time participants were outside for between 30 min and 2 h was lower in NEM (41%) compared with SWM (53%). These observations highlight that in spite of relatively high ambient UVB levels during the NEM (~30 SED/d), other climate factors such as rain present a potential barrier for sunlight exposure. The average monthly rainfall recorded during the study period was 853 mm/month in NEM with an average of twenty-two rainy days per month, compared with 133 mm/month with fourteen rainy days per month in SWM (Malaysian Meteorological Department, unpublished results). In AB, although a high proportion of Asians reported spending between 30 min and 2 h outside in each season, the seasonal difference in SED between spring/summer and autumn/winter reflects the negligible amount of ambient UVB radiation in autumn/winter in Scotland. This finding was not surprising as it is known that the intensity of UVB radiation (290–310 nm) from October to March in the UK is too low for cutaneous synthesis of vitamin D.
The finding of a higher daily SED received among Asians in AB during summer and spring compared with those in KL was unexpected. A possible explanation for this observation could be due to participants in KL spending their time outside in the shade, resulting in minimal UVB exposure. It has been demonstrated that the UVB intensity can be reduced by up to 50% in some shady environments (e.g. umbrella shade and tree shade) and no UVB light can penetrate a car with the windows closed( Reference Turnbull, Parisi and Kimlin 22 ). Malaysia is a developing country and KL, the capital city, is surrounded by many tall buildings which block a significant amount of UVB and thus abate UV radiation. Given that Malaysia is a tropical country, sun-seeking behaviour is uncommon in this population due to hot weather (average daily temperature of 27·7°C). In addition, Asians prefer to have fair skin than tanned skin as it is viewed as beautiful( Reference Jang, Koo and Ke 23 , Reference Shankar and Subish 24 ).
The low sunlight exposure among participants in KL might also be due partly to environmental factors such as air pollution and cloud cover, which can influence the extent of UVB reaching ground level( Reference Kimlin 25 ). Engelsen et al. suggested that these two factors can impose a period of insufficient outdoors UV radiation, even at the equator( Reference Engelsen, Brustad and Aksnes 26 ). Of note, there was a particular period of pollution (haze) reported in KL (during SWM) as a result of biomass burning. Although the present study was conducted a month after the incident (when the air pollutant index was reported to be good), it is unknown if the event had long-term repercussions that might have influenced sunlight behaviours among the study population (i.e. participants still limited their outdoor activities in line with the recommendations given during the haze). Previous studies have shown a significant association between ambient air pollution and low vitamin D status in children in India( Reference Agarwal, Mughal and Upadhyay 27 ) and pregnant women in France( Reference Baïz, Dargent-Molina and Wark 28 ). In addition, the cloud cover in Malaysia is generally high throughout the year with an average of 7·0 oktas/d reported in KL (indicating only a tiny portion of blue sky showing) with less seasonal variation( Reference Engel-Cox, Nair and Ford 29 ).
It is also possible that the low sunlight exposure among participants in KL is due to non-compliance in wearing the polysulfone badges. Although participants were instructed to wear the badge on the lapel (just under the collarbone), it is possible that the badge might have become covered up with scarfs (often worn by Asian females). Although this may also happen among Asian females in AB, this is less likely as badges were more likely to be pinned on a jacket rather than on scarfs (scarfs worn inside jackets). It is, unfortunately, not possible to distinguish between a participant not going outside or forgetting to wear the badge. For other sunlight-related behaviours, there were no marked differences between these two study populations.
The higher dietary vitamin D intakes among Asians in AB compared with those in KL may be explained by the frequent intake of oily fish among Asians in AB (AB, 66% v. KL, 59%). However, since a vitamin D database of Malaysian food is absent, there may be some underestimation if their fish were richer in vitamin D. Fortified foods (i.e. margarines and breakfast cereals) contribute a small amount to the total vitamin D intakes in both populations.
Our study has demonstrated that cutaneous synthesis of vitamin D provides ~60% of the total annual vitamin D intake among a population near the equator. At latitude of 57°N, a lower contribution from sunlight exposure (40–60%) was observed during spring and summer. Although Asians living in AB in the present study had lighter skin colour (type II–IV) than South Asians in Surrey (51°N; type V), a higher contribution from cutaneous synthesis of vitamin D (50–70%) was observed among those in Surrey likely due to the higher SED doses they received at lower latitudes in Southern England( Reference Macdonald, Mavroeidi and Fraser 7 ) and warmer climate compared with Scotland. In contrast, both lighter skin type and higher SED doses were likely factors in the higher contribution (60–80%) of cutaneous synthesis of vitamin D among the Caucasians in AB during spring and summer( Reference Macdonald, Mavroeidi and Fraser 7 ).
To the best of our knowledge, the current study was the first study in Malaysia to investigate sunlight exposure using an objective measure. A strength of the study is that the same questionnaires were used in two study sites and made available in two languages in KL. However, a limitation is that sunlight behaviours were self-reported, which is subject to recall bias and assumes that the individual’s pattern of behaviour was the same throughout each season. The use of polysulfone badges to capture actual sunlight exposure is limited by participants forgetting to wear the badges, or if the badges were covered up by clothing at any point. Skin colour was also self-reported and physical activity levels were not measured. Finally, there is no vitamin D database of Malaysian foods. However, every effort was made to match the foods appropriately and as the key foods providing vitamin D in these populations (oily fish and eggs) are not fortified, it is unlikely that the content would differ greatly between countries.
Conclusion
The extent of low UVB exposure as measured by the polysulfone badges among Asians in their home country is of concern. For Asians in AB, acquiring vitamin D needs from UVB exposure alone (except in summer) is challenging due to low ambient UVB. Promoting outdoor lifestyle with sensible sun protection and food-based strategies may be useful approaches to make up the shortfall in vitamin D needs among Asians in both locations and climates.
Acknowledgements
Acknowledgements: The authors are particularly grateful to all those who participated in this study. Financial support: This work was partly supported by a grant from the Universiti Kebangsaan Malaysia (project code: DPP-2013-100) and the Ministry of Higher Education of Malaysia for the PhD scholarship. The Universiti Kebangsaan Malaysia and Ministry of Higher Education of Malaysia had no role in the design, analysis or writing of this article. Conflict of interest: None. Authorship: The authors’ contributions were as follows. N.A.J., S.R.G. and H.M.M. contributed to designing of the study, the data analysis and interpretation, and wrote the manuscript. M.H.Y., Y.N.H. and B.K.P. did data collection in Kuala Lumpur. All authors critically reviewed the manuscript. Ethics of human subject participation: This study was conducted according to the guidelines laid down in the Declaration of Helsinki and all procedures were approved by the Research Ethics Committees of the University of Aberdeen (CERB/2013/3/895) and Universiti Kebangsaan Malaysia (UKM 1.5.3.5/244/NN-123-2013). All individuals gave their written informed consent prior to participating in the study.


