


Fe deficiency (ID) in children aged <2 years is twice as prevalent in New Zealand (NZ) as it is in Australia, Europe or the USA(Reference Karr, Alperstein, Causer, Mira, Lammi and Fett1–3). ID prevalence varies with ethnicity within NZ, being two to four times more prevalent in ethnic groups of non-NZ European origin(Reference Grant, Wall, Brunt, Crengle and Scragg4).
Development of effective national policy is central to the reduction of ID prevalence. In the USA, ID prevalence has decreased over the past 30 years in association with policy which has increased Fe intake(Reference Yip, Walsh, Goldfarb and Binkin5, Reference Yip, Binkin, Fleshood and Trowbridge6). Currently, less than 1 % of US children in this age group have inadequate Fe intakes(Reference Briefel, Hanson, Fox, Novak and Ziegler7). In contrast, in the UK, where policy is less well developed, Fe intake is lower with 89 % of children aged 1·5 to 4·5 years having a daily intake below the recommended 6·9 mg(Reference Gregory, Collins, Davies, Hughes and Clarke8).
Ethnic variability in ID prevalence is not always due to dietary intake. For example, the higher prevalence in Alaskan natives is partly due to increased gastrointestinal blood loss secondary to Helicobacter pylori infection(Reference Baggett, Parkinson, Muth, Gold and Gessner9). This infection is also common in Pacific ethnic groups in NZ(Reference Fraser, Scragg, Metcalf, McCullough and Yeates10). The prevalence of ID in Pacific children is 2·5 times greater than in NZ European children(Reference Grant, Wall, Brunt, Crengle and Scragg4).
To determine the potential for policy aimed at increasing Fe intake to reduce ID prevalence in NZ, we determined the proportion of children with adequate dietary Fe intake, whether dietary Fe intake varied between ethnic groups and whether Fe intake was associated with Fe status in different ethnic groups.
Methods
Study design
An ethnically stratified random sample of children aged 6–23 months, resident in Auckland, NZ, was enrolled in order to determine the prevalence of ID(Reference Grant, Wall, Brunt, Crengle and Scragg4). Eligible children were identified from random residential address start points with cluster sampling from the twenty consecutive dwellings to the right of each start point. Ethnicity was defined by the child’s caregiver. The present paper reports the data from the children who were enrolled in this prevalence study and from whom accurate 2 d weighed food record data were obtained.
There were no exclusion criteria. Enrolment of children with an acute infection was deferred for one month. The Health Funding Authority Ethics Committee approved the study.
Data collection
Data were collected in the child’s home. Written informed consent was obtained, the child’s caregiver interviewed and topical anaesthetic cream applied (EMLA, 2·5 % lignocaine–2·5 % prilocaine; AstraZeneca Ltd, Auckland, New Zealand).
Weight and length were measured supine. The mean of three serial measurements from each child, wearing light clothing and no shoes, was taken. These data were then converted to Z-scores using the WHO Anthro 2005 software package (WHO, Geneva, Switzerland), which uses data collected in the WHO Multicentre Growth Reference Study(Reference de Onis, Garza, Victora, Onyango, Frongillo and Martines11).
Dietary intake assessment
The caregivers were instructed on how to measure and accurately record all the food and drink consumed by the child over two non-consecutive days. All food was weighed on a digital electronic scale with a tare function. Provision was made for when meals were consumed outside the home. Telephone contact was maintained to assist with compliance and accuracy of recording.
Nutrient content of the weighed food intake records was determined from the NZ food composition database using the Foodworks Professional software package edition 3·02 (Xyris Software (Australia) Pty Ltd, Brisbane, Australia)(12). Breast milk intake was estimated using published reference data for infants receiving mixed diets(Reference Dewey, Heinig, Nommsen and Lonnerdal13). These estimations included breast-fed infants supplemented with other milks. The reference data were reported for ages 6, 9 and 12 months(Reference Dewey, Heinig, Nommsen and Lonnerdal13). For estimating intake volumes in our study we used the 6 month volumes for children from 6 to <7·5 months old, the 9 month volumes for children from 7·5 to <10·5 months old and the 12 month volumes for children from 10·5 to <13·5 months old(Reference Dewey, Heinig, Nommsen and Lonnerdal13). Data from children consuming less food than usual as quantified by their caregivers or for whom incomplete diaries were provided were excluded from analyses.
The main food sources of Fe were identified. For foods not in the database, recipes were made if ingredients were available or a best match made with the food items listed in the database. Meat and meat products were examined separately and then combined to describe haem Fe intake. Fe from other sources was considered non-haem. Total daily Fe intake and Fe intake from the different sources were determined for each day of dietary intake data. Probability estimates of usual dietary nutrient intake were made using the C-Side software (Iowa State University, Ames, IA, USA)(Reference Nusser, Carriquiry, Dodd and Fuller14).
In 2006, NZ adopted new nutrient reference values (Table 1)(15). These included revision of the Recommended Dietary Intakes (RDI), estimated Adequate Intakes (AI) where RDI could not be calculated, and introduced an Estimated Average (daily) Requirement (EAR). The RDI was increased and the EAR was established to provide a more practical estimate of dietary requirements given the wide variability in Fe requirements in this age group(15).
Table 1 New Zealand nutrient reference values for dietary iron intake for children aged 6–23 months(15)
*Recommended Dietary Intake; the daily intake sufficient to meet the nutrient requirements of nearly all (97–98 %) healthy individuals.
†Estimated Average Requirement; the daily intake necessary to meet the requirements of half the healthy individuals.
Measurement of Fe status
A venous blood sample was collected. Full blood count, serum transferrin saturation, and serum ferritin and C-reactive protein (CRP) concentrations were measured as previously described(Reference Grant, Wall, Brunt, Crengle and Scragg4).
ID was defined in a manner similar to the US National Health and Nutrition Examination Surveys (NHANES). In NHANES, ID was present if two or more of ferritin concentration, transferrin saturation and erythrocyte protoporphyrin concentration were abnormal(Reference Looker, Dallman, Carroll, Gunter and Johnson16). If in addition Hb concentration was low, then Fe-deficiency anaemia was present. We used the NHANES cut-off values for low Fe saturation (<10 %), low ferritin concentration (<10 μg/l) and low Hb (<110 g/l)(Reference Looker, Dallman, Carroll, Gunter and Johnson16). As an appropriate assay for erythrocyte protoporphyrin was not available, mean cell volume was used as the measure of erythrocyte Fe with abnormal defined as <73 fl(Reference Grant, Wall, Brunt, Crengle and Scragg4, 17). Children with an elevated CRP (>4 mg/l) were excluded.
Statistical analyses
Double-entered data were analysed using the Epi-info 2000 (Centers for Disease Control and Prevention, Atlanta, GA, USA) and SAS-PC version 9·1 (SAS Institute, Cary, NC, USA) software packages. Variables that were not normally distributed such as serum ferritin concentration were log-transformed.
Dietary factors associated with Fe status were examined using linear regression analysis, adjusting for the clustered study design and weighted for ethnic stratification using SAS-callable SUDAAN 9·0·1 (Research Triangle Institute, Research Triangle Park, NC, USA). Variables examined included food categories of dietary Fe intake and other factors known to influence dietary Fe absorption(18).
Results
Study sample enrolment
The 2 d weighed food record was collected from 247 of 307 children in whom Fe status was measured and CRP was normal (Fig. 1). A smaller proportion of those in whom a weighed food recorded was collected were Fe-deficient (11 % v. 27 %, P = 0·03).
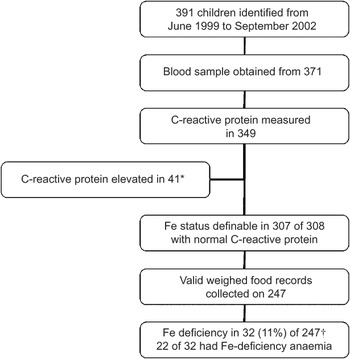
Fig. 1 Summary of enrolment, blood sampling and measurement of dietary iron intake and iron status in the study population: random sample of children aged 6–23 months, resident in Auckland, New Zealand. *New Zealand European, n 12; Maori, n 14; Pacific, n 13; other, n 2. †Percentage adjusted for clustering and weighted for ethnic stratification
Demographics and anthropometry
The proportion of the children living in households in the most socially deprived quintile (23 %; Table 2) was comparable to that for the Auckland metropolitan region (22 %)(20). Seventeen (6 %) children had a gestation less than 37 weeks and five (2 %) a birth weight less than 2·5 kg. The weight-for-height Z-score was greater than zero for 197 (73 %) children. The mean weight-for-height Z-score was greater for children aged 12–23 months compared with those aged 6–11 months (1·01 v. 0·55, P = 0·01). The mothers of 55 % of the children took Fe supplements during pregnancy (Table 2), with this proportion not varying between ethnic groups.
Table 2 Demographics, anthropometry and dietary habits of the study population: random sample of children aged 6–23 months, resident in Auckland, New Zealand
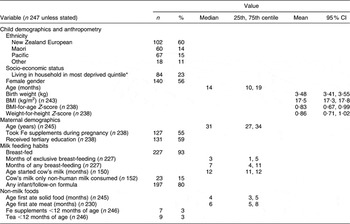
*Household deprivation measured using NZDep2001 Index of DeprivationReference Salmond and Crampton(19).
Past and current dietary habits of the children
Most (93 %) of the children were initially breast-fed, with exclusive breast-feeding continuing for a median of 3 months and any breast-feeding for a median of 7 months (Table 2). Thirty-nine children (25 %) commenced cow’s milk prior to age 12 months. Fifty (20 %) did not receive infant or follow-on formula.
Solids were introduced at age 3 months or younger for forty-nine (19 %) children and from 4 to 5 months of age for 144 (62 %) children. Solids were introduced at an older age for children of other ethnic groups compared with NZ European children (median 4·4 v. 3·6 months, P = 0·03). Meat was introduced at a younger age for Maori compared with NZ European children (5·7 v. 6·5 months, P = 0·001). The 3 % of children who received Fe supplements prior to age 12 months included only one of the seventeen children born prematurely.
Fe and energy intake by age group
Median energy intake approximated the estimated energy requirements for this age group (≈340 kJ/kg body weight)(15). Energy intake per kilogram of body weight did not vary with age (P = 0·09; Table 3) or gender (male v. female: 316 v. 351 kJ/kg, P = 0·38).
Table 3 Comparison of daily dietary intakes of energy, iron and modifiers of iron absorption for children 6–11 and 12–23 months old, Auckland, New Zealand
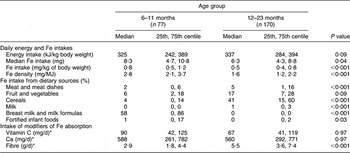
*Log(vitamin C), log(Ca) and log(fibre) used in age group comparisons.
The median daily dietary Fe intake (P = 0·04), Fe intake per kilogram of body weight (P < 0·001) and Fe intake per megajoule of energy intake (P < 0·001) were all significantly greater in the 6–11 month compared with the 12–23 month age group (Table 3).
Dietary sources of Fe varied with age (Table 3). In comparison with children aged 6–11 months, a larger percentage of the dietary Fe intake for children aged 12–23 months came from meat and meat dishes (5 % v. 2 %, P < 0·001), cereals (41 % v. 4 %, P < 0·001) and milk (1 % v. 0 %, P < 0·001); and a smaller percentage was from breast milk and milk formulas (0 % v. 58 %, P < 0·001) and fortified infant foods (0 % v. 1 %, P = 0·03).
Intake of modifiers of Fe absorption
Eighty-four per cent of the children met either the AI (age 6–11 months) or the RDI (age 12–23 months) for vitamin C intake. Sixty-one per cent met the AI (age 6–11 months) or the RDI (age 12–23 months) for daily Ca intake. Although dietary fibre intake was greater in the older age group (P < 0·001), fibre intake for all children was less than the AI which is defined only for this older age group.
Fe and energy intake by ethnic group
For children aged 6–11 months, the energy intake, Fe intake and percentage of Fe from different dietary sources did not vary with ethnicity (Table 4). For children aged 12–23 months, the median daily Fe intake for Pacific children was greater than for NZ European children (7·7 v. 6·3 mg, P = 0·04; Table 5).
Table 4 Daily dietary intakes of energy, iron and modifiers of iron absorption for children aged 6–11 months by ethnic group, Auckland, New Zealand (NZ)
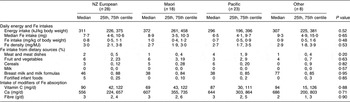
Table 5 Daily dietary intakes of energy, iron and modifiers of iron absorption for children aged 12–23 months by ethnic group, Auckland, New Zealand (NZ)
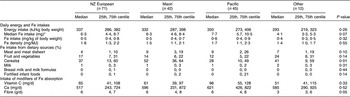
*Fe intake greater for Pacific v. NZ European (P = 0·04).
†Percentage Fe intake from meat and meat dishes greater for Pacific v. NZ European (P = 0·02).
‡Percentage Fe intake from cereals greater for Maori v. NZ European (P = 0·04).
For children aged 12–23 months, the percentage of Fe from different dietary sources varied with ethnicity (Table 5). In comparison with NZ European children, Maori children obtained a larger percentage from cereals (52 % v. 37 %, P = 0·04). In comparison with NZ European children, Pacific children obtained a larger percentage from meat and meat dishes (9 % v. 4 %, P = 0·02).
Adequacy of Fe intake and association with Fe deficiency
For children aged 6–11 months the EAR for Fe was achieved by 59 % and the RDI by 22 %, and for children aged 12–23 months the EAR was achieved by 81 % and the RDI by 22 %. In the 12–23 month age group, in comparison with NZ European children, a larger proportion of Pacific children met the RDI (40 % v. 17 %, P = 0·01).
Not meeting the EAR was associated with an increased risk of ID for children aged 6–11 months (relative risk (RR) = 18·45, 95 % CI 3·24, 100·00) and 12–23 months (RR = 4·95, 95 % CI 1·59, 15·41). For children aged 6–11 months, not meeting the RDI was also associated with an increased risk of ID (RR = 3·26, 95 % CI 3·17, 100·00).
Fe intake and association with body Fe stores
Total Fe intake was positively associated with serum ferritin for children aged 6–11 months (P < 0·001; Table 6) and 12–23 months (P = 0·01; Table 7). Within ethnic groups this association of increased Fe intake with increased serum ferritin was present in the 6–11 month age group for Maori (P = 0·03), Pacific (P = 0·01) and children of other non-NZ European groups (P < 0·001; Table 6), and for 12–23-month-old NZ European children (P = 0·03; Table 7).
Table 6 Univariate associations of dietary intake of iron and modifiers of iron absorption with log(serum ferritin; μg/l) for children aged 6–11 months, Auckland, New Zealand (NZ)
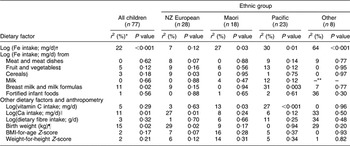
*Percentage of variance in value of log(serum ferritin) explained by regression model.
†For all significant associations, as log(Fe intake) increased, log(serum ferritin) increased.
‡For Pacific children, as log(Fe from fruit and vegetables) increased, log(serum ferritin) increased.
§As log(Fe from cereals) increased, log(serum ferritin) decreased.
∥As log(Ca) increased, log(serum ferritin) decreased.
¶As birth weight increased, log(serum ferritin) increased.
**β coefficient could not be estimated.
Table 7 Univariate associations of dietary intake of iron and modifiers of iron absorption with log(serum ferritin; μg/l) for children aged 12–23 months, Auckland, New Zealand (NZ)
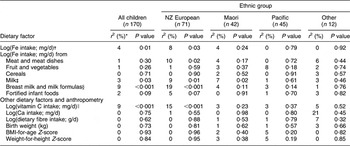
*Percentage of variance in value of log(serum ferritin) explained by regression model.
†For all significant associations, as log(Fe intake) increased, log(serum ferritin) increased.
‡As log(Fe from milk) increased, log(serum ferritin) decreased.
§As log(Fe from formulas and breast milk) increased, log(serum ferritin) increased.
∥As log(Ca) increased, log(serum ferritin) decreased.
For children aged 6–11 months (Table 6), serum ferritin increased as birth weight (P = 0·02) and as Fe from formulas and breast milk increased (P = 0·02) and decreased as Ca intake increased (P = 0·01). For children aged 12–23 months (Table 7), serum ferritin increased as Fe from formulas and breast milk increased (P < 0·001) and as vitamin C intake increased (P < 0·001). Serum ferritin decreased as Fe intake from non-human or non-formula milk increased (P = 0·03).
Associations between dietary factors and serum ferritin varied with ethnicity (Tables 6 and 7). They were present for NZ European and Maori children in both age groups and for Pacific children aged 6–11 months.
For NZ European children aged 6–11 months (Table 6), serum ferritin decreased as Fe intake from cereals increased (P = 0·03) and as Ca intake increased (P = 0·01). In the 12–23 month age group (Table 7), serum ferritin increased as Fe intake from meat and meat dishes (P = 0·02), milk formulas and breast milk (P < 0·001) increased and as vitamin C intake increased (P < 0·001). Ferritin decreased as Fe intake from milk increased (P = 0·01).
Among Maori children, for those aged 6–11 months serum ferritin increased as vitamin C intake increased (P = 0·03; Table 6) and for those aged 12–23 months serum ferritin decreased as Fe intake from milk increased (P = 0·02; Table 7). For Pacific children aged 6–11 months (Table 6), serum ferritin increased as Fe intake from breast milk and formula milk (P = 0·003) increased and as vitamin C intake increased (P < 0·001).
Discussion
Fe intake was less than the EAR for 25 % of the children in the present study. In the 12–23 month age group, dietary sources of Fe varied with ethnicity. In comparison with NZ European children, Pacific children had a greater daily Fe intake with a larger proportion of their dietary Fe from meat and meat dishes. For Maori children a larger proportion of dietary Fe was from cereals.
Fe intake was associated with body Fe status. Not meeting the EAR increased the risk of ID. Increased Fe intake was associated with increased body Fe stores as measured by serum ferritin concentration. The observed positive (birth weight, breast milk and milk formulas intake, vitamin C intake) and negative (Ca and non-human, non-formula milk intake) associations with Fe status are consistent with the published literature on birth weight, dietary Fe bioavailability and absorption(18).
The relationship between dietary Fe intake and Fe stores varied with ethnicity. For NZ Europeans, total Fe intake was associated with Fe stores for children aged 12–23 months but not for those who were younger. In the 6–11 month age group, Fe stores increased as birth weight increased and decreased as Fe intake from cereals increased and as Ca intake increased. In the 12–23 month age group, Fe stores increased as vitamin C intake increased and as Fe intake from meat and meat dishes, breast milk and milk formulas increased. Fe stores decreased as Fe intake from other milks increased.
For Maori children, Fe intake was associated with Fe stores in both age groups. For Maori children aged 6–11 months, Fe stores increased as vitamin C intake increased; for those aged 12–23 months, Fe stores decreased as Fe intake from other milk increased. For Pacific children, Fe intake was associated with Fe stores for children 6–11 months old but not for those who were older. In this younger age group Fe intake from breast milk and formulas and vitamin C intake were associated with increased Fe stores. Notably, there were no significant associations of dietary Fe intake with Fe stores for Pacific children aged 12–23 months.
The average daily Fe intake in the present study was comparable to that previously reported for NZ European children. In a random sample of NZ European children who were not breast-fed, the mean daily Fe intake was 8·4 mg (age 6–11 months) and 5·0 mg (age 12–24 months)(Reference Soh, Ferguson, McKenzie, Skeaff, Parnell and Gibson21). In a self-selected sample of NZ European infants, daily dietary Fe intakes were 7·8 mg at 9 months and 4·9 mg at 18 months of age(Reference Heath, Tuttle, Simons, Cleghorn and Parnell22). The predominant sources of dietary Fe were similar; milk formula and breast milk for those <12 months old and cereals for those aged 12 months and older(Reference Soh, Ferguson, McKenzie, Skeaff, Parnell and Gibson21).
The median daily Fe intake of children in the present study was low compared with the 2002 US Feeding Infants and Toddlers Study (FITS). In FITS, daily Fe intake was 15·2 mg for children 7–11 months old and 9·0 mg for children 12–24 months old. These values are 83 % and 43 % greater than for the comparable age groups in our study(Reference Devaney, Ziegler, Pac, Karwe and Barr23). The energy intakes of the FITS participants were also significantly higher than those in the present study. The methodological differences between these studies do not explain the large differences in Fe intake.
What explains this lower Fe intake in NZ compared with the USA? General dietary habits did not differ in any consistent manner that explains lower Fe intake. For example, both the proportion of children breast-fed at birth (93 % in present study v. 76 % in FITS) and the median duration of breast-feeding (7 v. 6 months) were comparable, as were the proportion ever fed infant formula (80 % v. 90 %), cow’s milk prior to age 12 months (25 % v. 41 %) and weaning foods at less than age 4 months (19 % v. 29 %).
Fe supplement use during infancy by children in the present study was less than in FITS (3 % v. 24 %)(Reference Briefel, Hanson, Fox, Novak and Ziegler7). However, this explains only a proportion of the difference in the adequacy of Fe intake between the children enrolled in these two studies. Of the children in the FITS study who were not receiving Fe supplements, median daily Fe intake was 14·7 mg for 6–11-month-old children and 8·2 mg for 12–24-month-old children, 77 % and 30 % more respectively than that in the same age groups in the present study(Reference Briefel, Hanson, Fox, Novak and Ziegler7).
Lower Fe content of infant cereals in NZ compared with the USA is one potential explanation. In the USA, infant cereals contain at least 45 mg Fe/100 g cereal(24). This level of fortification is effective in preventing ID(Reference Walter, Dallman, Pizarro, Velozo, Peña, Bartholmey, Hertrampf, Olivares, Letelier and Arredondo25). In NZ, Fe fortification of infant cereals is mandatory only for products used from 6 to 12 months of age and ranges between 20 and 50 mg Fe/100 g dry cereal(26).
The contribution that dietary factors make to Fe status varied with ethnicity in two ways. First, despite having a larger daily Fe intake and a larger proportion of dietary Fe from meats and meat dishes, Pacific children are at increased risk of ID(Reference Grant, Wall, Brunt, Crengle and Scragg4). Second, there were fewer associations between dietary factors and Fe status for Maori or Pacific children compared with NZ European children. Both of these observations imply that non-dietary factors may be more important determinants of Fe status for Maori and Pacific children.
One of the more important non-dietary factors that affect nutritional status is communicable disease burden(Reference Keusch27). For both Maori and Pacific ethnic groups, the frequency and severity of communicable diseases are greater in early childhood(28). These illness episodes are likely to have a negative effect on Fe status by both decreasing dietary intake and altering Fe metabolism as part of the acute-phase response(Reference Keusch27, Reference Roy and Andrews29). Thus policy that seeks to reduce ID prevalence in these ethnic groups needs to consider the cyclical relationship of poor nutrition and increased susceptibility to communicable diseases. ID needs to be considered in the broader context of deficiencies in multiple nutrients and the adverse effect this has on the health of these populations(Reference Black, Allen, Bhutta, Caulfield, de Onis, Ezzati, Mathers and Rivera30).
The sample of children on whom these findings were based was biased. In comparison with the recruited children in whom valid weighed food records were not collected, our sample had fewer children with ID. It is likely therefore that we have underestimated the proportion of children in whom dietary Fe intake was inadequate.
The number of non-Maori, non-Pacific and non-NZ European children enrolled was insufficient to enable many conclusions to be drawn about dietary determinants of their Fe status. As many of these children are new immigrants they will be at risk of consuming diets that do not contain sufficient Fe(Reference Yeung and Kwan31). The proportions with Fe intakes less than the EAR (24 %) and less than the RDI (80 %) are consistent with this. As population diversity in NZ is projected to increase, the nutritional adequacy of the diets of these ethnic groups requires greater attention(32).
In the present study dietary Fe intake was derived from two days of weighed diet records for each individual. Although this is not able to provide a true estimate of usual intake, fewer days of dietary record are required to estimate intakes accurately in young children than in other age groups(Reference Nelson, Black, Morris and Cole33). Quantifying associations between dietary Fe intake and biochemical indices of Fe status is challenging due to the inability to accurately measure the bioavailability of Fe from different foods and food combinations eaten as meals. However, we were able to demonstrate the impact of enhancers and inhibitors of dietary Fe absorption on body Fe stores as measured by serum ferritin.
Estimated breast milk volume was determined using DARLING study data derived from test weighing corrected for insensible water losses during feeding(Reference Dewey, Heinig, Nommsen and Lonnerdal13). These volumes are higher than more recent reported studies in developed countries and could therefore result in a small overestimate of intake(Reference Brown, Dewey and Allen34).
The present study highlights the need for more effective infant nutrition policy in NZ. If the prevalence of ID is to be reduced in this age group then Fe intake needs to be increased. Improving the Fe density of the diet and acknowledging ethnic differences in food intake that may impact on Fe status should be key policy initiatives.
Assuming no change in current dietary practices, this will require more fortification of the predominant foods consumed by young children. The comparisons made with the USA indicate that greater Fe fortification of infant cereals would appear necessary. Infant Fe supplements need to be given more consistently to premature infants. That increased consumption of non-human, non-formula milks by children aged 12–23 months had a negative effect on body Fe stores requires consideration of the use of formula milks to extend past the currently recommended age of 12 months. The enhancing effect of vitamin C on Fe status that was present in ethnic-specific analyses suggests this has the potential to play an important role in policy aimed to improve Fe status.
ID has remained prevalent in NZ since it was first identified as a child public health issue in the 1960s(Reference Akel, Frankish, Powles, Tyler, Watt, Weston and Prior35). If NZ truly desires to build a knowledge economy it must first secure the educational potential of its next generation(36). Reducing the proportion of its children exposed to the adverse cognitive, behavioural and educational consequences of ID is necessary if the nation’s intellectual capital is to be realised(Reference Pollitt37, Reference Lozoff, Jimenez, Hagen, Mollen and Wolf38).
Acknowledgements
The project was funded by the Health Research Council of New Zealand (Project Grant # 99/075). D.R.B. was funded by a research grant from The Starship Foundation, with this grant made possible by financial support from Only Organic Baby Food. The authors have no competing interests to declare. All authors were involved in the design of the study. C.C.G. and C.R.W. supervised the collection of the data. C.R.W. and DRB performed the data analysis and interpretation. C.C.G. completed the first draft of the manuscript which was edited and revised by C.R.W. and D.R.B.


