


Globally, maternal and child undernutrition are an underlying cause of 3·1 million child deaths annually and are a contributing factor in 45 % of child deaths( Reference Black, Victora and Walker 1 ). An estimated 28 % of children in low- and middle-income countries are chronically malnourished and globally 165 million children under the age of 5 years are stunted( Reference Black, Victora and Walker 1 ). Early childhood undernutrition is associated with cognitive and physical defects, increased susceptibility to infections and higher risk of death( Reference Victora, Adair and Fall 2 , Reference Olofin, McDonald and Ezzati 3 ). Given the long-lasting sequelae of child undernutrition, effective, early interventions are critical for maximizing developmental potential and facilitating post-conflict recovery by improving the health status of future generations.
Conflict in the Democratic Republic of Congo (DRC) resulted in an estimated 5 million deaths between 1994 and 2003, primarily from undernutrition and disease( Reference Coghlan, Brennan and Ngoy 4 ). DRC’s eastern provinces of North and South Kivu were among the most severely affected by the conflict and child health and nutritional status has remained poor. South Kivu has the highest rate of under-five mortality (139 deaths/1000 live births) and stunting prevalence (53 %) of all provinces in DRC, where, nationally, the under-five mortality rate is 104 deaths/1000 live births and stunting prevalence is 43 %( 5 ). To address food insecurity and child undernutrition in South Kivu Province, the Office of Food for Peace of the US Agency for International Development funded a development food assistance programme, Jenga Jamaa II, from 2012 to 2016. Jenga Jamaa II interventions aimed to improve food security and child nutrition through different pathways and included: (i) the prevention of malnutrition in children under two approach (PM2A)( Reference Ruel, Menon and Habicht 6 ); (ii) farmer field schools (FFS); (iii) farmer-to-farmer training (F2F); and (iv) women’s empowerment groups (WEG).
Evidence on the effectiveness of these types of intervention in improving child diet and nutrition outcomes is mixed. PM2A interventions, which include rations distributed to pregnant and lactating women and children aged 6–23 months, along with a health and nutrition behaviour change strategy, were found to improve child diet in Burundi and were associated with a 4–6 % reduction in stunting prevalence in Haiti( Reference Ruel, Menon and Habicht 6 , Reference Leroy, Olney and Ruel 7 ); however, the approach, which is commonly used in development food assistance programmes, has not been widely evaluated with respect to child diet and growth outcomes. Most of the agricultural interventions that have been evaluated in relation to child diet and nutritional status have consisted of household gardens or promotion of one specific crop, and less is known about the effects of larger-scale interventions designed to increase harvest yields through education and improved seeds and tools( Reference English, Badcock and Giay 8 – Reference Masset, Haddad and Cornelius 10 ). Numerous studies have identified aspects of women’s empowerment, particularly autonomy, to be positively associated with child diet and nutritional status, but there have been few evaluations of multifaceted women’s empowerment approaches in relation to improvements in child diet and growth indicators( Reference Begin, Habicht and Frongillo 11 – Reference Smith, Ramakrishnan and Ndiaye 15 ). Income-generating interventions targeted at women have been successful in improving child outcomes in food-insecure contexts including Ghana and Ethiopia( Reference Marquis and Colecraft 16 , Reference Doocy, Teferra and Norell 17 ). The present study evaluated the effectiveness of the four different Jenga Jamaa II interventions with respect to child diet and nutrition indicators and aimed to contribute to the evidence base for nutrition programming in post-conflict settings; study results on household food security are presented elsewhere( 18 ).
Methods
Setting and interventions
Jenga Jamaa II was implemented by the Adventist Development and Relief Agency in Fizi and Uvira territories of South Kivu between 2011 and 2016 (Fig. 1). The programme aimed to address high levels of household food insecurity and child undernutrition and reached over 258000 beneficiaries. The objectives of Jenga Jamaa II were to: (i) increase incomes among food-insecure farming households (FFS and F2F interventions); (ii) improve the health and nutritional status of children under 5 years of age (PM2A); and (iii) empower women (via WEG) in food-insecure communities (Table 1).
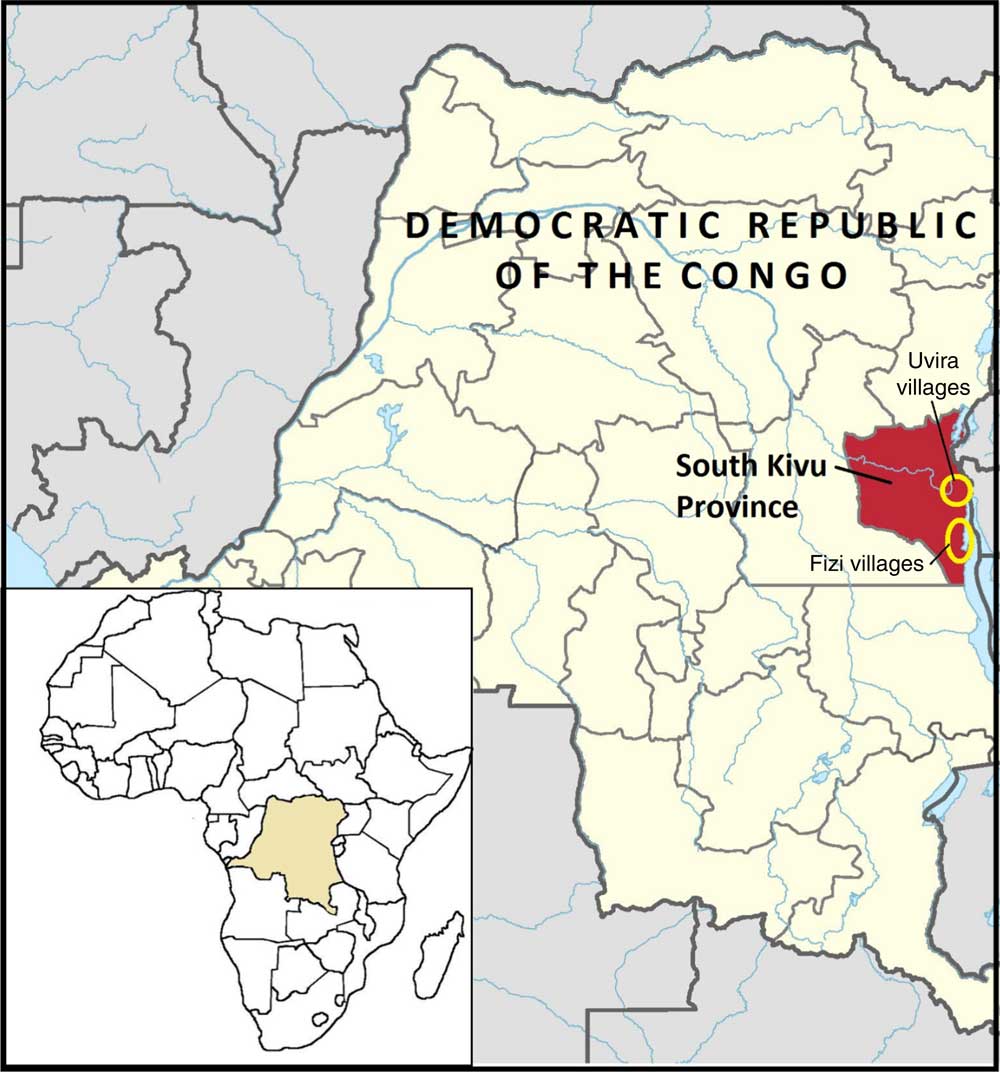
Fig. 1 (colour online) Map of the Jenga Jamaa II programme and study area( 38 )
Table 1 Summary of Jenga Jamaa II objectives and interventions
FFS, farmer field schools; F2F, farmer-to-farmer training; PM2A, prevention of malnutrition in children under two approach; WEG; women’s empowerment groups.
The FFS intervention provided hands-on education on farming practices, post-harvest natural resource management, and business skills to farmers through biweekly trainings; participants also received starter packages of seeds and tools. After the two-year FFS intervention, many beneficiaries transitioned to farmer business associations, which were designed to improve access to credit and marketing opportunities. In F2F, which was designed as a less resource-intensive and scalable approach to improving agricultural production, FFS participants trained three farmers from their community on FFS techniques. PM2A targeted pregnant women and children under 2 years of age using the care group method, where volunteer leader mothers were trained in child health and nutrition and messages were disseminated to beneficiaries in care group meetings and during home visits; homestead gardens were also promoted and monthly rations (corn–soya blend and vitamin A-fortified oil) were provided. WEG met weekly and served as a delivery mechanism for a variety of interventions including literacy and numeracy, business and marketing training, and income-generating activities (primarily soap-making, bread-making and fish-drying). WEG beneficiaries were provided with a starter kit of basic materials for their income-generating activity and savings and credit groups were started in each WEG; many WEG participants also received goats and energy-efficient stoves.
Sample size
The study was powered to detect a ≥10 % reduction in prevalence from baseline of household food insecurity indicators (the primary outcome measure) within each comparison group, which yielded a minimum sample size of 325 households per group or 1625 households in total. This sample size was sufficient to detect endline differences from the control group of ≥8·5 % for the proportion of children with adequate dietary diversity and ≥10·5 % for stunting prevalence, with a significance level of 0·05.
Study design and data collection
A quasi-experimental matched design was used, where communities planned to receive one intervention (as opposed to communities that received multiple interventions) were eligible for participation so that the effect of individual interventions could be assessed. Communities were matched by territory (Fizi or Uvira) and livelihoods zone (mountains, plains or lakeside) into thirteen sets of similar villages. In the PM2A villages, two PM2A groups, each with approximately fifteen beneficiaries, each were selected for participation. In WEG villages, one WEG group of twenty-five participants was selected; each WEG beneficiary was matched with a female neighbour not participating in Jenga Jamaa II interventions, who was enrolled as a member of the control group. In agriculture villages, one FFS with approximately thirty participants was enrolled; one of three F2F trainees of each FFS participant was randomly selected to comprise the F2F group. Enrolment occurred between August and October 2012, and a total of 1820 beneficiaries and 1385 child household members born between July 2010 and December 2012 were enrolled.Footnote * Participants were followed for 3·5 years through February/March 2016, regardless of if they graduated or dropped out of the intervention. Data were collected in eight semi-annual surveys (August/September and February/March) to account for seasonality.
Adequacy of children’s diet was assessed using the WHO indicators for infant and young child feeding practices( 19 ). Caregiver reports of child food consumption on the preceding day were used to determine the number of food groups consumed which equated to the dietary diversity score (range 0–7); children consuming ≥4 food groups were classified as achieving minimum dietary diversity. To ascertain meal frequency, mothers were asked the number of meals and snacks consumed by their child the previous day. Children were classified as achieving minimum meal frequency if meal frequency was ≥2 for breast-fed infants aged 6–8 months, ≥3 for breast-fed children aged 9–23 months and ≥4 times for non-breast-fed children older than 6 months. Children who achieved both minimum meal frequency and dietary diversity were classified as achieving minimum acceptable diet. The questionnaire was developed in English and translated to Swahili, the predominant local language, and was finalized following pilot testing and translation review. Child anthropometric data (weight and height) were collected at each survey. Weight was measured using Tanita Mommy and Baby Infant Scales, model 1582 (Arlington Heights, IL, USA) and height using Shorr Productions height boards (Olney, MD, USA); recumbent length was measured for children 6–23 months of age and height for children aged ≥24 months.
Enumerators were recruited from programme staff and data collection was supervised by a field coordinator; in most cases, interviews were completed by staff members who did not have regular interaction with the respondent. Enumerators received an orientation to the study and training on ethical conduct, questionnaire administration and anthropometric assessment at the beginning of the study and standardization for anthropometric measurements was conducted; refresher trainings were conducted prior to each survey. Due to high levels of illiteracy, oral consent was obtained at enrolment and each subsequent survey; participants were reminded that participation was voluntary and that declining would not impact benefits received from Jenga Jamaa II. Participants received a small incentive, worth approximately $US 1, for participation in each survey, most often soap.
Statistical analysis
Data analysis was performed using the statistical software package Stata version 13. Exploratory analysis included calculating unadjusted means and prevalence of binary indicators for each survey and identifying outliers; assessing patterns of missing data and dropouts across study groups and differences in outcomes between those who had dropped out or been absent for the previous survey and those who had not; and assessing correlation over time using autocorrelation matrices for continuous outcomes and lorelograms for binary outcomes( Reference Heagerty and Zeger 20 ). Children who died (n 73) were excluded from the analysisFootnote * and missing values for maternal age (n 35) and education (n 45) were assigned the mean and mode of those variables, respectively, so they could be included in the analysis.
Continuous Z-scores for height-for-age (HAZ) and weight-for-age (WAZ) were assessed. The primary outcome indicators for child growth were stunting (HAZ<−2) and underweight (WAZ<−2); wasting was not included as a key indicator in the final analysis due to low prevalence (typically from 1 to 3 % at each survey). Anthropometric Z-scores for children 6–59 months of age were calculated using the 2006 WHO child growth standards with the user-written Stata program Zscore06( 21 ). To estimate differences in outcomes between groups over time, the ANCOVA approach was used to estimate mean change in the outcome variable by comparing the last follow-up with baseline separately for each treatment group; the outcome at endline for each intervention group was then compared with the control group. ANCOVA allows precision of the estimate to be gained by accounting for chance imbalance across intervention groups in baseline variables that are prognostic for the outcome of interest (e.g. stratification variables and the baseline outcome). A linear model for the outcome at the last follow-up was used with main terms for intervention group (four dummy variables), the baseline outcome, two stratification variables (territory and livelihoods zone) and maternal age and education. Propensity scores were created for each intervention group to account for the non-randomized design and models included propensity score weights; variables considered prognostic of treatment group assignment and used to define the propensity score weights included participant sex, age and education,Footnote † household landownership and number of income sources, and number of children <2 years in the household. Model coefficients for each treatment group represent the estimated difference compared with the control group for that respective intervention group.
To account for possible clustering within a household, the model included a random intercept defined for each household (i.e. allowing the children within a household to be correlated, children from different households are assumed independent). Due to lower child participation rates towards the end of the study, a multiple imputation approach was used to create complete data sets; missing values were replaced by values sampled from a distribution defined by the fit of a linear regression model for the outcome at a given follow-up as a function of previous outcomes, child age and sex. The methods described above were applied to each survey data set and then averaged using Rubin’s method to obtain final estimates( Reference Rubin 22 ).
For binary outcomes, prevalence at the last follow-up was estimated for each intervention group; the treatment effect was defined as the difference in prevalence comparing each intervention group with the control. The analysis included adjustment for the stratification variables, baseline outcome and maternal characteristics. To estimate the treatment effects, an outcome regression estimator referred to as the doubly robust weighted least-squares estimator was used, which is synonymous to the ANCOVA approach but applies to non-continuous outcomes( Reference Robins, Sued and Lei-Gomez 23 , Reference Colantuoni and Rosenblum 24 ). Standards errors, confidence intervals and P values were generated using a bootstrap. For binary outcomes related to children’s diet where only a small percentage of children achieved minimum meal frequency and acceptable diet, Fisher’s exact test was used.
Ethical approvals
Approval to conduct operations research was obtained from local authorities in the relevant administrative areas and by the Johns Hopkins Bloomberg School of Public Health Institutional Review Board.
Results
A total of 1820 households were enrolled in the study of which 1113 (61·2 %) had one or more children enrolled. Characteristics at enrolment of children and households with children are presented in Table 2. A total of 1385 children were enrolled (Fig. 2) and 1312 children were included in the analysis, where children who died during the follow-up period (n 73) were excluded. The mean age of children at enrolment was 11·4 months; children in the PM2A group were younger at enrolment (mean age 10·6 months) compared with other groups. Of participating children, 48·1 % were male; this proportion was similar across groups. Mean household size was 6·5 members and differed significantly between groups, ranging from 6·1 in the F2F group to 6·8 in the FFS group. Mean maternal age was 29·2 years and differed significantly between groups, ranging from 28·0 years (PM2A) to 31·9 years (WEG); mothers had on average 3·0 years of education and this was similar across groups. Slightly more than one-fifth (22·6 %) of households had a pregnant member at baseline; this proportion differed significantly between groups and was notably higher in the PM2A group (29·1 %). Households had an average of 1·0 children aged <2 years and 2·1 children aged 2–4 years; the mean number of children <2 years old differed significantly between groups. A majority (68·9 %) of households reported farmland ownership and this proportion was similar across groups. A mean of 1·2 income sources were reported; this differed significantly between groups and was highest in the FFS group (1·3) and lowest in the control group (1·0). With respect to location, more than half (52·0 %) of participants resided in Uvira territory and the remaining 48·0 % in Fizi territory. The majority lived in the plains livelihoods zone (54·4 %) with minorities in the lakeside (31·1 %) and mountain (14·6 %) zones. There were no significant differences in residence location by territory or livelihoods zone between groups.
Table 2 Characteristics at enrolment of Jenga Jamaa II study children and households, South Kivu, Eastern Democratic Republic of the Congo
WEG, women’s empowerment groups; PM2A, prevention of malnutrition in children under two approach; FFS, farmer field schools; F2F, farmer-to-farmer training.
* Five group comparison using Pearson’s χ 2 for proportions and F test for means (ANOVA); significant P values are indicated in bold font.
† Excludes seventy-three children who died in the follow-up period.
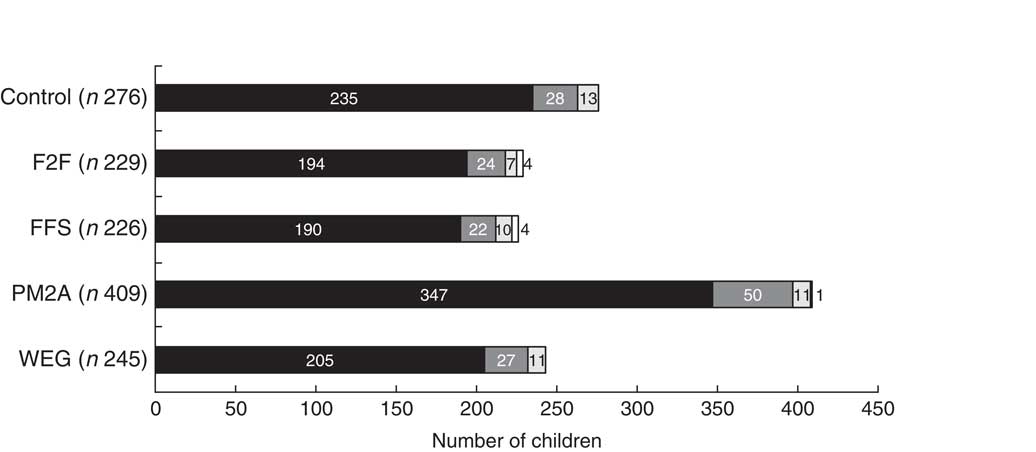
Fig. 2 Number of children enrolled in the Jenga Jamaa II programme over time (
![]() , August/September 2012;
, August/September 2012;
![]() , February/March 2013;
, February/March 2013;
![]() , August/September 2014;
, August/September 2014;
![]() , February/March 2014), by study group (F2F, farmer-to-farmer training; FFS, farmer field schools; PM2A, prevention of malnutrition in children under two approach; WEG; women’s empowerment groups), from South Kivu, Eastern Democratic Republic of the Congo. In total, 1385 children were enrolled
, February/March 2014), by study group (F2F, farmer-to-farmer training; FFS, farmer field schools; PM2A, prevention of malnutrition in children under two approach; WEG; women’s empowerment groups), from South Kivu, Eastern Democratic Republic of the Congo. In total, 1385 children were enrolled
Children’s diet outcomes
Adjusted analysis of the endline differences in children’s dietary diversity, meal frequency and minimum acceptable diet compared each intervention group with the control group and are presented in Table 3. Both the PM2A group (β=0·55; 95 % CI 0·20, 0·91; P=0·002) and the FFS group (β=0·46; 95 % CI −0·01, 0·93; P=0·049) had significantly higher mean dietary diversity scores compared with the control group at endline, whereas the WEG and F2F groups had dietary diversity scores similar to the control group. The prevalence of children achieving minimum dietary diversity, defined as consuming ≥4 food groups on the preceding day, ranged from 28·0 to 39·7 %; children in both the PM2A and FFS groups had significantly higher prevalence of achieving target dietary diversity as compared with controls (PM2A: 16·9 %; 95 % CI 4·0, 29·7 %; P=0·009; FFS: 14·4 %; 95 % CI 0·2, 28·5 %; P=0·042). The three principal intervention groups (WEG, FFS and PM2A) all had significantly higher mean meal frequency compared with the control group (WEG: 0·25; 95 % CI 0·02, 0·47; P=0·027; FFS: 0·30; CI 0·05, 0·55; P=0·015; PM2A: 0·32; 95 % CI 0·15, 0·49; P<0·001). Very few children attained minimum meal frequency, ranging from a low of 0·7 % (control group) to a high of 7·6 % (PM2A group). Except for the PM2A group, which had a significantly higher proportion of children achieve minimum meal frequency (P=0·001), there were no significant differences in meal frequency between the other intervention groups and the control group. The final dietary indicator assessed was minimum acceptable diet, a composite indictor that reflects children who have attained both minimum dietary diversity and minimum meal frequency. At endline, the proportion of children achieving minimal acceptable diet ranged from a low of 0·7 % (control group) to 5·8 % (PM2A); the PM2A group was the only group with a statistically significantly higher percentage of children achieving minimum acceptable diet as compared with controls (P=0·009).
Table 3 Differences in child diet measures at endline, Jenga Jamaa II programme, South Kivu, Eastern Democratic Republic of the Congo, February/March 2016
WEG, women’s empowerment groups; PM2A, prevention of malnutrition in children under two approach; FFS, farmer field schools; F2F, farmer-to-farmer training.
P values test for significant difference compared with the control group using Fisher’s exact test; significant P values are indicated in bold font.
* Adjusted for baseline dietary diversity score, territory, livelihoods zone, maternal age and maternal education.
† Adjusted for baseline minimum dietary diversity, territory, livelihoods zone, maternal age and maternal education.
‡ Adjusted for baseline meal frequency, territory, livelihoods zone, maternal age and maternal education.
Child growth outcomes
Adjusted analysis of the endline differences in child stunting and underweight compared each intervention group with the control group and are presented in Table 4. No significant differences in endline HAZ were found between any of the intervention groups compared with the control group. Similarly, there were no significant differences observed in endline stunting prevalence between any of the intervention groups and the control group; endline stunting prevalence was lowest among the PM2A group (54·7 %; 95 % CI 48·9, 60·6 %) and highest among the F2F group (69·1 %; 95 % CI 60·2, 78·0 %); however, there were no statistically significant differences in endline stunting prevalence between any comparison group and the control group, indicating that programme interventions did not improve linear growth. Similar findings were observed for child underweight measures, where no significant differences between intervention groups and the control group were observed for adjusted endline measures of WAZ and underweight prevalence; endline underweight prevalence was lowest in the FFS (22·3 %) and PM2A groups (23·0 %) and highest in the F2F group (34·4 %). Despite the lack of statistically significant differences in endline stunting and underweight prevalence, the adjusted difference in prevalence of stunting and underweight between the PM2A group and controls was −4·0 and −6·8 %, which is a considerable difference in a programmatic context. Similarly, the adjusted difference in prevalence of underweight between the FFS group and the control group was −7·6 %, indicating that both PM2A and FFS interventions may have the potential to impact child growth outcomes, even though the study was not adequately powered to detect these levels of differences with statistical significance.
Table 4 Differences in child nutrition measures at endline, Jenga Jamaa II programme, South Kivu, Eastern Democratic Republic of the Congo, February/March 2016
HAZ, height-for-age Z-score; WAZ, weight-for-age Z-score; WEG, women’s empowerment groups; PM2A, prevention of malnutrition in children under two approach; FFS, farmer field schools; F2F, farmer-to-farmer training.
P values test for significant difference compared with the control group using Fisher’s exact test; significant P values are indicated in bold font.
* Adjusted for baseline HAZ, territory, livelihoods zone, maternal age and maternal education.
† Adjusted for baseline stunting status, territory, livelihoods zone, maternal age and maternal education.
‡ Adjusted for baseline WAZ, territory, livelihoods zone, maternal age and maternal education.
§ Adjusted for baseline underweight status, territory, livelihoods zone, maternal age and maternal education.
Discussion
From a programmatic perspective, the PM2A and FFS interventions were modestly successful in increasing dietary diversity, with children in these groups consuming approximately 0·5 additional food groups daily and 15 % more children meeting dietary diversity targets as compared with the control group. At endline, the PM2A group had the highest prevalence of children achieving minimum meal frequency and minimum acceptable diet as compared with the control group; however, given that <6 % of children in the PM2A group achieved minimum acceptable diet, the intervention cannot be considered as effective in improving child diet. In terms of child nutrition outcomes, no statistically significant differences were found between intervention groups and the control group at endline for mean Z-scores or prevalence rates for either stunting or underweight. However, compared with the control group, stunting prevalence was 4 % lower among the PM2A group and underweight prevalence was approximately 7 % lower in both the PM2A and FFS groups, which are notable differences that suggest these interventions do impact child nutritional status and that further research powered to assess child anthropometric indicators is warranted.
With respect to the women’s empowerment intervention, different aspects of empowerment including economic, education and autonomy measures have been positively associated with child feeding indicators in various developing country settings( Reference Begin, Habicht and Frongillo 11 – Reference Smith, Ramakrishnan and Ndiaye 15 , Reference Ickes, Hurst and Flax 25 – Reference Brunson, Shell-Duncan and Steele 27 ). The present study did not measure the impact of the WEG intervention on women’s autonomy or income; however, the poor status of women in the DRC may have made it especially challenging to improve women’s status and subsequently to improve child outcomes. Labour-saving techniques and non-agricultural income-generating activities supported by WEG had the potential to provide women with more time and resources to feed children throughout the day, but improvements in child feeding practices were not observed. This indicates the possibility that gains realized by WEG may have been too small to be meaningful in terms of improving household diet and women’s time allocation, or that education on child feeding practices should accompany WEG activities if improving child nutrition is an objective.
With respect to agricultural interventions, children in the FFS group had improved dietary diversity and meal frequency compared with the control group. The FFS intervention was more intensive than F2F, with beneficiaries receiving tools, seeds and regular training on agricultural techniques, whereas F2F relied on FFS participants to disseminate information and therefore may have had less effect. The potential pathways linking FFS with improvements in child diet include increased household income, access to more diverse foods and caregivers spending less time in food production. Overall, there are a multitude of types of agricultural intervention and the differences in the intervention approaches make it difficult to compare to the FFS and F2F results reported here. FFS interventions have mainly been evaluated with respect to the adoption of improved farming practices, household incomes and agricultural production( Reference Waddington, Snilstveit and Hombrados 28 ). Agricultural interventions that address multiple types of human capital, for example nutrition education and gender issues, along with the agricultural intervention have been found to be most effective in improving nutrition measures; however, interventions were not always sufficient to effect change and negative or mixed results were not uncommon( Reference Webb and Kennedy 29 , Reference Berti, Krasevec and Fau-FitzGerald 30 ). A review of agricultural and animal husbandry interventions suggests that very little evidence is available on dietary changes in poor households and that no evidence exists for improvement in child anthropometric measures; however, the authors also noted the current state of evidence was too limited to adequately assess if agricultural interventions are effective in improving child nutrition( Reference Doocy, Teferra and Norell 17 ). Findings from the present study, where children in the FFS group had similar stunting prevalence and underweight prevalence, indicate the potential for FFS to impact child nutrition, and along with the review by Massett et al. suggest the need for additional research.
The PM2A was developed after a study in Haiti showed that a preventive approach was superior to a therapeutic approach with respect to child anthropometric outcomes( Reference Ruel, Menon and Habicht 6 ). PM2A has not been rigorously evaluated in a multitude of settings; however, it has been shown to positively impact child dietary diversity in Burundi( Reference Leroy, Olney and Ruel 7 ). Food supplementation of infants in African settings has been shown to improve growth in several cases( Reference Kuusipalo, Maleta and Briend 31 , Reference Obatolu 32 ); yet, positive findings are not consistently reported and are from a range of products which may not be comparable to the ration provided as part of the Jenga Jamaa II PM2A intervention. A study conducted in South Kivu found that supplementation with ready-to-use-complementary foods was not effective in reducing prevalence of stunting or underweight, suggesting that supplementation alone may be insufficient in the context of Eastern DRC( Reference Bisimwa, Owino and Bahwere 33 ). Care groups, a core element of PM2A programme delivery, have been shown to reduce the prevalence of child underweight and to improve child health outcomes more broadly( Reference Davis, Wetzel and Hernandez Avilan 34 , Reference Perry, Morrow and Davis 35 ). While findings reported from care group interventions are increasingly positive, the evidence is largely centred on the efficacy of specific interventions rather than a package of interventions delivered in a field setting( Reference Bhutta, Das and Rizvi 36 ). The effects of the Jenga Jamaa II PM2A intervention, where children’s dietary diversity and minimum acceptable diet were significantly improved and there were modest (but not statistically significant gains) in anthropometric measures, demonstrate that such an intervention package can be effective in a food-insecure post-conflict context. While statistically significant findings were observed for child diet measures, gains were modest from a programmatic perspective and suggest that either intervention selection or delivery needs to be modified if more widespread population-level gains are to be achieved. The challenges in producing gains in diet and nutrition outcomes are likely due to barriers to optimal feeding practices including poverty, high prevalence of food insecurity and high work burden, which remained in many households despite the different Jenga Jamaa II programme interventions. In addition, poor access to safe drinking-water and to improved sanitation and health services is prevalent in South Kivu, both of which are known contributors to poor child nutritional status.
Limitations
Several methodological issues must be considered when assessing study findings. Children’s diet indicators are designed to evaluate the diets of children 6–23 months of age; the same indicators were used throughout the study period so that change over time could be assessed; the target of ≥4 meals per day was maintained for children 25–59 months of age. Target meal frequency increases for non-breast-fed children (minimum 4 times, compared with 2–3 times for breast-fed children) so it became more difficult for children to achieve this target as they grew older; another concern is that mothers’ reports of dietary diversity and meal frequency may have been less accurate for older children who are often left in the care of others. With respect to anthropometry, it was difficult to obtain reliable birth dates. After the fifth survey discrepancies were resolved by utilizing the mid-point if dates varied by a few months; or if dates varied by years, by using the child’s HAZ to determine the likely year of birth. Lack of precision in estimating birth dates may have affected results of the analyses for WAZ, HAZ, stunting and underweight. As children grew older, fewer were present during the surveys, often due to illness or being sent away to live with relatives. With the multiple imputation approach, we assumed that children missing anthropometric (n 664) and dietary (n 605) outcomes at endline were otherwise similar to children whose outcomes were observed at the last time point. Finally, the study was not sufficiently powered to detect changes in child nutrition outcomes, which were secondary outcome measures, limiting the strength of conclusions.
Conclusions
PM2A and FFS interventions resulted in statistically significant gains in child dietary diversity and some reduction in stunting and underweight that were programmatically but not statistically significant. A minority of children achieved target dietary diversity following the interventions; this proportion was highest among PM2A which was the only intervention that included a behaviour change component around children’s diet and feeding practices. These findings align with the conclusions of recent reviews which suggest that integration of social behaviour change communication and education may be an important factor in achieving change in nutrition outcomes in the context of development programmes that aim to increase agricultural production and household income( Reference Brunson, Shell-Duncan and Steele 28 ). When considering the context of Eastern DRC, where chronic food insecurity and poverty are widespread, even small gains in child diet measures can be considered laudable, particularly when they are sustained following the intervention as was the case with Jenga Jamaa II. While community-based prevention programmes are recognized as an important approach to improving child health and nutrition in resource-poor settings with weak health systems and high levels of child mortality, the evidence base remains limited with respect to their effectiveness( Reference Bhutta, Das and Rizvi 36 ). With both maternal and child nutrition and household agricultural interventions, improvements in dietary diversity measures have not been shown to translate into gains in nutritional status at scale( Reference Bhutta, Das and Rizvi 36 , Reference Girard, Self and McAuliffe 37 ). Recommendations for future Food for Peace development programming in similar resource-poor contexts include ensuring a strong social behaviour change and communication element for all interventions that aim to improve infant and young child feeding practices, particularly to increase meal frequency. Expanding the focus on reducing women’s work burden and access to labour-saving technology could allow women to spend more time caring for young children. Interventions that are more intensive, engage both male and female household members, and integrate activities that improve household agricultural production and income along with knowledge transfer for health and nutrition education may be more impactful, particularly in resource-poor and highly food-insecure settings.
Several critical questions remain, and further research is needed to determine whether these results are specific to the context of Eastern DRC or are also applicable to similar settings in sub-Saharan Africa or other low‐ and middle‐income countries. With greater global focus on multisectoral nutrition interventions, understanding which interventions or intervention packages are most effective will remain an important question. Rigorous evaluation studies across a range of settings are required to gain a complete understanding of how context, interventions and programme delivery translate to gains in children’s diet and nutritional status.
Acknowledgements
Financial support: The Jenga Jamaa II programme and this research were funded through a Cooperative Agreement (number AID-FFP-A-11-00006) of the Office of Food for Peace, US Agency for International Development. The funder had no role in the design, analysis or writing of this article Conflict of interest: The authors declare no conflict of interest. Authorship: S.D. was the Primary Investigator and was engaged in study design, management and analysis, and presentation of results; J.E. was engaged in data collection and analysis and manuscript preparation; E.C. supported data analysis and critically reviewed the manuscript; J.S. and K.A.-M. were engaged in data collection and analysis; and J.M. was responsible for implementing interventions, supported data collection and critically reviewed the manuscript. Ethics of human subject participation: This study was conducted according to the guidelines laid down in the Declaration of Helsinki and all procedures involving human subjects were approved by the Johns Hopkins Bloomberg School of Public Health Institutional Review Board. Verbal informed consent was obtained from all subjects and was witnessed and formally recorded.


