


Reducing sugar-sweetened beverage (SSB) consumption represents an important aim for population-level dietary interventions, particularly those targeting adolescents. SSB comprise a variety of beverages containing added sugars, including regular (i.e. non-diet) soft drinks, fruit drinks, sports drinks, energy drinks, flavoured milk drinks and sweetened coffees/teas. Recent studies demonstrate that youth consume more SSB than any other age group in Canada( Reference Jones, Veerman and Hammond 1 ) and many youth consume SSB daily( Reference Vanderlee, Manske and Murnaghan 2 – Reference Garriguet 4 ). SSB are a major source of added sugars and energy in adolescents’ diets and often have negligible nutritional value( Reference Hu and Malik 5 ). Previous research has identified associations between SSB intake and adverse health outcomes, including an increased risk of overweight/obesity( Reference Hu and Malik 5 – Reference Malik, Popkin and Bray 7 ), lower intakes of vitamins and nutrients( Reference Frary, Johnson and Wang 8 , Reference Vartanian, Schwartz and Brownell 9 ), dental caries( Reference Gupta, Gupta and Pawar 10 ) and CVD( Reference Ambrosini, Oddy and Huang 11 , Reference Bremer, Auinger and Byrd 12 ). Given the popularity of SSB among adolescents, the negative health impacts associated with these beverages and the tendency for dietary habits to persist into adulthood, adolescents are a priority group for population-level interventions to decrease SSB intake.
There has recently been considerable attention on how environmental factors may influence dietary behaviours. Ecological models of health describe how individuals’ health behaviours are shaped by various levels of influence, ranging from broader contextual factors (e.g. sociocultural, political and physical environments) to individual-level factors (e.g. those related to biology, individual socio-economic characteristics and lifestyle choices)( Reference McLeroy, Bibeau and Steckler 13 ).
Many studies have examined the influence of the school food environment on adolescents’ dietary behaviours. The school food environment comprises, in part, the facilities in which foods and beverages are sold or otherwise available, both within the school grounds and the school neighbourhood. Canadian provincial school nutrition policies are intended to facilitate students’ healthy dietary choices, often through modifications to the school food environment, although these policies vary in their scope. For example, the Alberta Nutrition Guidelines for Children and Youth provide voluntary recommendations for schools and other youth-oriented settings( 14 ), while Ontario’s Policy/Program Memorandum no. 150 (P/PM 150) offers mandatory guidelines for publicly funded elementary, middle and secondary schools( 15 ). Effective September 2011, P/PM 150 prohibited the sale of many SSB in public secondary schools, including <100 % juice drinks, all sports drinks, all energy drinks and ‘other’ drinks (e.g. soft drinks, flavoured waters and ades), and iced teas containing >167 kJ (>40 kcal) or caffeine( 15 ). The following beverages are considered ‘sell-most (≥80 %)’: plain water, milk and milk-based beverages (plain or flavoured) that meet specific fat, sugar and Ca requirements, fortified milk alternative beverages (plain or flavoured), 100 % juices (no sugar added), and hot chocolate beverages that meet specific fat, sugar and Ca requirements. ‘Sell-less (≤20 %)’ beverages include decaffeinated coffees/teas and ‘other’ drinks with ≤167 kJ (≤40 kcal) and without caffeine.
Previous research has demonstrated that adolescents who purchase meals/snacks from food outlets at school (e.g. school vending machines and cafeterias) and off school property (e.g. fast-food and other restaurants and convenience food outlets close to schools) have a higher rate of SSB intake than those who do not make such purchases( Reference Jones, Hammond and Reid 16 , Reference Godin, Chaurasia and Hammond 17 ). Likewise, certain studies identify associations between SSB consumption and access to food retailers in the school neighbourhood( Reference Wiecha, Finkelstein and Troped 18 , Reference Davis and Carpenter 19 ) and SSB availability in school food outlets( Reference Wiecha, Finkelstein and Troped 18 , Reference Mâsse, de Niet-Fitzgerald and Watts 20 , Reference Park, Sappenfield and Huang 21 ). Further, recent studies have found significant variation in students’ SSB consumption between schools( Reference Godin, Chaurasia and Hammond 17 , Reference Lebel, Morin and Robitaille 22 – Reference Johnson, Bruemmer and Lund 24 ). This literature demonstrates the impact that schools may have on adolescents’ SSB intake, highlighting a viable opportunity to decrease adolescents’ SSB consumption through initiatives seeking to improve the quality of the school food environment.
The primary objective of the present study was to examine how several modifiable characteristics of the school food environment (i.e. in-school beverage availability and food outlets in the school neighbourhood) are associated with adolescents’ weekday rate of consuming three SSB types (soft drinks, sweetened coffees/teas, energy drinks) in a sample of adolescents from Alberta and Ontario, Canada, in order to identify possible opportunities for initiatives to discourage SSB intake. Secondary objectives included to investigate differences in aspects of the school food environment between the two provinces, as a reflection of their distinct nutrition policies. The overall hypothesis was that greater access to SSB within the school food environment would be positively associated with adolescents’ SSB intake and that SSB availability would be greater in Albertan schools, given the voluntary nature of their provincial school nutrition policy.
Methods
Design
COMPASS is a prospective cohort study designed to collect hierarchical data from a sample of Canadian secondary school (grades 9–12) students( Reference Leatherdale, Brown and Carson 25 ). The present study used data from Year 2 (Y2) of COMPASS (2013/14), since it was the first year to include Albertan schools and it boasts the largest school and participant sample sizes. The University of Waterloo Office of Research Ethics and appropriate school board review panels reviewed and provided ethics clearance for COMPASS protocols. Further details on the host study methods are available in print(25) and online (www.compass.uwaterloo.ca).
Sample
Participating school boards and schools were purposely selected due to their use of active-information passive-consent parental permission protocols (https://uwaterloo.ca/compass-system/publications/rationale-using-active-information-passive-consent). The school sample comprised eighty-nine secondary schools in Alberta (n 10) and Ontario (n 79). The relatively small number of schools in Alberta compared with Ontario reflects COMPASS’ inception in Ontario. All students enrolled in the eighty-nine Y2 COMPASS schools (n 57 229) whose parents passively consented for them to participate were eligible to participate. Ultimately, 79·2 % (n 45 298) of these students completed the questionnaire. The response rate was similar between provinces: 75·8 % in Alberta and 79·5 % in Ontario. We excluded students missing data on outcome and/or control variables from the analyses (n 3469, 7·7 %); however, we included participants missing BMI data. The final sample comprised 41 829 participants, representing 92·3 % of those who completed the questionnaire.
Data sources
Student data were collected through the COMPASS Student Questionnaire, which is a paper-based questionnaire comprising questions on basic demographic information and a variety of health, social and academic outcomes. The questions used to derive student-level measures for the present study are shown in the online supplementary material, Supplemental Table 1. Students completed the survey during class in ~40 min. All students present during the data collection were able to complete the questionnaire, enabling collection of whole-school samples.
School-level data were collected through the COMPASS School Environment Application (Co-SEA) and the Desktop Mapping Technologies Inc. (DMTI) built environment resource. The Co-SEA is a mobile application containing a series of questions adapted from two previously validated audit tools designed to efficiently measure schools’ food and physical activity environments( Reference van der Horst, Timperio and Crawford 26 , Reference Jones, Jones and van Sluijs 27 ). The Co-SEA also allows data collectors (i.e. most often COMPASS research assistants, although occasionally local public health nurses in rural/remote communities) to store photos of built environment features and include notes within the application, representing supplementary sources of direct observation data. For each school, data collectors conducted the Co-SEA audits on the same day that students within that school completed the questionnaire. The Co-SEA was tested in a convenience sample of schools and refined accordingly prior to being used in the COMPASS study. The DMTI provides data on the type, location and number of various points of interest (e.g. grocery stores, restaurants, etc.) within various circular buffers surrounding schools. Further detail on these data sources is available elsewhere( Reference Leatherdale, Bredin and Blashill 28 , 29 ).
Outcome variables
Consistent with previous research( Reference Godin, Chacon and Barnoya 30 ), we selected outcomes that reflect weekday SSB consumption (v. weekend or weekly), since Canadian youth attend school only on weekdays and our objective was to examine the impact of school characteristics on students’ SSB intake.
The questionnaire asked participants to indicate the number of days during a usual school week (0–5 days) that they consume each of the following: (i) ‘sugar-sweetened beverages (soda pop, Kool-Aid, Gatorade, etc.)’; (ii) ‘high-energy drinks (Red Bull, Monster, Rock Star, etc.)’; and (iii) ‘coffee or tea with sugar (cappuccino, frappuccino, iced-tea, iced-coffees, etc.)’. We refer to the ‘sugar-sweetened beverages’ category as ‘soft drinks’ herein.
We used participants’ responses to these questions to derive the study’s four measures of SSB intake: number of weekdays participants reported consuming each of (i) soft drinks, (ii) sweetened coffee/teas and (iii) energy drinks, and (iv) a composite weekday SSB score. The first three outcome variables reflect distinct beverage categories and range in possible values from 0 to 5 days. For the fourth outcome variable, we assessed participants’ intake of all three SSB categories captured on the questionnaire through a composite score. We calculated this score by summing participants’ weekday consumption (in days) of each category. Possible values for this score ranged from 0 (indicating no consumption of any beverage category on any day) to 15 (indicating use of all three SSB categories every weekday).
Control variables
We included both student- and school-level control variables in our analyses. Student-level control variables included gender, grade, ethnicity, weight status (i.e. BMI (kg/m2) category based on reported height and weight, and WHO classifications, adjusted for age and sex( 31 )), personal weekly spending money, truancy and weight goal.
School-level control variables included school type (public v. private), geographic location and school neighbourhood median annual household income. Categories of geographic location included ‘rural or small population centre’, ‘medium urban population centre’ and ‘large urban population centre’, classified according to Statistics Canada’s definitions( 32 ). School neighbourhood median annual household income was derived from the 2011 National Household Survey (i.e. representing the most recent data available at the time of COMPASS Y2, as the survey is conducted every 5 years)( 33 ) and corresponded to schools’ postal code.
Variables describing school beverage availability and school neighbourhood food outlets
Using the Co-SEA data, we examined the in-school accessibility of water fountains (including coolers and bottle-filling stations) and the availability of each of soft drinks, sweetened coffees/teas and energy drinks (i.e. reflecting the outcome measures) in vending machines. Further, we used the Co-SEA data to assess what specific beverage types (e.g. sugar-containing carbonated soft drinks, 100 % juices, water, plain milk, etc.) were available within schools’ vending machines.
We assessed the accessibility of water fountains via data collectors’ assessments of the presence of fountains (‘yes’, ‘no’), if there was an adequate number of fountains (‘yes’, ‘no’), if the fountains were easy to locate (‘yes’, ‘no’) and the proportion of fountains that appeared to work (‘none’, ‘some’, ‘all’). We defined schools as having ‘high accessibility of water fountains’ if: (i) fountains were present; (ii) there was an adequate number of fountains; (iii) they were easy to locate; and (iv) all of the fountains worked. Otherwise, we classified the school as having ‘low accessibility of water fountains’.
To assess the availability of each of soft drinks, sweetened coffees/teas and energy drinks in schools’ vending machines, two research associates independently screened photos of vending machines, applying the criteria shown in the online supplemental material, Supplemental Table 2. We considered availability as binary (‘available’, ‘unavailable’). For example, if a school had one or more soft drink available in one or more of its vending machines, we classified it as having soft drinks available. The reviewers then compared their independent assessments of beverage availability and collectively re-evaluated the assessments they disagreed on, until they reached consensus.
Although many previous studies have limited their investigation of school food outlets to vending machines( Reference Wiecha, Finkelstein and Troped 18 , Reference Park, Sappenfield and Huang 21 , Reference Vine, Harrington and Butler 34 , Reference Park, Blanck and Sherry 35 ), we had intended to include measures relating to SSB availability in other school food outlets, including cafeterias and tuck shops (i.e. small school stores that primarily sell to-go snacks/beverages). However, these data were not consistently available, as these outlets operate for a limited period each day which did not always coincide with the timing of data collections. Further, school cafeterias are often operated by external private companies in Canada. As such, COMPASS researchers were frequently denied permission to enter and/or photograph these food outlets. Given this limitation of having objective cafeteria/tuck shop data across all schools, we noted the food outlets present within each school but did not report on SSB availability in those contexts. As such, the measures of in-school SSB availability derive solely from the objective data available on SSB availability in participating COMPASS schools’ beverage vending machines.
Finally, we used the DMTI built environment data to examine the presence of three types of food outlets within a 1 km circular buffer of schools: (i) restaurants; (ii) variety stores; and (iii) food stores. ‘Restaurants’ included establishments in which prepared foods/beverages were sold for on-premise or immediate consumption, such as sit-down and fast-food restaurants. ‘Variety stores’ included establishments in which a wide assortment of low-cost food and non-food items were sold. ‘Food stores’ included supermarkets and specialized grocery stores. The 1 km buffer represents a distance that individuals can walk in 10–15 min (e.g. during travel to/from school or during lunch/other school breaks)( Reference Pikora, Bull and Jamrozik 36 – Reference Austin, Melly and Sanchez 38 ). We considered the presence of each food outlet as binary; schools had either ‘zero’ or ‘one or more’ of each food outlet within their buffer.
Analyses
We used descriptive statistics to characterize the student and school samples. We conducted χ 2 analyses, two-sided Wilcoxon rank-sum procedures and Fisher’s exact test to examine provincial differences across categorical variables (i.e. student-level characteristics), non-normally distributed continuous variables (i.e. outcome variables, which reflect rates) and categorical variables with small cell counts (i.e. school-level characteristics), respectively.
Using Generalized Estimating Equations, we developed hierarchical Poisson regression models to identify how student- and school-level variables are associated with the four SSB consumption outcomes, while controlling for the clustered nature of the study (i.e. students are nested within schools). We chose to develop Poisson models (v. other types of regression models) since the outcome variables are counts and for consistency with previous research( Reference Godin, Chaurasia and Hammond 17 , Reference Godin, Chacon and Barnoya 30 ). We also assessed risk of multicollinearity between the potential explanatory variables prior to modelling via variance inflation factors for each outcome variable. While there are no formal criteria for deciding if a variance inflation factor is large enough to affect predicted values, it is generally accepted that variance inflation factor values exceeding 4 warrant further investigation, while values exceeding 10 are signs of serious collinearity.
We took a three-step approach to modelling, consistent with previous research examining the impact of the school context on youth health outcomes( Reference Hobin, Leatherdale and Manske 39 , Reference Haug, Torsheim and Samdal 40 ). In Step 1, PROC GLIMMIX was used to generate unconditional means models without any variables and with a random intercept term (i.e. null models), to examine the significance of the between-school variance for each outcome. Significant school-level variation would suggest that aspects of the school environment have an important bearing on students’ SSB intake, warranting further exploration of school-level variables. For each outcome, we used the school-level variance term to calculate the intraclass correlation, which represents the proportion of the total variance in the SSB-related outcome that is due to differences across schools.
In Step 2, we performed a series of univariate regression analyses to examine the independent association between each explanatory variable and each outcome variable. These models contained only the variable being tested, and thus did not include student- or school-level control variables. Explanatory variables that were not significantly associated (P≥0·2) with an outcome variable were not considered in subsequent joint models for that outcome.
Third, we used a sequential block-wise modelling approach to develop joint models for each SSB outcome variable. We added variables to the models one block at a time, progressing from those most proximal to adolescents (i.e. student-level variables) to those most distal (e.g. school area-level variables), reflecting layers of influence within ecological models of health. Once a block of variables was added to a model, we removed any variables that were not significant (P<0·2) within the block one at a time, beginning with the least significant variable. If none of the variables in a block were significant at this level, we removed the entire block from the model before proceeding to the next block and restarting this process. As such, only variables that were significant at P<0·2 were retained in the final models. We included student- and school-level control variables in every model in which they appear, regardless of their statistical significance. We postulated that provincial school nutrition policies influence students’ SSB intake by moderating in-school SSB availability (i.e. in-school SSB availability is a reflection of province). As such, we assessed the association between school beverage availability variables and students’ SSB consumption without including province as a covariate due to concern of confounding. We performed all analyses using the statistical software package SAS version 9.4.
Results
Table 1 describes the characteristics of the student sample. Within the total sample, there was roughly an equal representation of males and females and across the four grades. Most participants were white (75·0 %) and had a healthy weight (57·5 %). The predominant weight goal was to lose weight, reported by 41·2 % of participants. Participants reported drinking soft drinks an average of 1·75 days in a typical school week, making soft drinks the SSB category consumed most frequently, followed by sweetened coffees/teas (mean 1·41 days). Frequency of SSB consumption was significantly greater across all SSB-related outcomes among participants from Alberta, relative to their Ontario counterparts.
Table 1 Sociodemographic and behavioural characteristics of the sample of secondary-school students from Alberta (n 3330) and Ontario (n 38 499) participating in Year 2 of the COMPASS study, Canada, 2013/14
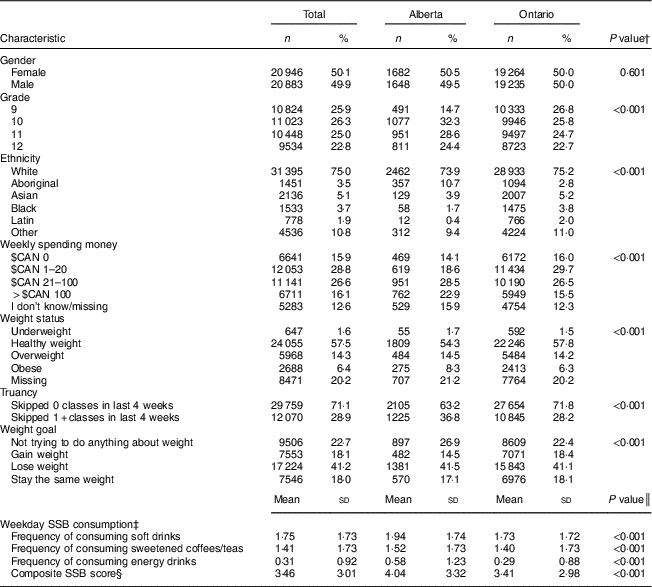
SSB, sugar-sweetened beverage.
† The χ 2 test was used to examine differences by province.
‡ Number of days in a typical school week (Monday to Friday, 0–5 days).
§ A composite score, ranging from 0 to 15, representing the sum of participants’ weekday rates of consuming the three distinct SSB categories.
║ Two-sided Wilcoxon rank-sum procedure used to examine differences by province.
The school sample was quite diverse, reflecting varied geographic and socio-economic neighbourhoods (Table 2). Nearly all schools (n 85, 95·5 %) had at least one beverage vending machine. Nearly half (n 44, 49·4 %) of schools had non-diet soft drinks available in at least one vending machine, while no schools carried energy drinks. A significantly higher proportion of Albertan schools had sugar-sweetened soft drinks and coffees/teas available. Overall, most schools were within a 1 km circular buffer of restaurants (85·4 %) and food stores (78·6 %). The online supplementary material, Supplemental Table 3, provides a detailed breakdown of schools’ beverage vending machine contents. These results demonstrate that most schools (n 75, 84·3 %) had 100 % fruit juices available in their vending machine(s), making it the most common beverage available, followed by water (n 65, 73·0 %) and diet carbonated soft drinks (n 61, 68·5 %). Few schools sold sugar-containing sports drinks (n 11, 12·4 %), sugar-containing carbonated soft drinks (n 15, 16·9 %) and diet sports drinks (n 21, 23·6 %) through their beverage vending machine(s). The availability of sugar-containing soft drinks (carbonated and non-carbonated) and sports drinks in vending machines was significantly greater in Alberta v. Ontario.
Table 2 Characteristics of the sample of schools from Alberta (n 10) and Ontario (n 79) participating in Year 2 of the COMPASS study, Canada, 2013/14
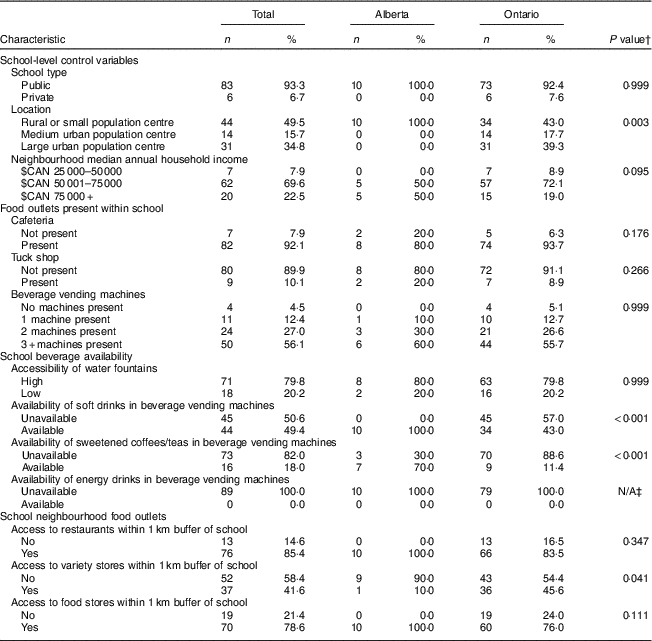
N/A, not applicable.
† Fisher’s exact test was used to examine differences by province.
‡ Statistic could not be computed due to lack of variability within the measure.
The pre-modelling collinearity diagnostics revealed minimal risk of collinearity, as none of the variance inflation factors exceeded 3. With Step 1 of the modelling process, the null models demonstrated significant between-school variation across all four SSB-related outcome variables (see online supplementary material, Supplemental Table 4). We identified significant (P<0·001) between-school variation for all four SSB-related outcomes. School-level differences accounted for 1·8, 0·8, 2·0 and 1·6 % of the variability in students’ number of weekdays consuming soft drinks, sweetened coffees/teas, energy drinks and their weekday composite score, respectively, when controlling for student-level variance.
Table 3 depicts the findings of the univariate Poisson regression analyses between each outcome variable and each potential explanatory variable (Step 2). Note that for these and all other Poisson regression models, the rates represent the exponentiated beta coefficients. Few school-level explanatory variables were significantly associated with the outcome variables. For example, no school-level explanatory variables demonstrated a significant independent association with students’ weekday rate of soft drink consumption. As such, no school-level variables were included in the joint model for weekday soft drink consumption.
Table 3 Univariate analyses for modifiable school-level factors in relation to weekday consumption of sugar-sweetened beverages (SSB) among secondary-school students (n 41 829) from Alberta and Ontario participating in Year 2 of the COMPASS study, Canada, 2013/14
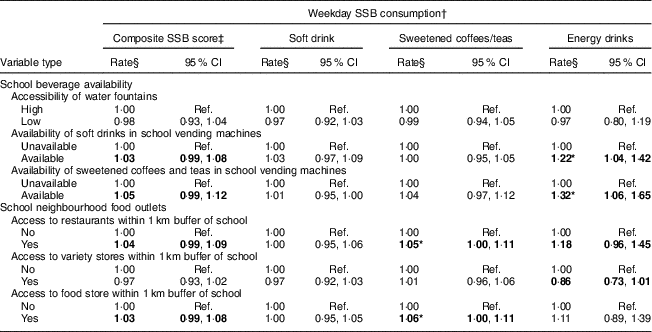
Ref., reference category.
*P < 0·05.
† Number of weekdays participants reported consuming SSB in a typical school week (Monday to Friday, 0–5 days).
‡ A composite score, ranging from 0 to 15, representing the sum of participants’ weekday rates of consuming the three distinct SSB categories.
§ Rates represent the exponentiated beta coefficients; bold values are statistically significant (P<0·20).
Table 4 provides an example of the block-wise joint model development (Step 3), as applied to the composite SSB score outcome. The four final models are shown in Table 5. Only two school-level explanatory variable remained in any of the joint models: availability of sweetened coffees/teas in school vending machines and access to restaurants within the school’s 1 km buffer were associated with increased SSB intake in three of the final models. Although all included variables were significantly (P<0·20) and positively associated with the SSB-related outcomes in the final models, the effect sizes of these associations were quite modest. For example, the rate of 1·08 denotes that students consume sweetened coffees/teas at an 8 % greater rate (i.e. in terms of number of weekdays) when sweetened coffees/teas are available in their school vending machine, controlling for all other variables.
Table 4 Student- and school-level correlates of weekday composite sugar-sweetened beverage scoreFootnote † among secondary-school students (n 41 829) from Alberta and Ontario participating in Year 2 of the COMPASS study, Canada, 2013/14: an illustration of the block-wise modelling processFootnote ‡

Ref., reference category; –, variable excluded to create a more parsimonious model, since it lacked significance at P<0·2 level.
*P<0·05, **P<0·01, ***P<0·001.
† A composite score, ranging from 0 to 15, representing the sum of participants’ weekday rates of consuming soft drinks, sweetened coffees/teas and energy drinks.
‡ Table omits variables that were not significantly associated with outcome in prior univariate analyses and therefore not included in the joint model; columns reflect the model after a given block of variables had been added (i.e. before those lacking significance at P<0·2 were removed).
§ Rates represents the exponentiated beta coefficients; rates adjusted for all other variables in the column.
Table 5 Final models describing correlates of weekday consumption of three varieties of sugar-sweetened beverages (SSB) among secondary-school students (n 41 829) from Alberta and Ontario participating in Year 2 of the COMPASS study, Canada, 2013/14
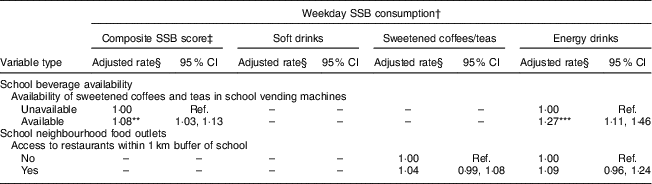
Ref., reference category; –, variable was excluded from model during univariate analyses screening or the block-wise model-building process.
**P<0·01, ***P<0·001.
† Number of weekdays participants reported consuming SSB in a typical school week (Monday to Friday, 0–5 days).
‡ A composite score, ranging from 0 to 15, representing the sum of participants’ weekday rates of consuming the three distinct SSB categories.
§ Rates represent the exponentiated beta coefficients; rates adjusted for all other variables in the column, in addition to school- and student-level control variables.
Discussion
The present study examined several modifiable characteristics of the school food environment and their association with weekday SSB intake in a large cohort of Canadian youth. The study objectives parallel those of a recent COMPASS pilot study in Guatemala( Reference Godin, Chacon and Barnoya 30 ). In the present study, we identified that many schools offer SSB in their vending machines, consistent with previous Canadian research( Reference Mâsse, de Niet-Fitzgerald and Watts 20 , Reference Seliske, Pickett and Rosu 41 , Reference Rideout, Levy-Milne and Martin 42 ). This finding was particularly evident in Alberta. In addition, most schools had at least one restaurant and food store within their kilometre buffer, where students could purchase SSB, mirroring the findings of other Canadian studies( Reference Seliske, Pickett and Boyce 43 – Reference Vine and Elliott 45 ). Although these characteristics reflect means of accessing less healthful beverages during school, our results largely suggest that they were not significantly associated with students’ SSB intake, after controlling for student-level characteristics.
Interventions directed at the school environment
Compared with their Albertan counterparts, Ontarian schools demonstrated significantly lower availability of most SSB categories we examined in their school vending machines, particularly sugary soft drinks and sports drinks. This finding suggests that the mandatory P/PM 150 may be more effective at restricting SSB availability in school vending machines compared with the voluntary policy in Alberta; however, the cross-sectional nature of the current study precludes the ability to infer a causal association between school nutrition policy and the nutritional quality of beverages available for sale in school. Despite the lower availability of SSB in Ontarian school vending machines, a considerable proportion of Ontarian schools offered non-policy-compliant beverages in their vending machines. Further review of the vending machine photos revealed that some, but not all, of the flavoured milks available in vending machines in Ontario were policy-compliant. For example, chocolate and strawberry milks (the flavoured drinks most often available) were permissible, although most ready-to-drink milkshake beverages (available in comparatively fewer schools) exceeded the sugar and fat criteria, and thus deemed ‘not permitted for sale’. Our finding that SSB were available within school vending machines in both provinces, despite nutrition policies that recommend restricting in-school SSB availability, likely reflects the previously identified shortcomings of these policies, including a lack of clarity, consistency, enforcement, and government resources to support policy implementation and adherence( Reference Jones, Hammond and Reid 34 , Reference Vine and Elliott 45 ). These limitations highlight the need for guidelines that are ‘user-friendly’ as well as greater enforcement and support to increase compliance and thus the likelihood that these policies can improve students’ dietary outcomes.
We found limited evidence of a direct association between several modifiable aspects of the school food environment on students’ SSB consumption. These findings counter that of a recent review that concluded legislative/environmental school-based interventions are effective at reducing students’ SSB consumption( Reference Vézina-Im, Beaulieu and Bélanger-Gravel 46 ). Further, the findings are quite disparate from those of the related COMPASS Guatemala study, which suggested that the high rate of SSB consumption among adolescents was encouraged, in part, by the strong presence of the SSB industry within schools( Reference Godin, Chacon and Barnoya 30 ). However, the results of the present study are consistent with previous observational research in Canada and elsewhere( Reference Lebel, Morin and Robitaille 22 , Reference Lien, van Stralen and Androutsos 23 , Reference van der Horst, Timperio and Crawford 26 , Reference Park, Blanck and Sherry 35 , Reference Williams, Scarborough and Matthews 47 , Reference Minaker, Storey and Raine 48 ). For example, a nationally representative American study revealed that, despite the ubiquity of SSB-containing school vending machines, the presence of these machines was not significantly associated with students’ SSB intake( Reference Park, Blanck and Sherry 35 ). Likewise, a recent systematic review found little evidence linking the retail food environment around schools and students’ food consumption patterns, including SSB intake( Reference Williams, Scarborough and Matthews 47 ). These studies elucidate why interventions designed solely to decrease students’ SSB access during school (i.e. in food outlets on and off school property) may be limited in their ability to reduce youths’ SSB consumption, particularly for adolescents (v. children) who have greater independence and autonomy in their dietary choices. Further, previous research demonstrates that when students are restricted in the foods/beverages they can access during school, they may compensate by purchasing and/or consuming more of these items in other settings( Reference Vézina-Im, Beaulieu and Bélanger-Gravel 46 , Reference Finkelstein, French and Variyam 49 , Reference Vecchiarelli, Takayanagi and Neumann 50 ).
This current body of literature, coupled with the present study’s findings, highlight the value in comprehensive school-based nutrition interventions (i.e. comprising nutrition education, parental engagement, strong school nutrition policies, built environment changes, etc.) to communicate a consistent health-reinforcing message through various means to support behaviour change( Reference Vézina-Im, Beaulieu and Bélanger-Gravel 46 , Reference Vecchiarelli, Takayanagi and Neumann 50 , Reference McKenna 51 ). Comprehensive interventions that aim to modify youths’ diet-related values, knowledge and preferences (i.e. rather than simply food/beverage access) are critical, since SSB intake is driven primarily by sociocultural and intrapersonal-level (v. school-level) factors( Reference Lebel, Morin and Robitaille 22 , Reference van der Horst, Timperio and Crawford 26 ). This phenomenon is also reflected in our finding that school-level differences account for a very limited (≤2 %) proportion of the variability in students’ rate of SSB intake. Further, our findings (e.g. the general lack of association between SSB intake and school food environment characteristics) demonstrate evidence to suggest that factors within the home and broader societal environments are likely more important correlates of adolescents’ SSB intake.
Interventions directed at broader environments
Although the school environment is undoubtedly an important physical and social context for youth, it is likely that SSB-oriented interventions within schools are undermined by larger contexts that promote SSB consumption. Previous research demonstrates that adolescents primarily consume SSB at home( Reference Briefel, Wilson and Gleason 52 ), highlighting the important influence this setting may exert on adolescents’ dietary choices. Parents/guardians often are responsible for purchasing and preparing foods, giving them considerable control over what foods/beverages are available at home. As such, nutrition professionals should encourage parents to model healthful eating behaviours and moderate youths’ SSB access (e.g. by packing school lunches with healthy drinks, serving these drinks at home, etc.)( Reference Briefel, Wilson and Gleason 52 – Reference Ezendam, Evans and Stigler 54 ). Given the importance of the home environment in shaping youths’ health behaviours( Reference Lindsay, Sussner and Kim 55 ), interventions focused on this context may be well poised to effectively moderate adolescents’ SSB consumption.
The ubiquity of SSB in adolescents’ everyday lives likely explains, in part, the lack of association we detected between SSB consumption and the school food environment( Reference Minaker, Storey and Raine 48 ). For example, SSB are among the most common products promoted to youth( Reference Cairns, Angus and Hastings 56 ), often via very youth-oriented, interactive advertising strategies (e.g. social media, ‘advergaming’, etc.)( Reference Cairns, Angus and Hastings 56 , Reference Weber, Story and Harnack 57 ). These marketing efforts have a profound influence on youths’ food preferences, purchasing behaviour and consumption patterns( Reference Cairns, Angus and Hastings 56 ), fuelling recommendations for the federal government to ban the advertising of foods and beverages to children as a means to improve Canadians’ diets( Reference Ogilvie 58 ). The ubiquity of SSB is also reflected in the increasing prevalence of ‘food swamps’ (i.e. neighbourhoods that have high geographic access to food retailers that primarily offer minimally nutritious foods) in Canada( Reference Minaker, Shuh and Olstad 59 , Reference Luan, Law and Quick 60 ). Indeed, our models suggested that access to restaurants near schools was associated (although not statistically significant at P<0·05) with a higher rate of consuming sweetened coffees/teas and energy drinks. Population-level efforts to increase the accessibility of healthy food outlets (e.g. grocery stores, which tend to offer the greatest variety of high-quality products at a good value) in school and residential neighbourhoods are a viable and potentially promising strategy to improve dietary choices among Canadians of all ages( Reference Minaker, Shuh and Olstad 59 , Reference Larson, Story and Nelson 61 ). These studies highlight the importance of non-school contexts in which adolescents are exposed to and can access SSB, and of developing interventions that are appropriate within these contexts.
Strengths and limitations
The present study has many strengths, including a large sample size drawn from two provinces and eighty-nine socio-economically and geographically diverse schools. The survey captured multiple days of dietary behaviours, which is a better representation of participants’ typical diets compared with methods that inquire about consumption within shorter time frames (e.g. 24 h recall)( Reference Vanderlee, Manske and Murnaghan 2 ). The study examined adolescents’ consumption of several varieties of SSB, reflecting the diversity of products available on the market. It also extended two recent COMPASS studies set in Canada and Guatemala( Reference Godin, Chaurasia and Hammond 17 , Reference Godin, Chacon and Barnoya 30 ). The distinctions in the findings of the present study and those of the Guatemala study highlight the role of context (i.e. given considerable differences in political and socio-economic environments between these jurisdictions), as well as an opportunity for future research in other regions to apply similar methods to further elucidate the potential role of schools in shaping students’ SSB intake and other dietary behaviours.
There are some important limitations to the current study, many of which reflect the fact that COMPASS was not specifically designed to provide a detailed assessment of the beverages available within schools or students’ SSB intake patterns. Our findings represent a conservative measure of in-school SSB availability, since we had limited data from cafeterias or tuck shops. The school food environment data to date have focused predominantly on vending machines, as compared with cafeterias or tuck shops (likely due, in part, to the challenges our team encountered in collecting quality data from other school food outlets), representing a research gap. Measures of participants’ SSB consumption are also limited due to the unit of measure used (i.e. number of days participants consumed SSB categories, as compared with volume or number of servings) and are limited to the SSB categories captured within the survey. We lacked data on students’ ability to leave school campus during school breaks (i.e. if the school had a ‘closed campus’ policy), which would have had a bearing on students’ ability to purchase meals and snacks from food outlets in the school neighbourhood. The study used self-reported data, which may introduce social desirability and recall bias, resulting in participants under-reporting their SSB consumption. Likewise, there was no formal criteria for data collectors to use to determine if a school had an adequate number of fountains and if they were easy to locate. As such, assessments of water fountain accessibility should be interpreted with caution. The present study is also limited by the relatively small number of schools in Alberta. Since COMPASS uses a convenience sample of schools and is therefore not provincially or nationally representative, it is unclear how well these schools represent others in the province, limiting our ability to assert that provincial differences in student and/or school characteristics reflect the provinces’ distinct policy contexts. Further, since the study was cross-sectional, we cannot infer that the associations observed are causal. Future longitudinal studies examining the relationships between school food environment characteristics and adolescents’ SSB consumption would be instrumental in confirming these findings.
Conclusions
Many COMPASS secondary schools in Alberta and Ontario offer SSB within their vending machines and are within walking distance of various food outlets. SSB availability in vending machines and overall SSB intake were higher in Alberta than Ontario, suggesting that mandatory nutrition policies restricting SSB may be more effective than voluntary measures. We did not find an association between students’ SSB consumption and most of the school food environment characteristics we examined; however, the significant association we identified between availability of sweetened coffees/teas in school vending machines and two measures of SSB consumption suggests that further investigation of these factors is warranted. Population-level interventions focusing on other contexts important to youth (e.g. the home and community environments) are needed to complement school-based interventions, as they may be more appropriate settings for efforts to reduce adolescents’ SSB consumption.
Acknowledgements
Acknowledgements: The authors wish to acknowledge Mr Chad Bredin and Ms Kate Battista for their ongoing project/data management support for the COMPASS study. Financial support: The COMPASS study is supported by a bridge grant from the Canadian Institutes of Health Research (CIHR) Institute of Nutrition, Metabolism and Diabetes through the ‘Obesity – Interventions to Prevent or Treat’ priority funding awards (S.T.L., grant number OOP-110788) and an operating grant from the CIHR Institute of Population and Public Health (IPPH) (S.T.L., grant number MOP-114875). S.T.L. and D.H. are Chairs in Applied Public Health, funded by the Public Health Agency of Canada in partnership with CIHR Institute of Neurosciences, Mental Health and Addiction and IPPH. The funders had no role in the design, analysis or writing of this article. Conflict of interest: D.H. has served as a paid Expert Witness on behalf of public health authorities in litigation brought by the beverage industry against SSB regulations. The authors have no other conflicts of interest to disclose. Authorship: K.M.G. formulated the research questions. S.T.L. designed the host study. K.M.G. analysed the data with the support of A.C. and wrote the manuscript. A.C., D.H. and S.T.L. revised the manuscript critically for important intellectual content. All authors approved the final version of the manuscript. Ethics of human subject participation: This study was conducted according to the guidelines laid down in the Declaration of Helsinki and all procedures involving human participants were approved by the University of Waterloo Office of Research Ethics and appropriate school board review panels. Passive informed consent was obtained from all participants.
Supplementary material
To view supplementary material for this article, please visit https://doi.org/10.1017/S1368980018001246


