A generation can be defined as an identifiable group of individuals who have about the same age and share the same historical, political and social experiences at critical developmental stages( Reference Smola and Sutton 1 , Reference Parry and Urwin 2 ). There are different definitions of generational groups to classify individuals according to their birth year, age, location and significant life events at critical developmental stages. The most used definition classifies individuals into four generations: (i) Traditionalists or Veterans, born between 1925 and 1942; (ii) Baby Boomers, born between 1943 and 1960; (iii) Generation X, born between 1961 and 1981; and (iv) Generation Y, born from 1982 until today( Reference Parry and Urwin 2 ). Although this classification is based mainly on a standard approach from Western economies such as the USA, the UK and Australia, historical events occurred in Brazil that concur with these same periods proposed in the literature.
Brazil too was affected by the Great Depression during the 1930s, with a decrease in the exportation of coffee. On the other hand, the depression contributed to begin investments in the industrial sector, enhancing Brazilian industry and expanding consumption and production in the country. After this period, Brazil experienced extreme situations: from economic prosperity and political stability, as in the government of Juscelino Kubitschek, who built Brasília (capital of the country), to economic and politically unstable periods that culminated with a Military Coup in 1964, which lasted about 20 years. The initial dictatorship period was marked by an economic growth, called the ‘Brazilian miracle’, characterized by modernization of industry and great construction works. However, improvements in life quality benefited disproportionately the most privileged sectors of the population, leading to several social unsustainable damages to the country( Reference Paim, Travassos and Almeida 3 ).
The consideration of generation to classify individuals is suggested owing to the theory that each generation shares a different set of values and behaviours, because of shared events and experiences, driving their attitudes and lifestyles( Reference Smola and Sutton 1 ). Although individuals from the same generation can have different experiences, the historical and social contexts in which these individuals are inserted since their birth is similar and might influence their lifestyle behaviours throughout life. An example is the abandonment of traditional eating habits by younger generations( Reference Becerra and Herring 4 ).
A recent paper evaluated trends from 1977 to 2010 in total energy intake among US adults aged 55 years or older. It found that earlier generations experienced a decline in energy intake with increasing age, while more recent generations maintained a relatively constant level of energy intake from age 55 years onwards( Reference Johnston, Poti and Popkin 5 ).
One concern regarding the changes in dietary habits is the increased prevalence of chronic diseases in younger generations. A prospective study conducted with 922 pairs of mothers and daughters in Australia found that the girls were five times more likely (OR=5·05; 95 % CI 3·03, 8·85) to become obese compared with the maternal generation( Reference Alati, Betts and Williams 6 ). A study of two national health surveys in Australia evaluated adults between the ages of 25 and 44 years who were born in 1946–65 (Baby Boomers) and 1966–80 (Generation X), and showed that the younger generation developed chronic conditions such as overweight/obesity (OR=2·09; 95 % CI 1·77, 2·46) and type 2 diabetes (OR=1·79; 95 % CI 1·47, 2·18) earlier compared with the later generation( Reference Pilkington, Taylor and Hugo 7 ).
Different approaches have been used to describe food intake and its relationship with health outcomes. The identification of dietary patterns better reflects the eating habits of a studied population, since foods are not consumed in isolation, providing reliable empirical support to public health messages of dietary recommendations. An innovative method that has been used to identify dietary patterns is latent class analysis (LCA), which is a person-centred analytic approach. LCA allows to arrive at an array of unobserved (latent) classes of people that represents the homogeneous groups of individuals within the class to which they belong, and to provide a sense of the prevalence of each latent class and the amount of measurement error associated with each variable in measuring these latent classes.
Using LCA, the objective of the present paper is to identify generational differences in the dietary patterns among Brazilian adults born between 1934 and 1975.
Methods
Study design and participants
The present study is a cross-sectional analysis, which used the baseline participants of the multicentre Brazilian Longitudinal Study of Adult Health (ELSA-Brasil) cohort. This cohort is a multicentre prospective study with volunteer participants, employees of five universities and one research institution, which aims to investigate the incidence and progression of CVD and diabetes. Details of the methodology can be found in other publications( Reference Aquino, Araujo, Almeida and da 8 – Reference Schmidt, Duncan and Mill 10 ).
In summary, all active employees or retirees of the six participating institutions aged 35–74 years were eligible for the study. The exclusion criteria included current or recent pregnancy (<4 months before the first interview), intent to stop working in the institution in the near future, severe impairment of cognition or communication, and if retired, living outside the metropolitan area of a study centre.
The sample size was estimated from two main outcomes of the study: type 2 diabetes mellitus and myocardial infarction, considering an α value of 5 %, statistical power of 80 %, prevalence of exposure of 20 %, a relative risk of 2·0 and possible losses to follow-up. For the present analysis, all individuals between 35 and 74 years old were included (n 15 105). Individuals with incomplete data on food intake were excluded (n 36), yielding a final sample of 15 069 individuals. Individuals with missing data on other variables (n 1 for each of marital status, number of children at home and smoking; n 54 for household income; n 363 for maternal education; n 4 for alcohol consumption; n 213 for physical activity; n 2213 for birth weight; n 272 for BMI at 20 years old; n 6 for current weight or height; n 3 for waist circumference) were not excluded. All individuals gave their informed consent for inclusion before they participated in the study. The study was conducted in accordance with the Declaration of Helsinki and the protocol was approved by the National Research Ethics Committee (CONEP No. 13065).
Data collection
Baseline was conducted in 2008–2010, by trained personnel, using validated and pre-tested questionnaires with information about participants’ workplace, socio-economic data, and clinical history of diabetes and other diseases and drug use. Anthropometric data (height, weight, waist and hip circumferences) and clinical tests (such as electrocardiogram, fasting blood test and measurement of blood pressure) were also collected.
Study variables
Demographic and socio-economic variables included in the analysis were: year of birth, sex, per capita family income, education level, maternal education level, marital status and number of children. Year of birth was categorized into three birth cohorts: (i) Traditionalists or Vargas Era (generation born between 1934 and 1945, aged 63 to 74 years at baseline); (ii) Baby Boomers or Pre-dictatorship Generation (generation born between 1946 and 1964, aged 44 to 62 years at baseline); and (iii) Generation X or Dictatorship Generation (generation born between 1965 and 1975, aged 35 to 43 years at baseline). Hereafter, the three generations are named Traditionalists, Baby Boomers and Generation X to corroborate the nomenclature used in other studies.
Education level was classified according to the highest grade with approval and individuals were classified as: incomplete basic education level (never attended school or incomplete basic education); complete basic education (complete basic education or incomplete secondary school); secondary school (complete secondary school or incomplete undergraduate school); and university (complete undergraduate school or more).
Anthropometric variables used in the analysis included: birth weight (self-reported), weight at 20 years of age (self-reported), current weight and height, and waist circumference. Weight was measured on a platform scale (Toledo®, São Bernardo do Campo, São Paulo, Brazil) with 50 g precision and height was measured by a stadiometer (Seca®, Hamburg, Germany) with 0·1 cm precision. The assessment of nutritional status was represented by BMI, calculated as weight/height2 (kg/m2). BMI classification followed the WHO criteria: underweight (<18·5 kg/m2); normal weight (18·5–24·9 kg/m2); overweight (25·0–29·9 kg/m2); and obesity (≥30·0 kg/m2). Few individuals were classified as underweight (BMI<18·5 kg/m2; n 139), therefore they were included in the normal weight category.
Central obesity was evaluated by the waist-to-height ratio, which was calculated using waist circumference and height. The circumference of the waist was measured by a non-extensible anthropometric tape (Mabis®, Waukegan, IL, USA) with 0·1 cm precision. The waist-to-height ratio was categorized into: <0·5 (absence of central obesity); and≥0·5 (presence of central obesity).
Food consumption was investigated using a 114-item FFQ, validated with 281 participants of ELSA-Brasil( Reference Molina, Benseñor and Cardoso 11 ).
Leisure-time physical activity was assessed using the validated Brazilian version of the International Physical Activity Questionnaire (IPAQ)( Reference Hallal and Victora 12 ). The recommendations of the IPAQ guidelines for data processing and analysis were used to classify individuals as: low (individuals who do not exercise and do not meet the criteria to be included in the other categories); moderate (vigorous-intensity activity for at least 20 min/d on ≥3d/week, or moderate-intensity activity and/or walking for at least 30 min/d on ≥5d/week, or any combination of walking, moderate- and/or vigorous-intensity activities on ≥5d/week, reaching at least 600 MET-min/week); or intense (vigorous-intensity activity on ≥3d/week reaching at least 1500MET-min/week, or any combination of walking, moderate- and/or vigorous-intensity activities on ≥7d/week reaching at least 3000 MET-min/week; where MET is metabolic equivalent of task).
Other variables evaluated in the current study included: smoking status (never smoked, former smoker; smoker); alcoholic beverage consumption (never consumed, former consumer, consumer); excessive alcoholic beverage consumption (≥210 g alcohol/week for men, ≥140 g alcohol/week for women); and binge drinking (consumption of ≥5 doses of alcohol in a period of 2 h at least 2–3 times/month over the past 12 months).
Data analysis
Descriptive statistics were used to evaluate the differences between birth generations. The χ 2 test was used for categorical variables and ANOVA was used for continuous variables.
To identify data-driven dietary patterns using LCA, food items were first aggregated into thirteen mutually exclusive food groups based on their nutritional content and considering the nature, extent and purpose of industrial processing used in food manufacture( Reference Monteiro, Cannon and Levy 13 ). These food groups were: (i) cereals and tubers and roots; (ii) skimmed milk and dairy products; (iii) white meats and fish; (iv) fruit; (v) vegetables; (vi) legumes and nuts; (vii) whole milk and dairy products; (viii) red meats; (ix) processed meats; (x) ultra-processed products; (xi) soft drinks and industrialized fruit drinks; (xii) sweets; and (xiii) coffee. For each food group, participants were first categorized into quintiles of energy consumption and then classified into three categories: low consumption (first and second quintiles); moderate consumption (third and fourth quintiles); and high consumption (fifth quintile). The observed distribution of the food groups was modelled as a function of a single multinomial latent class variable.
First, we assumed that the distributions of food groups were independent, conditional on class membership. Second, a variety of models were fit to each birth generation separately to determine whether the groups were better represented by models with the same number of latent classes. Models ranging from two to six classes were estimated to identify the best model, based on model-fit indices (Akaike information criterion; Bayesian information criterion; Lo–Mendell–Rubin probability; model entropy; log likelihood) and substantive interpretation.
Second, we evaluated whether the latent variable had the same measurement characteristics in each group, testing the hypothesis of invariance across generation groups (H0). We compared two models: Model 1 with all parameters free (without restrictions) and Model 2 with the restriction that all conditional probabilities were the same in the groups. The comparison between models was made statistically by the likelihood-ratio test, which is distributed as a χ 2 with df=df2 − df1.
All analyses were carried out using Mplus 5.0 software and the SAS statistical software package version 9.3. General linear models were used to compare total energy intake and mean energy intake from each food group across birth generations as well as across latent class membership in each generation, using the contrast function to evaluate differences between each latent class. Values of P<0·05 were considered statistically significant.
Results
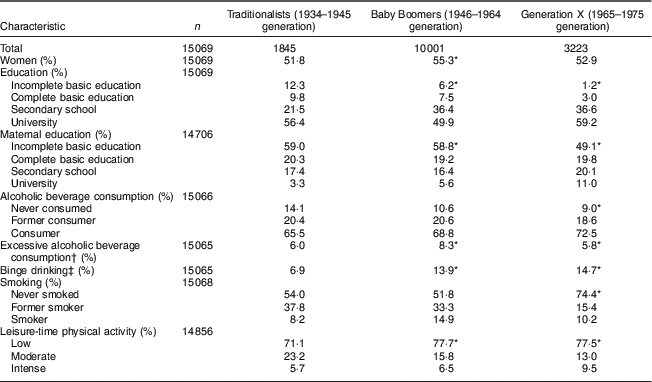
On average, Traditionalists, Baby Boomers and Generation X presented at 68·0, 52·9 and 40·4 years old, respectively. Generation X had the highest frequency of higher education level and maternal education level. A lower proportion of Generation X never consumed alcoholic beverages and a higher proportion of this generation reported binge drinking compared with other generations. Compared with Traditionalists, Generation X reported higher frequencies of never being a smoker, but lower frequencies of moderate plus intense physical activity (Table 1).
Table 1 Sociodemographic and lifestyle characteristics according to birth generation. Brazilian Longitudinal Study of Adult Health (ELSA-Brasil), baseline, 2008–2010
The χ 2 test was used for categorical variables.
* P<0·05 compared with the Traditionalist generation.
† Consumption of ≥210 g alcohol/week among men and ≥140 g alcohol/week among women.
‡ Consumption of ≥5 doses of alcohol in a period of 2 h at least 2–3 times/month over the past 12 months.
As expected, the prevalence of diabetes and hypertension was higher among Traditionalists compared with Baby Boomers and Generation X (34·7, 21·0 and 7·0 % for diabetes and 63·0, 37·1 and 16·0 % for hypertension, respectively), while the prevalence of low HDL-cholesterol was higher among Generation X (21·0 %, v. 17·4 % in Baby Boomers and 15·9 % in Traditionalists). On the other hand, the prevalence of hypertriacylglycerolaemia was higher among Baby Boomers and Traditionalists (33·4 and 30·0%, respectively, v. 24·9 % in Generation X).
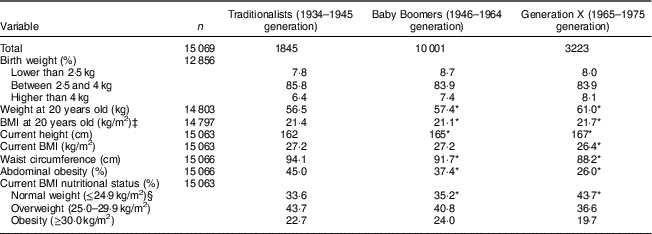
Regarding anthropometric measures, there were no differences in birth weight between the three generations. Weight and BMI at 20 years old were greater in Generation X compared with Traditionalists and Baby Boomers, although the average current BMI was lower. Waist circumference and percentages of abdominal obesity and obesity were lower among Generation X than the other generations (Table 2).
Table 2 Nutritional status according to birth generation. Brazilian Longitudinal Study of Adult Health (ELSA-Brasil), baseline, 2008–2010
The χ 2 test was used for categorical variables and ANOVA was used for continuous variables.
* P<0·05 compared with the Traditionalist generation.
‡ BMI at 20 years old was calculated using the reported weight at 20 years and the measured height at baseline.
§ Includes underweight and normal-weight individuals.
Generation X presented higher energy intakes from cereals and tubers and roots; legumes and nuts; soft drinks and industrialized fruit drinks; and sweets, cakes and cookies. On the other hand, Baby Boomers presented higher mean energy intakes from cereals and tubers and roots; legumes and nuts; soft drinks and industrialized fruit drinks; and sweets, cakes and cookies than the Traditionalist generation, while Traditionalists presented higher mean energy intakes from fruit and vegetables than the other generations (Table 3). Adjusting for total energy intake, little changes were seen between groups: differences in energy from cereals and tubers and roots were not significant between generations. The consumption of whole milk and dairy products and the consumption of white meat and fish lost statistical significance when comparing other generations with Traditionalists, and Baby Boomers with Traditionalists, respectively, when controlling for total energy intake (data not shown).
Table 3 Total energy intake (kcal), food groups and mean energy intake from each food group (kcal) according to birth generation. Brazilian Longitudinal Study of Adult Health (ELSA-Brasil), baseline, 2008–2010

Comparisons were made using linear regression models with generation being the independent variable and using the contrast function to evaluate differences between each birth generation.
To convert to kJ, multiply kcal values by 4·184.
* P<0·05 compared with the Traditionalist generation.
† P<0·05 compared with the Baby Boomer generation.
The model-fit indices for latent class models, for the entire population and each birth cohort, including two to six latent classes, are described in Table 4. As the number of classes included in the model increased, the Akaike information criterion and log likelihood indicated monotonically improving fit. The Bayesian information criterion decreased as the number of classes increased, indicating improved model fit. On the other hand, entropy indicated that model fit was best for the two-class model for the entire population and for each birth generation, except for Traditionalists, in which the four-class model presented the highest entropy. All models were also substantively evaluated to verify their ability to discriminate individuals. According to model parsimony and the interpretation of classes, the three-latent-class solution represented the best data for the entire population. Evaluating each birth generation group, the three-latent-class model fitted better than the other models, especially considering the interpretation of classes.
Table 4 Model-fit indices for latent class models, among the entire population and according to birth generation. Brazilian Longitudinal Study of Adult Health (ELSA-Brasil), baseline, 2008–2010

AIC, Akaike information criterion; BIC, Bayesian information criterion; LL, log likelihood; LMR, Lo–Mendell–Rubin.
The evaluation of whether the item-response probabilities were invariant across groups, through comparing the fit of two different latent class models (Model 1 with all parameters free to vary across groups and Model 2 with item-response probabilities constrained to be equal across groups), showed that Model 2 provided a significantly poorer fit to the data (P for the difference χ 2 test=0·0). Thus, the hypothesis of invariance across groups (H0) was rejected and results are shown separately for each birth generation group.
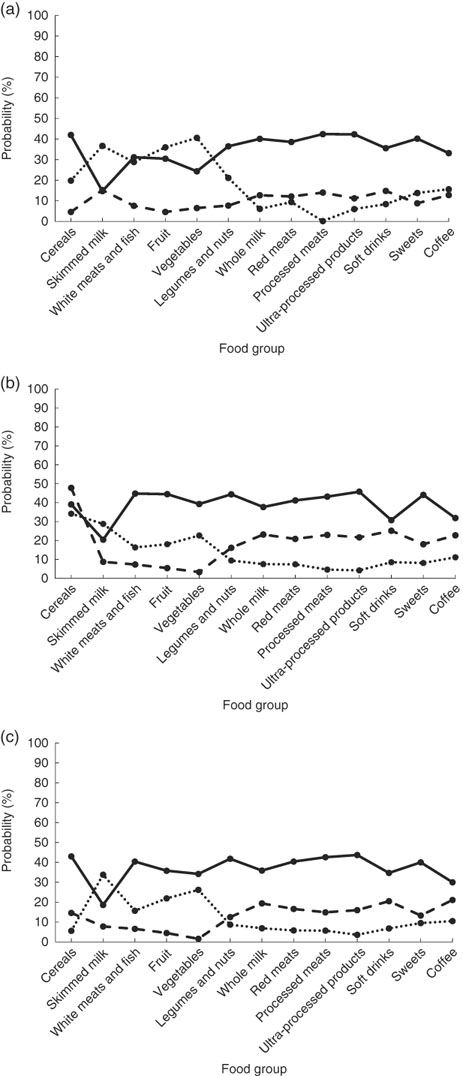
Important differences in food patterns were found between Traditionalists and other generations. For Baby Boomers and Generation X, we identified three classes named mixed pattern, processed pattern and prudent pattern (Fig. 1).

Fig. 1 Probabilities of high consumption of food groups, conditional on latent class membership, according to birth generation: (a) Traditionalists (![]() , mixed pattern;
, mixed pattern; ![]() , restricted pattern;
, restricted pattern; ![]() , prudent pattern); (b) Baby Boomers (
, prudent pattern); (b) Baby Boomers (![]() , mixed pattern;
, mixed pattern; ![]() , processed pattern;
, processed pattern; ![]() , prudent pattern); (c) Generation X (
, prudent pattern); (c) Generation X (![]() , mixed pattern;
, mixed pattern; ![]() , processed pattern;
, processed pattern; ![]() , prudent pattern). Brazilian Longitudinal Study of Adult Health (ELSA-Brasil), baseline, 2008–2010
, prudent pattern). Brazilian Longitudinal Study of Adult Health (ELSA-Brasil), baseline, 2008–2010
Mixed pattern showed the highest probability of high consumption of both healthy food groups (cereals and tubers and roots; fruit; vegetables; white meats and fish; legumes and nuts) and unhealthy food groups (whole milk and dairy products; red meats; processed meats; ultra-processed products; sweets, cakes and cookies; coffee). Processed pattern was characterized by lower probability of high consumption of healthy food groups (cereals and tubers and roots; skimmed milk and dairy products; white meats and fish; fruit; vegetables; legumes and nuts) and higher probability of high consumption of unhealthy food groups (whole milk and dairy products; red meats; processed meats; ultra-processed products; sweets, cakes and cookies; coffee), although lower than the mixed pattern. Prudent pattern was differentiated from the processed pattern in having lower probability of high consumption of unhealthy food groups and higher probability of high consumption of healthy food groups, although lower than the mixed pattern (Fig. 1).
Among Traditionalists, we could also identify prudent and mixed patterns. However, a third pattern showed a different structure compared with other generations: low probabilities of high consumption of healthy and unhealthy food groups (Fig. 1). Forty-seven per cent of individuals were expected to belong to this class, named as restricted dietary pattern.
Thirty per cent of Traditionalists and individuals from Generation X were expected to belong to the mixed pattern, while 22·7 % of Baby Boomers were expected to belong to this pattern. Baby Boomers showed the highest frequency of individuals expected to belong to the prudent pattern (43·5 %, v. 21·8 % among Traditionalists and 34·9 % among Generation X). One-third of Baby Boomers and individuals from Generation X were expected to belong to the processed pattern.
The mean energy intake from each food group by latent class group and birth generation is shown in Table 5. Among all generations, the mean energy intake from skimmed milk was higher among the prudent pattern, while the mixed pattern presented the highest mean energy intakes from the other food groups, except for fruit and vegetables among Traditionalists. Among Baby Boomers and Generation X, individuals with a prudent pattern showed higher mean energy intakes from white meats and fish, fruit and vegetables than individuals with a processed pattern. Although energy intake from fruit was higher in the mixed pattern for Baby Boomers and Generation X, the consumption of natural fruit juice with sugar and fruit salad with sugar was higher in the mixed pattern than the prudent pattern (natural fruit juice with sugar: 457·7 kJ (109·4 kcal) v. 151·9 kJ (36·3 kcal) for Baby Boomers and 426·3 kJ (101·9 kcal) v. 223·8 kJ (53·5 kcal) for Generation X, respectively; fruit salad with sugar: 48·5 kJ (11·6 kcal) v. 13·8 kJ (3·3 kcal) for Baby Boomers and 41·4 kJ (9·9 kcal) v. 17·2 kJ (4·1 kcal) for Generation X, respectively).
Table 5 Food group energy intakes (kcal) by latent class group (food patterns) according to birth generation. Brazilian Longitudinal Study of Adult Health (ELSA-Brasil), baseline, 2008–2010

Comparisons were made using general linear models with latent class group being the independent variable and using the contrast function to evaluate differences between each class (food pattern).
To convert to kJ, multiply kcal values by 4·184.
* P<0·05 compared with the prudent pattern.
† P<0·05 compared with the mixed pattern.
Regarding weight status according to dietary pattern and birth generation, the majority of the individuals presented overweight or obesity. Individuals expected to belong to the prudent pattern presented a higher percentage of normal weight, independently of birth generation (Fig. 2).
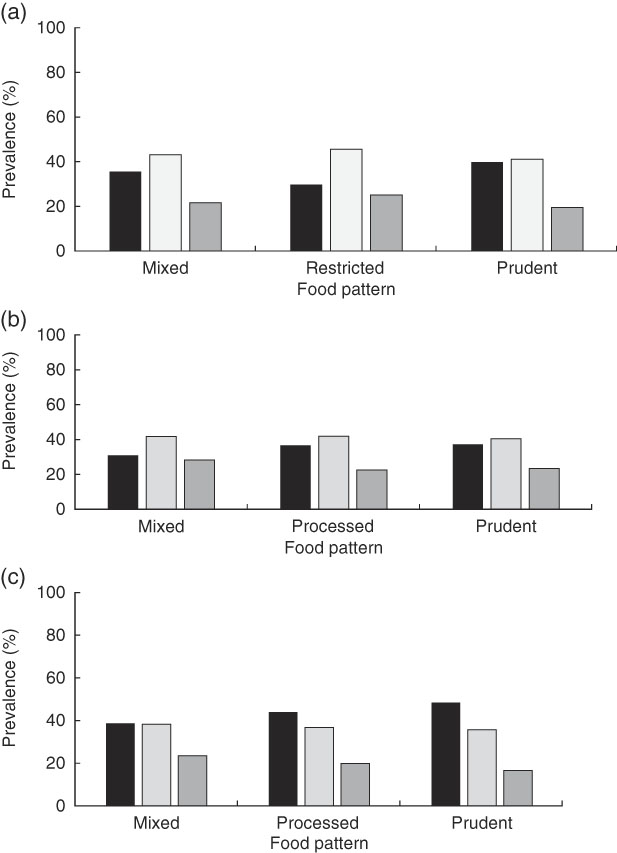
Fig. 2 Weight status distribution (![]() , normal weight;
, normal weight; ![]() , overweight;
, overweight; ![]() , obese) by latent class groups (food patterns) according to birth generation: (a) Traditionalists; (b) Baby Boomers; (c) Generation X. Brazilian Longitudinal Study of Adult Health (ELSA-Brasil), baseline, 2008–2010
, obese) by latent class groups (food patterns) according to birth generation: (a) Traditionalists; (b) Baby Boomers; (c) Generation X. Brazilian Longitudinal Study of Adult Health (ELSA-Brasil), baseline, 2008–2010
Discussion
The present study was an exploratory one to evaluate the use of LCA as a method to identify generational differences in the dietary patterns among Brazilian adults born between 1934 and 1975. Three distinct dietary patterns were identified for each birth generation, using intakes of thirteen food groups. For Baby Boomers and Generation X, we found food patterns with similar structures: mixed pattern (with high probability of high consumption of both healthy and unhealthy food groups), prudent pattern (with low probability of high consumption of unhealthy food groups) and processed pattern (with low probability of high consumption of healthy food groups and high probability for unhealthy food groups). Among Traditionalists, we could also identify mixed and prudent patterns, but a third pattern, characterized by low probability of high consumption of all food groups, was also identified. Traditionalists presented higher frequencies of individuals within this pattern, that we named restricted dietary pattern.
It is well known that older adults go through important physical, psychological and social changes that can interfere with their dietary habits. Individuals in the restricted dietary pattern showed reduced consumption of all food groups, lower total energy intake and lower energy intakes from the majority of food groups compared with individuals in the mixed and prudent dietary patterns. Although the restricted pattern showed higher probabilities of consumption of unhealthy food groups than the prudent pattern, the probabilities of consumption of healthy foods were lower. It is believed that older adults may have biological modifications or diseases that require changes in diet, contributing to a reduction in their overall food consumption( Reference Amarya, Singh and Sabharwal 14 ).
Another issue is that Traditionalists (born between 1934 and 1945) experienced periods of economic recession and food shortages when they were 20 years old (1954–1965), which could have influenced the desire for eating a variety of foods, but carefully consuming them in a moderate way.
On the other hand, Baby Boomers and Generation X presented similar structures of classes. Different from Traditionalists who presented higher intakes of skimmed milk, fruit and vegetables in the prudent pattern, Baby Boomers and Generation X presented higher intakes only for skimmed milk in this dietary pattern. The main difference between Baby Boomers and Generation X is the higher frequency of individuals expected to belong to the prudent pattern among Baby Boomers, but this can also be explained by the fact that they might be more conscious about diet than individuals from Generation X.
Generation X presented higher energy intakes from soft drinks and industrialized fruit drinks and sweets, cakes and cookies, and lower energy intakes from fruit and vegetables, than Baby Boomers and Traditionalists. It is well known that young adults present a lower overall diet quality compared with older adults( Reference Otsuka, Yatsuya and Tamakoshi 15 – Reference Bezerra, Goldman and Rhodes 17 ). Even with higher total energy intake, the consumption of high-nutrient and low-energy-density foods is lower than in older generations. The decline in energy intake with increasing age found in the present study is also well documented elsewhere and can be a result of both physiological impairment and non-physiological factors, such as medical conditions( Reference Johnston, Poti and Popkin 5 , Reference Bezerra, Goldman and Rhodes 17 ).
One important issue to consider is the increase in the marketing and accessibility of ultra-processed products, soft drinks and industrialized fruit drinks in recent years. Also, the migration of the population from rural to urban areas in the last decades changed the influence of home-produced foods to industrialized commercially foods, which might have contributed to shape the food habits of younger generations( Reference Martins, Levy and Claro 18 ). Younger adults devote less time to cooking compared with older generations, with their diet relying mainly on convenience and time-saving foods( Reference Kolodinsky and Goldstein 19 ), which are usually highly processed with large amounts of sugar, fat and sodium( Reference Louzada, da, Martins and Canella 20 ). Zarei and Ahmadi compared the consumption of traditional and ‘modern’ foods (including fast foods, processed foods, canned goods, foods ready for consumption) of 618 Iranian women (309 mothers and their daughters) and found that the younger generation (second generation) showed higher consumption of processed foods( Reference Zarei and Ahmadi 21 ). This behaviour might contribute to a lower diet quality, suggesting an increasing risk of the development of diet-related chronic diseases( Reference Wolfson and Bleich 22 ).
One possible consequence of the development of diet-related chronic diseases among younger individuals is the excessive weight gain among Generation X compared with older generations. Weight and BMI at 20 years old were greater among Generation X than Traditionalists. Although being highest than other generations, Generation X presented lower current BMI, being still within normal BMI values.
Pilkington et al. analysed data from the National Health Survey in Australia and compared the prevalence of diabetes and obesity between Baby Boomers and Generation X at the age of 25–44 years. The authors found that Generation X presented higher prevalence of these conditions, independent of sex, age, education, smoking status and physical activity( Reference Pilkington, Taylor and Hugo 7 ). Similar findings were also described in other studies, suggesting that the newer generation may have greater odds of developing chronic diseases compared with the later generations at the same age( Reference Robinson, Utz and Keyes 23 , Reference Falger 24 ).
This may reflect the economic and health situation experienced by these people at the age of 20 years. Individuals who were 20 years old between 1985 and 1995 (Generation X) had greater access to food, despite they were born during the Military Coup of Brazil and experienced periods of high economic instability. In the 1990s, Brazil changed its economic policy and showed important economic developments, which could have influenced the desire of Generation X in acquiring diverse and plentiful foods that were not accessible to them during their childhood.
The use of LCA to identify food patterns has been shown to be an effective and valid method to organize patterns of responses. For the present study, different approaches were tested before choosing to report results based on the three-class model stratified for each generation. Although the mixed pattern showed higher probabilities of high consumption for the majority of food groups in all generations, suggesting low capacity to discriminate individuals, this pattern is very similar to characteristics of the Brazilian diet being reported in other studies( Reference Souza, de, Pereira and Yokoo 25 , Reference Marchioni, Claro and Levy 26 ).
A previous study with the same population of ELSA-Brasil derived four dietary patterns: traditional, fruit and vegetables, bakery products, and low sugar/low fat( Reference Cardoso, de, Carvalho and Cruz 27 ). Although they used a different approach to identify dietary patterns, our findings are quite similar to theirs. Their fruit and vegetable pattern is characterized by daily consumption of raw and light green vegetables, fruits, grilled chicken, white cheese and semi-skimmed milk, being similar to our prudent pattern identified in all generations. In our study, skimmed milk was shown to be a good indicator for the prudent pattern in all generations.
Their traditional pattern includes individuals who consume beans, refined cereals, red meats and processed red meat products, white meats and confectionery in general daily or weekly. Their bakery pattern represents individuals with daily consumption of refined cereals, bread, biscuits, fried chicken, full-cream milk and dairy products and with no consumption of fruit and vegetables. These two dietary patterns are similar to what we named the mixed pattern( Reference Cardoso, de, Carvalho and Cruz 27 ). In accordance with these findings, Souza et al. found that the most consumed foods in Brazil are rice, beans, bread, coffee and meat, along with ultra-processed foods such as soft drinks and fruit drinks with added sugar, suggesting that traditional dietary patterns have incorporated processed foods rich in energy density and poor in nutrient content( Reference Souza, de, Pereira and Yokoo 25 ).
Comparisons of our results with previous studies are difficult to make because of the different approaches used to identify and name dietary patterns. In our paper, we used the LCA method that is a useful tool for identifying subgroups of individuals with similar food habits based on the intersection of intakes of multiple food items. One challenge of cluster models is to identify the best number of classes. The advantage of LCA is the possibility to identify the ideal number of classes because it is a model-based method. It uses a finite mixture model that derives clusters by a probabilistic model that is based on the distribution of the data, identifying subgroups by modelling them as a latent categorical variable. In addition, it is possible to calculate each individual’s probabilities of class membership. In recent years, this approach has been used to identify food patterns of individuals that are not directly observable.
On the other hand, the interpretation of our findings should be done carefully because of the difficulty of separating changes related to birth generations’ differences in food intake from physiological changes related to ageing. Older people undergo physiological changes that can alter their food consumption, but their food behaviour can also be attributable to the social, cultural, economic and environmental history of their lifetime experiences. Another issue is the fact that as people age it is more difficult to report food frequency intake accurately. However, in the beginning of the interview individuals were evaluated regarding mental cognition. We should also keep in mind that other factors influence food choices, such as living arrangements, family structure, household income and others; and these factors might influence individuals differently according to their age.
Moreover, other issues arise from the difficulty of separating cohort and age effects using a cross-sectional approach. Traditionalists and Baby Boomers have higher frequency of current overweight and obesity than Generation X, despite they might have a healthier diet. One possible explanation is the fact that older individuals are more likely to make behavioural changes due to the presence of chronic diseases or more concern about the relationship between diet and health. Even though Traditionalists and Baby Boomers presented higher current BMI, consequently a higher risk of developing chronic diseases, Generation X might have higher BMI as they age and reach the actual age of Traditionalists and Baby Boomers. This can happen not only because of their greater BMI at 20 years old, but also due to their higher energy intake and lower nutritional diet. If individuals from Generation X keep their current dietary habits, they might develop obesity and other chronic diseases.
Our study brings a different approach of evaluating food patterns, focusing on generational differences in food intake and not limited to age differences. The extensive nature of the ELSA-Brasil study enables more accurate and systematic examination of dietary patterns in different birth generations, bringing new insights on how Brazilian people modulated their diet over periods of different economic and social settings.
Although Baby Boomers have had higher intakes of healthy foods than Generation X, these two generations seem to present more similar food habits compared with Traditionalists. Our finding that older generations consumed more fruit and vegetables indicates that public health strategies likely need to pay more attention to younger age groups to achieve the goal of the Brazilian food guidelines.
The younger generation presented higher BMI at 20 years old, higher energy intake and lower nutritional diet, indicating that they may age with a greater burden of chronic diseases. Young generations represent part of the actual food consumption in Brazil as well as the future one. Therefore, if the changes in food habits continue in this direction there will be significant implications for the health conditions of the Brazilian population, with major impacts on the health system and workforce participation. It is important to develop public health interventions focusing on the youngest generations and conduct more studies to understand dietary patterns across the life course and prevent diet-related chronic diseases.
Acknowledgements
Acknowledgements: The authors would like to thank all the researchers, staff and participants involved with the ELSA-Brasil study and the University of Fortaleza for their support in the development of the study. Financial support: The ELSA-Brasil baseline study was supported by the Brazilian Ministry of Health (Science and Technology Department) and the Brazilian Ministry of Science and Technology (Financiadora de Estudos e Projetos and the National Research Council (CNPq)) (grant numbers 01 06 0010.00 RS, 01 06 0212.00 BA, 01 06 0300.00 ES, 01 06 0278.00 MG, 01 06 0115.00SP, 01 06 0071.00 RJ). I.N.B. received support from the CNPq/Coordination for the Improvement of Higher Education Personnel (CAPES) programme through a research scholarship provided by ‘Pós-doutorado júnior’, part of the Public Call MCT/CNPq/MEC/CAPES – Ação Transversal nº 06/2011 – Casadinho/Procad (process number 150647/2015-8). The funders had no role in the design, analysis or writing of this article. Conflict of interest: There is no conflict of interest. Authorship: I.N.B. performed the statistical analysis, data interpretation and drafted the initial manuscript and the final paper. N.M.S.G.B. performed the statistical analysis and data interpretation. L.O.C., M.C.C.A., M.C.B.M. and M.J.M.F. assisted with literature review, interpretation and approved the final paper. S.M.A.M. conceived the paper, performed data interpretation and drafted the initial manuscript and the final paper. E.M.L.A., D.C. and D.M.L.M. contributed with intellectual content to the paper, analysed the data, assisted with literature review and wrote the final paper. All authors approved of the final draft of the manuscript. Ethics of human subject participation: The ELSA-Brasil study was conducted according to the guidelines laid down in the Declaration of Helsinki and received respective approval from each participating institution’s institutional review board. All cohort members who agreed to participate in the study signed an informed consent form.