


The food system is a major producer of greenhouse gas emissions (GHGE)( Reference Carlsson-Kanyama 1 ). By some estimates, the production, processing and distribution of food accounts for up to 30 % of global GHGE( Reference Vermeulen, Campbell and Ingram 2 ). It was recently estimated that life-cycle GHGE from food purchasing accounted for 16 % of total GHGE in the USA in 2013( Reference Boehm, Wilde and Ver Ploeg 3 ). Livestock production alone has been estimated to account for up to 18 to 22 % of global GHGE( Reference McMichael, Powles and Butler 4 ). Life-cycle assessments have consistently found that beef and pork are more carbon intensive to produce, compared with chicken, milk and eggs, on a per mass basis( Reference de Boer, de Witt and Aiking 5 ). In other studies lamb has been found to be even more carbon intensive to produce than beef( Reference Hamerschlag 6 ). While efficiencies in agricultural and livestock production, food processing and distribution can contribute to food system GHGE mitigation, demand-side GHGE reductions through dietary changes are needed to significantly reduce total food system GHGE( Reference Scarborough, Appleby and Mizdrak 7 – Reference Stehfest, Bouwman and Vuuren 9 ).
A shift to a more plant-based diet may also have nutrition and health benefits for US consumers. Evidence suggests that plant-based dietary patterns bestow significant health benefits in the form of reduced chronic disease incidence and all-cause mortality through improvements in nutritional quality( Reference Sabaté and Soret 10 – Reference Satija, Bhupathiraju and Spiegelman 13 ). A shift away from red meat towards more plant-based foods may be particularly beneficial for the US population. Epidemiological research has found a clear link between red meat consumption and increased risk of CVD, type 2 diabetes and cancer mortality among the US population( Reference Pan, Sun and Bernstein 14 , Reference Pan, Sun and Bernstein 15 ). The WHO recently classified excessive consumption of red meat as carcinogenic( 16 ). Consequently, there may be advantages from both a public health nutrition and a climate change mitigation perspective to reduce red meat consumption among the US population.
When examined at the diet level it is not yet clear how lower red meat consumption would contribute towards decreased food system GHGE and, simultaneously, what the implications would be for diet quality and food costs. Simulated vegetarian or vegan food patterns have been found to result in fewer GHGE than conventional food patterns containing more animal products such as red meat( Reference Bajželj, Richards and Allwood 8 , Reference Sabaté and Soret 10 , Reference Soret, Mejia and Batech 11 , Reference Berners-Lee, Hoolohan and Cammack 17 , Reference Vieux, Soler and Touazi 18 ), but such studies generally rely on assumed, rather than actual substitution patterns observed across consumers. A 2016 systematic review of sixteen studies concluded that lower-carbon diets sometimes result in lower diet quality, but not all reviewed studies explicitly addressed red meat intakes as an outcome( Reference Payne, Scarborough and Cobiac 19 ). One of the US-based studies in that review found that lower red meat diets generated less GHGE, small increased intake of plant foods and a reduction in overall energy intake( Reference Soret, Mejia and Batech 11 ). Another systematic review found that reducing the environmental impacts of diets generally was proportional to reductions in animal-based food and that this shift was found to have modest health benefits( Reference Aleksandrowicz, Green and Joy 20 ). However, only four of the studies reviewed by Aleksandrowicz et al.( Reference Aleksandrowicz, Green and Joy 20 ) were conducted in the USA and results from other countries may not be relevant to the US context given its consumers’ unique food spending and eating patterns.
US-based research on the relationship between red meat intake and dietary GHGE is emerging, but limited. Shifting current US diets to meet the Dietary Guidelines for Americans (DGA), which include lower red meat and energy intakes, was found to increase food system GHGE by 6 %( Reference Tom, Fischbeck and Hendrickson 21 ). However, decreased red meat intake to satisfy the recommended diet patterns and to lower emission levels was not assessed in isolation( Reference Tom, Fischbeck and Hendrickson 21 ). Harwatt et al. showed that GHGE would be reduced substantially if all US consumers substituted beans for beef in their diets( Reference Harwatt, Sabaté and Eshel 22 ), although the feasibility of such an approach is questionable. In a modelling study Tichenor-Blackstone et al. compared the life-cycle environmental burdens of diet patterns recommended by the 2015–2020 DGA, including the Healthy US style, Healthy Mediterranean style and Healthy Vegetarian style( Reference Blackstone, El-Abbadi and McCabe 23 ). The Healthy Vegetarian pattern containing no red meat generated substantially lower GHGE compared with the other diet patterns which contained red meat( Reference Blackstone, El-Abbadi and McCabe 23 ). However, the study did not directly assess or compare the DGA recommended patterns with current US diets and red meat intakes. Further work examining GHGE, red meat consumption and nutritional quality of food choices is necessary given these mixed and limited findings in the USA.
Examining diets in terms of GHGE, red meat intake and nutritional quality should be conducted in the context of affordability, given concerns about food insecurity among the US population. To date consumer dietary food costs, nutritional quality and GHGE have been linked simultaneously only in studies based in the UK and France( Reference Monsivais, Scarborough and Lloyd 24 – Reference Barré, Perignon and Gazan 27 ). In Monsvais et al., individuals conforming more closely to recommended dietary patterns generated lower diet-related GHGE, but results were mixed on dietary costs( Reference Monsivais, Scarborough and Lloyd 24 ). However, these studies did not explicitly show the relationship between changes in red meat spending, GHGE and nutritional quality( Reference Blackstone, El-Abbadi and McCabe 23 – Reference Macdiarmid, Kyle and Horgan 25 ).
In the USA analyses of food prices suggest that proteins such as those provided in legumes and grains are substantially less expensive for consumers per kilojoule compared with animal proteins( Reference Drewnowski 28 ). In a representative survey of US consumers, some, but not all vegetarians, spent less on food than meat eaters; on average $US 19·28 less per week( Reference Lusk and Norwood 29 ). Therefore, further research simultaneously examining red meat intakes or purchases, nutritional quality, food costs and GHGE is warranted, especially in the US context.
The objective of the present study was to determine if US household food purchasing patterns with lower red meat (beef, pork and lamb) spending as a share of the total food budget have lower life-cycle GHGE, improved nutritional quality, and if they are more aligned with the DGA. Total weekly food spending by red meat spending share levels was also assessed. The present study is the first US one to examine GHGE generated by self-selected US household food choices according to the level of food spending on red meat, while concurrently examining diet quality and food affordability.
Methods
Participants and household food expenditure reporting
A total of 4826 households participating in the 2012–2013 National Household Food Acquisition and Purchase Survey (FoodAPS) recorded all food purchases and acquisitions, including free foods acquired, for a 7d period between April 2012 and January 2013. Each household member was given a booklet to record the quantity, size or amount (grams, ounces, pounds) and total expenditure of each food purchase or acquisition made for at-home and away-from-home consumption, by eating occasion (i.e. breakfast, lunch, dinner, snack). The designated primary respondent (PR) reported food purchases and acquisitions by telephone and completed a pre- and post-survey interview with survey administrators. In both the pre- and post-survey interviews the PR reported household characteristics (e.g. income, race/ethnicity, participation in federal assistance programmes). The survey sample is nationally representative of the US non-institutionalized population and the sampling procedure is available on the website of the US Department of Agriculture (USDA) Economic Research Service( 30 , 31 ). Of the 4826 households surveyed, 4706 households were included in the final analysis sample. Households removed from the sample (n 120) reported zero food expenditures for the reporting week or reported implausible food expenditures or kilojoules purchased.
Foods purchased or acquired were coded by the USDA Economic Research Service into broad food categories and nutrition information was appended to each food using the National Nutrient Database for Standard Reference (SR), the Food and Nutrient Database for Dietary Studies (FNDDS) and the Food Patterns Equivalent Database (FPED)( 32 – 34 ).
Classification of households to red meat spending share quintiles
Food category data were used to classify each household food purchase or acquisition as a product containing beef, pork or lamb. Nine of 300 food categories were identified as single-ingredient beef, pork or lamb foods. Expenditures on foods in these nine categories were allocated to household weekly food spending on red meat. In addition, sixteen categories were identified as multi-ingredient dish foods containing beef, pork or lamb (e.g. burritos, tacos, burgers, pizza). For these foods, the amount of expenditure on red meat was calculated by multiplying the total expenditure on the multi-ingredient food by the ratio of red meat weight (in grams) to the total weight of the food (in grams). These multi-ingredient, category specific average ratios are reported in the online supplementary material, Supplemental Table 1. Red meat and total food weights were derived from the Food Intakes Converted to Retail Commodity Database (FICRCD)( 35 ). FICRCD was used to convert foods purchased by consumers into their food commodity components by weight. FoodAPS foods were linked to the FICRCD using FNDDS food codes. Multi-ingredient foods containing red meat accounted for only 5·7 % of total foods reported in FoodAPS.
Total household red meat spending was calculated as the sum of spending on single-ingredient red meat foods, plus the sum of red meat spending share for multi-ingredient foods containing red meat. The share of household weekly food spending on red meat was calculated by dividing total weekly red meat spending by total weekly household food spending. Households were divided into survey-weight-adjusted quintiles based on their red meat spending share. FoodAPS survey sample weights were applied to the calculation of quintiles so that they were constructed based on a representative sample of US households. Consequently, the numbers of households per quintile are equal in the weighted sample. Households in weighted quintile 1 (Q1) spent ≤3·4 % of their total food budget on red meat; Q2 households spent >3·4 and ≤7·4 %; Q3 households spent >7·4 and ≤11·9 %; Q4 households spent >11·9 and ≤ 18·3 %; and Q5 households spent >18·3 %.
Nutrients purchased and calculation of Healthy Eating Index-2010 score
Item-level nutrient content information from the National Nutrient Database for Standard Reference and FNDDS was attached to each food purchased or acquired. Nutrient data appended to foods were used to compute household weekly purchase of macronutrients and micronutrients.
Macronutrients assessed included: total carbohydrates (g), added sugars (g), fibre (g), total fat (g), saturated fat (g), poly- and monounsaturated fatty acids (g), cholesterol (mg), and protein (g). Micronutrients included: Ca (mg), choline, Fe (mg), Mg (mg), Zn (mg), K (mg), Na (mg), folate (µg), and vitamins A (µg), B6 (mg), B12 (µg), C (mg), D (µg), E (mg) and K (µg).
Healthy Eating Index-2010 (HEI-2010) total and component scores were calculated to assess how well household food purchases aligned with the 2010 DGA( Reference Guenther, Casavale and Reedy 36 ). HEI-2010 total score can range from 0 to 100, indicating how well a set of foods conforms to the DGA. HEI-2010 total score is composed of twelve component scores. Components represent each key food group recommendation in the 2010 DGA. Typically, HEI-2010 is used to assess food consumption using data collected in dietary recall studies( Reference Mancino and Todd 37 ). Because HEI-2010 score is computed on a kilojoule-adjusted basis it can also be used at various levels (e.g. food supply, federal food assistance programmes, restaurants) to assess alignment with federal dietary guidance( Reference Jahns, Scheett and Johnson 38 ). While it is less common to use HEI-2010 to assess quality of food purchases, recent research indicates that an HEI-2010 score computed using food expenditure data is significantly correlated with HEI-2010 score computed from food consumption data( Reference Appelhans, French and Tangney 39 ).
HEI-2010 component scores include: total fruit (maximum 5 points), whole fruit (5 points), total vegetables (5 points), greens and beans (5 points), whole grains (10 points), dairy (10 points), total protein foods (5 points), seafood and plant proteins (5 points), ratio of mono- and polyunsaturated to solid fatty acids purchased (10 points), refined grains (10 points, high score means lower accordance), sodium (10 points, high score indicates lower accordance) and solid fats/added sugars (20 points, high score indicates lower accordance). The sum of the values of component scores equals the total HEI-2010 score. A complete description of the HEI-2010 calculation used in the present study can be found in Guenther et al. and Mancino and Todd( Reference Guenther, Casavale and Reedy 36 , Reference Appelhans, French and Tangney 39 , Reference Guenther, Reedy and Krebs-Smith 40 ).
Calculation of greenhouse gas emissions generated by household food purchases and acquisitions
Total life-cycle GHGE (in kilograms of carbon dioxide equivalents; kg CO2e) generated by household food purchases and acquisitions were calculated using the Environmental Protection Agency’s US-based environmentally extended input–output (USEEIO) life-cycle assessment model( Reference Yang, Ingwersen and Hawkins 41 ). The USEEIO model provides emission intensity factors (EIF; in kg CO2e per dollar) for each industry in the US economy. Twenty-six of these industries represent those that produce or manufacture foods for human consumption, so all foods reported in FoodAPS were assigned EIF from one of these industries, using food descriptions and categories in FNDDS( 33 ). A food’s assigned EIF value (in kg CO2e per dollar) was multiplied by the household expenditure on each food (in dollars) to estimate total life-cycle GHGE (in kg CO2e). In some instances, the expenditure on a food was not reported by a household respondent, so an imputation process was used to estimate it. A detailed description of the process of calculating GHGE for food expenditures, including the imputation processes used to account for missing expenditure or weight data, can be found in Boehm et al.( Reference Boehm, Wilde and Ver Ploeg 3 ). Emissions from all stages of the food supply chain, including agricultural production, food manufacturing/processing, distribution (including transportation by boat, airplane, truck and rail), and restaurant and retail activity, are included in the GHGE calculated per food. Total weekly household GHGE are the sum of GHGE per food purchased or acquired.
Statistical analysis
Multiple linear regression analysis was used to produce average kilojoule-adjusted values for the key outcome measures: weekly GHGE, weekly household food spending and weekly nutrients purchased. There was one model per outcome measure. Each dependent variable in these models was one of the outcome measures (weekly GHGE, weekly household food spending or weekly nutrients purchased). Independent covariates in these models included a categorical variable indicating the red meat spending share weighted quintile to which a household was assigned and a continuous independent variable for total kilojoules purchased per week per household. Survey weights were applied to all statistical analyses, as specified by FoodAPS user manuals. ANOVA was used to evaluate statistical differences in household sociodemographic characteristics across red meat spending share quintiles. Average HEI-2010 component and total scores were also compared by red meat spending share quintiles using ANOVA. A Bonferroni correction to account for inflation of type 1 error rate was used to make pairwise post hoc comparisons across quintiles.
All analyses were conducted with the statistical software package Stata version 15/SE (2017).
Results
Household sociodemographic characteristics
Differences in household sociodemographic characteristics were observed across red meat spending share weighted quintiles (hereafter referred to as ‘quintiles’ for brevity), as reported in Table 1. Households in Q3 and Q4 had statistically higher average monthly income than households in Q5. Households in Q1 had on average fewer household members compared with households in all other quintiles. A larger percentage of households in Q2 and Q3 were food secure compared with Q5 households. The share of households currently participating in the Supplemental Nutrition Assistance Program was significantly lower for Q2 households compared with households in Q5. No statistical differences in household race or ethnicity were observed across quintiles.
Table 1 FoodAPSFootnote * household sociodemographic characteristics by red meat spending share weighted quintiles (Q)
SNAP, Supplemental Nutrition Assistance Program; PR, primary respondent.
* Household sociodemographic data are from the 2012–2013 National Household Food Acquisition and Purchase Survey (FoodAPS). Survey-weight-adjusted means or proportions are reported, with their 95 % CI.
† Based on survey-weight-adjusted ANOVA F test.
‡ Quintiles calculated using survey weights. Total sample size, n 4706.
Household PR in Q1 were more likely to have attained a college degree compared with household PR in Q4 and Q5. They were also more likely to have a master’s degree compared with household PR in Q5. Household PR in Q1 were also less likely to have only a high-school education compared with household PR in Q5. Household PR in Q2 were less likely to have less than 12 years of educational attainment compared with household PR in Q5. No other differences in educational attainment were observed across quintiles. In summary, households with the greatest share of spending on red meat tended to have lower incomes and the PR in these households tended to have less education.
Red meat spending share, total red meat spending and total weekly food spending
There were significant differences in red meat spending share, total red meat spending and total weekly food spending across red meat spending share quintiles (Table 2). Households in the quintile with the highest average red meat spending share (Q5) spent on average a little over one-quarter (27 %) of their food budget on red meat, while households in the lowest quintile (Q1) spent on average 1 % of their food budget on red meat. Households in Q1 spent on average $US 1·65 on red meat per week while households in Q5 spent twenty-three times that much per week on average. Controlling for total kilojoules purchased per week, households in Q2 and Q3 spent the most on food per week; the range in average weekly food spending for these households was $US 189·78 to $US 191·35. Households in Q1, Q4 and Q5 had similar levels of weekly food spending that on average ranged from $US 151·25 to $US 168·05.
Table 2 FoodAPSFootnote * household average weekly red meat spending share, average weekly spending on red meat and average weekly food spending adjusted for total kilojoules purchased, by red meat spending share weighted quintiles (Q)
* Household food expenditure data are from the 2013–2013 National Household Food Acquisition and Purchase Survey (FoodAPS).
† Red meat spending share was calculated as total household spending on red meat divided by total household food spending. This variable was used to determine to which red meat spending share quintile the household belongs.
‡ Based on survey-weight-adjusted ANOVA F test.
§ Survey-weight-adjusted means are reported; with 95 % CI with Bonferroni correction to account for multiple comparisons (all such values).
║ Survey-weight-adjusted multiple linear regression used to compute kilojoule-adjusted average weekly purchase of nutrients; with 95 % CI with Bonferroni correction to account for multiple comparisons (all such values).
Nutrients purchased
Results for average weekly purchase and acquisition (collectively referred to as ‘purchased’ for the remainder of the ‘Results’ section) of nutrients, adjusting for total kilojoules purchased, by red meat spending share quintile are reported in Table 3. For simplicity, Table 3 presents results solely for total kilojoules purchased and nutrients reported as of concern for the US population in the 2010 DGA( 42 ). Additional results are also reported in the online supplementary material, Supplemental Tables 2 and 3. The 2010 DGA are referenced to determine nutrients of concern because FoodAPS data were collected in 2012–2013, which overlaps with this version of the DGA. Nutrients of concern include: dietary fibre, Ca, K and for some sub-populations Fe, vitamin B12 and total dietary folate.
Table 3 FoodAPSFootnote * household average weekly purchase of energy and nutrients of concern by red meat spending share weighted quintiles (Q)
* Food-item nutrient data were attached to household food purchase and acquisition data and are from the 2012–2013 National Household Food Acquisition and Purchase Survey (FoodAPS).
† 1 kcal=4·184 kJ.
‡ Based on survey-weight-adjusted ANOVA F test.
§ Survey-weight-adjusted means are reported; with 95 % CI with Bonferroni correction to account for multiple comparisons (all such values).
║ Survey-weight-adjusted multiple linear regression used to compute kilojoule-adjusted average weekly purchase of nutrients; with 95 % CI with Bonferroni correction to account for multiple comparisons (all such values).
As reported in Table 3, households in Q1 purchased significantly fewer kilojoules compared with households in all other quintiles. Households in Q1 also purchased significantly higher levels of dietary fibre compared with households in all other quintiles. Households in Q5 purchased significantly lower levels of Ca compared with households in Q1–Q3. No difference in total K or Fe purchased was observed across quintiles. Purchase of vitamin B12 was on average highest for households in Q5, but not significantly different from the level purchased by households in Q3. Households in Q5 purchased significantly lower levels of total dietary folate compared with households in Q1–Q4.
Households in Q5 purchased the lowest level of carbohydrates compared with households in other quintiles (see online supplementary material, Supplemental Table 2). There was no difference in added sugars purchased across quintiles. Total fat purchased was substantially lower for households in Q1, compared with all other quintiles, and households in Q5 had the highest average value for total fat purchased. Difference in total fat purchased was due to differences in purchase of both saturated and monounsaturated fat, but not polyunsaturated fat. Households in Q5 purchased more protein and cholesterol compared with households in Q1–Q4.
Households in Q3–Q5 purchased lower levels of Mg compared with households in Q1 (see online supplementary material, Supplemental Table 3). Households in Q5 purchased higher levels of Zn compared with households in all other quintiles. No difference in purchase of Na was observed across quintiles. Households in Q3–Q5 purchased substantially lower amounts of vitamin A and vitamin K. Households in Q4–Q5 purchased the lowest levels of vitamins C and E compared with households in Q1–Q3. Households in Q5 purchased significantly less vitamin D than households in Q1.
Thus, macronutrient purchases did not seem to vary systematically over the quintiles of the share of red meat spending. However, for many, but not all, micronutrients, households that purchased the greatest share of red meat purchased fewer micronutrients.
Healthy Eating Index-2010 component and total scores
Average household total HEI-2010 score was lowest for households in Q5 and nearly 5 points lower than the average score for Q1 households (Table 4). Q5 households had an average total HEI-2010 score that was lower than the all-sample average, while households in Q2 had a higher average total HEI-2010 score than the all-sample average total HEI-2010 score. Households in Q5 had a lower average total HEI-2010 score compared with households in Q1–Q3.
Table 4 FoodAPSFootnote * household average Healthy Eating Index-2010 component and total scores for household food purchases and acquisitions by red meat spending share weighted quintiles (Q)
* Food-item nutrient data were attached to household food purchase and acquisition data and are from the 2013–2013 National Household Food Acquisition and Purchase Survey (FoodAPS).
† Based on survey-weight-adjusted ANOVA F test.
‡ Survey-weight-adjusted means; with 95 % CI with Bonferroni correction to account for multiple comparisons (all such values).
Significant differences in HEI-2010 component scores for food groups encouraged by the 2010 DGA explain the variation in total HEI-2010 score across quintiles. Households in Q5 had lower average scores for the total fruit, whole fruit and whole grains components compared with Q1 households. Households in Q5 had lower average dairy component scores compared with households in Q2–Q4. Households in Q1–Q4 had higher average seafood and plant proteins component scores compared with households in Q5. Average total protein foods component score was highest for households in Q4 and Q5.
There was also substantial variation in component scores for nutrients that are discouraged in the 2010 DGA. Higher scores for these components indicate lower conformance to the recommendations in the 2010 DGA. Q1 households had the highest sodium component score, indicating the highest level of purchase compared with households in other quintiles. Q5 households had a higher average refined grains component score compared with households in Q3 and Q4. No differences in average fatty acids and solid fats/added sugars component scores were observed across quintiles.
Weekly household greenhouse gas emissions from food purchases and acquisitions
Average weekly GHGE were lowest for households in Q1 relative to households in Q2–Q5. Average weekly GHGE were the same for households in Q2–Q5. Figure 1 shows kilojoule-adjusted average weekly GHGE by red meat spending share quintiles.
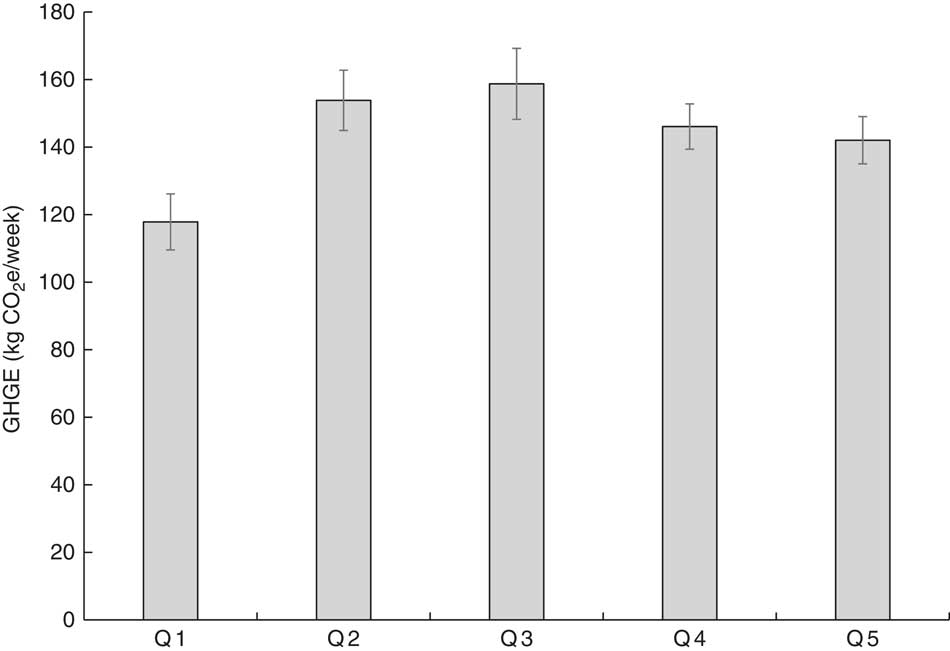
Fig. 1 Average weekly household greenhouse gas emissions (GHGE) by red meat spending share weighted quintiles (Q), with 95 % CI, adjusted for multiple comparisons with a Bonferroni correction, represented by vertical bars. Average values calculated using multiple linear regression, controlling for total kilojoules purchased per household per week. Household food purchase and acquisition data from the 2012–2013 National Household Food Acquisition and Purchase Survey (FoodAPS) were used to compute GHGE
Discussion
The present study used item-level food purchase and acquisition data from a representative sample of US households to examine how GHGE, food costs, food purchase nutritional quality and accordance with the DGA varied by red meat spending budget shares. It provides new evidence about how reductions in the share of household food spending on red meat can contribute to reducing GHGE, while also considering food affordability and diet quality. While the association between diet quality and GHGE has been studied in the UK and the EU, results were mixed on whether healthier dietary patterns can contribute to GHGE mitigation, and few of these studies examined the contribution of red meat spending or the issue of food affordability( Reference Payne, Scarborough and Cobiac 19 , Reference Jahns, Scheett and Johnson 38 , Reference Perignon, Vieux and Soler 43 ). By utilizing self-selected food purchase and acquisition data and assessing the affordability of food in the context of GHGE and nutritional quality, the present study provides important new evidence to inform the debate about aligning diets for climate change mitigation and public health nutrition goals.
Differences in household and household PR socio-economic and demographic characteristics across red meat spending share quintiles reported in Table 1 provide insight into what types of consumers are purchasing diets that are high in red meat. Households purchasing only moderate levels of red meat had higher monthly incomes and higher rates of food security than households purchasing more red meat as a share of total food spending. Households purchasing the highest amount of red meat as a share of total food spending were also more likely to be participating in the Supplemental Nutrition Assistance Program compared with households purchasing moderate amounts of red meat. Further, differences in educational attainment across red meat spending share quintiles suggest that less-highly educated US consumers purchased higher levels of red meat. Combined, these results suggest US red meat purchasing as a share of total food spending is greatest among consumers with lower socio-economic status. Future work can explore if greater spending on red meat by these groups is driven by preference or other factors such as price or prices of substitute meats such as fish or poultry.
The dramatic variation in both total red meat spending and red meat spending as a share of total household food spending is a central finding of the present study. Households with the highest average red meat spending share spent twenty-three times more on red meat per week compared with household with the lowest average red meat spending share. High red meat spending share households spent on average $US 40 per week and 27 % of their food budget on red meat. In 2012, there were 121·08 million households in the USA. Households in Q5 represent 20 % of all US households. Based on the present findings, these 24 million households spent an estimated $US 1 billion on red meat each week in 2012. Shifting red meat spending, even just for households who spend the most on red meat as a share of their total food budget, towards other foods could have significant consequences for diet and nutritional quality, the agricultural sector and the climate. Future studies can evaluate the macro-level impacts of shifting some of the US household food budget away from red meat to other foods.
The relationship between total food spending and red meat spending share was not clear. Controlling for total kilojoules purchased per week, households purchasing only moderate levels of red meat as a share of their total food budget spent the most on food per week. These results are not consistent with food price data in the USDA 2010 Quarterly Food at Home Price Database (the most recent year for which these data are available) and other reports of food prices on per portion, per kilojoule and per weight basis( Reference Carlson and Frazao 44 ), which indicate that on average red meats cost as much as $US 0·30 per lb (0·45 kg) more than poultry and fish( 45 ). Thus, if households are substituting lower-priced animal proteins for red meat, such as poultry or fish, their food spending, all other things being equal, should be lower. Future work can use demand system analysis to assess how substituting red meat for other animal proteins impacts household food budgets.
Households with the lowest level of red meat spending as a share of the total food budget purchased fewer kilojoules and the highest level of dietary fibre compared with households purchasing more red meat. Conversely, the highest level of red meat spending as a share of the total food budget was associated with lower levels of Ca, vitamin B12 and dietary folate purchased. Interestingly, increased red meat spending share was not associated with higher levels of Fe purchases. This was an unexpected finding. One potential explanation is that households who spend less of their food budget on red meat substitute it for other Fe-rich animal proteins such as poultry or seafood. Additional studies should consider the nutritional and climate implications of substituting red meat for other animal protein or other foods.
Only a substantial reduction in red meat spending as a share of the total household food budget was associated with lower GHGE from food spending. Why GHGE were not lower for households in the middle quintiles requires further research. One possible explanation is that households who purchase only moderate levels of red meat buy more dairy foods and other non-red meat animal proteins such as poultry and seafood. Results presented in Table 4 confirm that households in Q5 had a lower dairy HEI-2010 component score compared with households in Q1–Q4, indicating that they purchased fewer dairy products. Dairy foods have a higher EIF compared with all other foods except red meat and have been found to generate substantial GHGE in prior life-cycle assessment studies( Reference Heller and Keoleian 46 ). Additionally, a recent study in France found that dietary substitutions to dairy from red meat resulted in only small GHGE reductions( Reference Vieux, Darmon and Touazi 47 ). Given these results, substitution of red meat for other animal protein foods, especially dairy, may not contribute to lower GHGE from US food purchases or diets. Additional US-based studies can investigate in more detail how GHGE vary depending upon the mixture of animal proteins consumers purchase or consume as substitutes for red meat.
Overall results indicate that substantially lower red meat spending does not adversely impact household food purchase nutritional quality or affordability, but does result in lower GHGE. This finding could be beneficial for US consumers who have already been moving away from red meat over the last three decades. Per capita availability of beef has hit a 30-year low, while per capita availability of chicken has increased and pork has remained steady( 48 ). However, more recent data indicate that availability of beef was reported to be 51·5 lb (23·4 kg) per person per year in 2014 and demand forecasting predicts beef and pork consumption to rebound into 2025( Reference Bentley 49 , Reference Badau 50 ).
Policy could also play a role in reducing consumer demand for red meat. Red meat was mentioned as a food group to limit in the 2015–2020 Dietary Guidelines Advisory Committee’s Scientific Report, but not the DGA released to the public( 51 ). Results in the current analysis indicate an opportunity for US households to align with both DGA and the Advisory Committee’s recommendations by reducing their levels of red meat spending. If policy makers seek to further reduce red meat consumption as a method for reducing GHGE, then additional policy levers to do this include more explicit DGA recommendations for reducing red meat consumption when the guidelines are next revised, taxing red meats, altering federal checkoff programmes that promote red meat, and increasing nutrition education on the health and environmental benefits of reducing red meat consumption.
The present study has limitations that warrant discussion. It used a unidirectional approach to evaluate the relationship between GHGE, affordability and nutritional quality of US household food purchases, even though sustainable diets are a multidimensional concept. Additional research could build on these results using more sophisticated modelling approaches (i.e. linear programming) to address the multidimensionality of sustainable diets.
Outcome measures of the study were all calculated on the basis of household food expenditures, not household food consumption. Not all food purchased during a household’s FoodAPS reporting week may have been consumed in the same week. As a result, results are not necessarily generalizable to food consumption choices made by US households. However, some newer research indicates a positive correlation between the diet quality of food expenditures and what is consumed( Reference Appelhans, French and Tangney 39 ).
These analyses were conducted primarily at the household level and, as a result, food choices and characteristics of individual household members were not assessed. Future work could build on the present study by assessing how individual-level dietary or food purchasing patterns by red meat spending or consumption levels correlate with GHGE, food spending and diet quality. Analysis at the individual consumer level would allow for a direct linkage between diet quality and GHGE generated by food purchasing or consumption to health outcomes or risk factors for diet-related chronic diseases.
Another limitation of the present study was that only a small number of households reported following a vegetarian or vegan dietary pattern. During FoodAPS interviews, PR reported socio-economic and demographic characteristics of the household. In this interview the household PR was asked ‘Is any household member a vegetarian?’ Only 5·47 % (n 262) of FoodAPS households reported ‘yes’ to this question. Household PR were not asked about how many vegetarians were in the household, so we cannot ascertain if the entire household or a fraction of it was vegetarian or vegan based on available data. Future research could compare GHGE, food spending and diet quality for vegetarian and non-vegetarian consumers. However, according to a recent national survey, only 3·3 % of the US population is vegetarian( Reference Melina, Craig and Levin 52 ).
Another limitation was the method used to calculate the cost of red meat in multi-ingredient foods, which assumed that red meat costs the same as other ingredients in these foods (e.g. vegetables, grains). Consequently, the red meat spending share quintiles constructed for the present study may over- or underestimate the true amount of spending on red meat depending on the price of red meat relative to the price of other foods in multi-ingredient items. However, total spending on multi-ingredient foods represented a small share of total foods purchased (5·7 %), so this issue may be relatively limited.
Environmentally extended input–output life-cycle assessment (EEIO-LCA) models, like the one used in the present study, suffer from other limitations that warrant discussion. One such limitation is the aggregation bias present in EEIO-LCA models( Reference Lenzen 53 ). Aggregation bias occurs because all household food purchases and acquisitions were categorized into one of the twenty-six agricultural or food manufacturing industries in the US economy for the purpose of calculating their GHGE. This assumes that the emissions intensity (on a per dollar basis) does not vary across foods produced within one of these industries. However, GHGE generated by the production of individual foods categorized into each of these twenty-six industries may vary substantially. For example, the EIF for beef and pork are the same in the current analysis, even though GHGE profiles for these foods vary substantially in food-specific life-cycle assessments( Reference Hamerschlag 6 ).
Prior research has also noted that food prices can affect the precision of environmental impacts estimation using EEIO-LCA( Reference Jones and Kammen 54 , Reference Weisz and Duchin 55 ). For example, some households might spend more of their food budget on more expensive red meat products, even if these households are not purchasing more meat in physical units (i.e. lb or kg). These price differences would affect the estimated GHGE generated by red meats. Future work could examine GHGE impact of red meat spending levels, controlling for red meat prices or quality measures, using a more complex modelling approach than that employed in the present study. Studies are also needed to delineate the GHGE impact of purchasing or consuming processed and unprocessed versions of red meat. This is especially important in the light of a recent report by the WHO that found processed red meat products to be carcinogenic( 16 ). Another limitation of the present study is that, for calculating GHGE from foods, it was assumed that all foods were produced by US-based industries. However, in 2012–2013 (the year during which FoodAPS data were collected from households), 7·3 % of the US food supply was imported( Reference Boehm, Wilde and Ver Ploeg 3 , Reference Behrens, Jong and Bosker 56 , 57 ). As a result, any differences in emissions intensity of domestic and non-US based industries would likely have a limited influence on the present results.
Other limitations of the current study include that it was cross-sectional, only providing information about associations, not causality. Variation in bioavailability of nutrients across different foods or red meats purchased or acquired by households was not addressed. The GHGE generated by food waste at the consumer level or upstream in the food supply chain were excluded from these analyses.
The present study provides additional evidence on whether or not public health nutrition and climate change mitigation goals can be aligned in a way that does not impact food affordability for the US population. Only substantial reductions in red meat spending by US households appear to have the potential to mitigate food system GHGE and improve diet quality without increasing household food spending. How to create such a large shift in US consumer demand for red meat is an area of future work. Further research using more sophisticated analytical techniques and accounting for substitution towards non-red meat animal proteins is needed, especially in the US context. Nevertheless, the study’s results add to the scientific base on sustainable diets and can be utilized by nutrition policy makers involved in the formation of the upcoming 2020–2025 DGA.
Acknowledgements
Financial support: This work was supported by the Friedman Family Foundation and the Tufts Institute of the Environment Graduate Fellowship. These funders had no role in the design, analysis, or writing of the article. This research was also supported in part by the intramural research programme of the US Department of Agriculture Economic Research Service, which has a mandatory disclosure statement as follows: ‘The study findings and conclusions are preliminary and have not been formally disseminated by the US Department of Agriculture and should not be construed to represent any Agency determination or policy’. Conflict of interest: None. Authorship: R.B. was affiliated with Tufts University, Boston, MA, USA, at the time the study was initiated. R.B. conceptualized the study; cleaned, coded and performed statistical analyses; wrote the first and subsequent manuscript drafts; and finalized final manuscript for submission. M.V.P., S.B.C. and P.E.W. provided essential materials, comments and input on research design, statistical analysis and manuscript drafts. All authors reviewed and approved the final manuscript prior to submission. Ethics of human subject participation: All study procedures were approved by both Tufts University and University of Connecticut Institutional Review Boards.
Supplementary material
To view supplementary material for this article, please visit https://doi.org/10.1017/S136898001800407X


