


In pursuit of the UN Sustainable Development Goal to end hunger, monitoring the prevalence of food insecurity and identifying and studying the underlying drivers and consequences are vital to informing policy, strategies and programs(1,Reference Hendriks, van der Merwe and Ngidi2) . The concept of food security was first defined in 1974. Since then, it has evolved from primarily focusing on food availability to being defined as ‘physical, social, and economic access to sufficient, safe and nutritious food to meet dietary needs and food preferences for an active and healthy life by all people at all times’(Reference Pieters, Vandeplas and Guariso3,Reference Coates4) . This widely accepted FAO definition recognizes four dimensions of food security: food availability, access, utilization and stability(Reference Coates4,5) . Since the 1970s, food security has become differentiated not just at the global, regional and community levels, but eventually also at the household and individual levels, and revisions of the definition have come to include concepts of chronic and transitional food insecurity and, recently, human rights and ethics(5). The modern concept of food security is thus a complex, non-material construct for which no single objective benchmark exists(Reference Coates4,Reference Jones, Ngure and Pelto6,Reference Leroy, Ruel and Frongillo7) . Many metrics have been developed to measure food security at different levels, but evidence shows that they may not all assess the same construct. Rather, each focuses on one or more of the four dimensions(Reference Coates4,Reference Jones, Ngure and Pelto6,Reference Leroy, Ruel and Frongillo7) . There is growing recognition that no single existing metric fully captures the intricacies of food security nor accounts for all determinants and sub-domains of food security in each context where it is applied(Reference Coates4,Reference Jones, Ngure and Pelto6–Reference Cafiero, Melgar-Quiñonez and Ballard10) . Moreover, the evidence for validity and reliability of some metrics is not always clear(Reference Cafiero, Melgar-Quiñonez and Ballard10). These shortcomings complicate the measurement and interpretation of the role of food security at the household and individual level(Reference Hendriks, van der Merwe and Ngidi2,Reference Coates4) as drivers of malnutrition in countries like South Africa, where the prevalence of malnutrition in all its forms remains high(Reference May, Witten and Lake11). The 2022 Global Nutrition Report notes that 21·4 % of children under 5 years of age are stunted, while 3·4 % are wasted and 11·6 % are overweight. In adults, 42·9 % of women and 18·2 % of men are classified as obese(12).
A distinction is made between direct and indirect metrics to measure food access at the household level(Reference Jones, Ngure and Pelto6). While indirect metrics rely on ‘second-generation’ indicators like household income and expenditure(Reference Jones, Ngure and Pelto6,Reference Labadarios, Davids and Mchiza13) , direct metrics use ‘third-generation’ indicators based on the paradigm that food insecurity is a quantifiable experience that can be described and analyzed(Reference Swindale and Bilinsky14). Metrics were thus developed to reflect experiences related to household-level food access at different levels of food security. This development was based on research findings in the early 1990s that women, as primary caregivers in their households, see hunger as a ‘managed process’ and develop coping mechanisms that protect the children, often at the cost of their own nutrition, causing women and children in a household to experience different components of hunger at different times and to different degrees(Reference Radimer, Olson and Greene15,Reference Radimer, Olson and Campbell16) . The experience-based metrics measure four constructs on the household and individual levels(Reference Cafiero, Melgar-Quiñonez and Ballard10,Reference Swindale and Bilinsky14–Reference Radimer, Olson and Campbell16) . The first is a quantitative aspect of insufficient food indicated by food depletion in the household and perceived insufficient intake by individuals(Reference Cafiero, Melgar-Quiñonez and Ballard10,Reference Radimer, Olson and Greene15) . The second construct is a qualitative aspect that encompasses types and diversity of food indicated by perceived unsuitable food acquired by the household and nutritional inadequacy for the individuals(Reference Cafiero, Melgar-Quiñonez and Ballard10,Reference Radimer, Olson and Greene15) . Food quality is generally affected at the individual level before quantity(Reference Jones, Ngure and Pelto6,Reference Labadarios, Davids and Mchiza13) . The third construct is a psychological element as food insecurity, characterized by anxiety in the household over whether the food budget and amount and types of food available in the home would be sufficient to meet basic needs, and emotions of deprivation or limited choice for individuals(Reference Cafiero, Melgar-Quiñonez and Ballard10,Reference Radimer, Olson and Greene15) . These elements cause households to devise coping mechanisms to manage the situation(Reference Radimer, Olson and Greene15). The fourth is a social or normative aspect by which individuals in the household evaluate their (and their children’s) food situation in relation to generally accepted social norms, such as eating three meals a day or the household being able to purchase food without resorting to socially unacceptable behavior such as begging, relying on charity, scavenging or stealing food(Reference Cafiero, Melgar-Quiñonez and Ballard10,Reference Swindale and Bilinsky14–Reference Radimer, Olson and Campbell16) . Food security is thus viewed as a spectrum of experiences ranging from starving to complete food security, which is described as a situation in which all the FAO (1996) criteria for food security are met, and there is no concern about future food supply, availability, and affordability to meet these criteria(Reference Hendriks, van der Merwe and Ngidi2). Experience-based metrics include the Community Childhood Hunger Identification Project (CCHIP) index, the US Household Food Security Survey Module (HFSSM), the Household Food Insecurity Assessment Score (HFIAS), the Household Hunger Scale (HHS), and the Food Insecurity Experience Score (FIES) and provide an assessment of food security that is directly related to the widely accepted FAO definition and have been validated and proven reliable across countries(Reference Cafiero, Melgar-Quiñonez and Ballard10,Reference Swindale and Bilinsky14–Reference Radimer, Olson and Campbell16) . It could be argued that so-called consumption-based metrics, like the Household Dietary Diversity Score (HDDS) and the Food Consumption Score (FCS), are also more direct measures of food security(Reference Cafiero, Melgar-Quiñonez and Ballard10). However, concern has been raised that, although they are useful in combination with other metrics, they lack a clear model linking them to food security, which has prevented establishing their validity as food access metrics at the household level(Reference Cafiero, Melgar-Quiñonez and Ballard10). Despite the conceptual differences between metrics to assess household food security, users often apply them interchangeably(Reference Hendriks, van der Merwe and Ngidi2,Reference Cafiero, Melgar-Quiñonez and Ballard10) .
South Africa is a low and middle-income country (LMIC) with nine provinces, covering 1 219 090 km and 60,14 million people in 2021(17). At the national level, South Africa is considered food-secure(18), but there is widespread agreement that household food insecurity remains a serious problem(Reference Hendriks19–Reference De Klerk, Drimie and Aliber22), emphasizing the critical need for differentiating the determinants. Several reviews had provided a comprehensive overview of household food security among adult South Africans since 1999 when the first national food security survey was conducted as part of the National Food Consumption Survey (NFCS)(Reference Hendriks19–Reference De Klerk, Drimie and Aliber22). However, not captured in previous reviews are the 2019 and 2020 General Household Surveys (GHS)(Reference Stats23) and the 2020/2021 National Income Dynamics Study’s Coronavirus Rapid Mobile Survey (NIDS-CRAM)(Reference van der Berg, Patel and Bridgman24). Furthermore, given the current debate that diverse metrics may complicate the interpretation of surveys, also in the South African context(Reference Coates4,12) , this review aimed to provide an updated overview of the prevalence of household food security recorded in South African national and sub-national studies from 1999 to 2021, with emphasis on the different metrics used and the potential implications for defining the prevalence and determinants of household food security in the country.
Methods
Electronic literature search strategy
An electronic search of the following databases was performed to identify studies and reports on food security published from 1999 until the end of 2021: EBSCOHost (Academic Search Ultimate, Africa-Wide Information, CAB Abstracts, CINAHL with Full Text, GreenFILE, Health Source – Consumer Edition, Health Source: Nursing/Academic Edition, APA PsycArticles, APA PsycInfo, Sociology Source Ultimate, MEDLINE, MasterFILE Premier); Scopus; and Web of Science. In addition, the reports of national surveys that have been undertaken since 1999 were downloaded, and additional relevant studies in reference lists of retrieved articles were also included. The overarching review was related to an assessment of nutritional status, including studies on food security and hunger, using the following search terms: South Africa* (household* or national*) and (food* or nutrition*) and (secur* or insecur* or adequa* or access* or availab* or povert*) or hunger) (food* or nutrition* or secur* or insecur* or adequa* or access* or availab* or povert* or hunger). It is possible that, despite all these efforts, there may be publications and reports with valuable information on the food security of South Africans that were not identified.
Inclusion and exclusion criteria
Reports of national surveys undertaken since 1999 and sub-national studies with data collection between 1999 and 2021 published in English in peer-reviewed journals as original articles on household food security carried out in South Africa were included in the current review. Review articles, unpublished studies or studies reported only as abstracts, studies undertaken in participants that were pregnant or lactating, had a diagnosis such as those that were HIV-infected, tuberculosis or a chronic condition (e.g. CHD, diabetes, cancer or disabled), and hospital-based studies were excluded from the review. National surveys using indirect food security metrics like the Income and Expenditure Survey (IES), Labour Force Survey (LFS) and Community Surveys Stats were excluded. Studies using dietary diversity metrics were only included if the stated intended use was to measure food security but were excluded if the primary objective was to use dietary diversity as a proxy of micronutrient intake.
Data extraction
A systematic mapping review of metrics (methodological review)(Reference Munn, Stern and Aromataris25) to assess household food security in South Africa over the reference period was conducted using the PRISMA (Preferred Reporting Items for Systematic reviews and Meta Analyses) recommendations of 2015(Reference Moher, Shamseer and Clarke26). All the study titles and relevant abstracts were read by the two authors, who agreed on the eligibility of studies for inclusion in the review. All duplicate articles were removed using Mendeley software version1.19.5/2019 (Elsevier, London). Several articles were removed after reading the title and the abstract. The remaining full-text articles were read to identify studies that met the inclusion/exclusion criteria. Studies were categorized according to the year of data collection, site (province and specific location), geographic area (rural or urban), population and sampling (gender and ethnicity of participants, and sample size). The descriptive data per variable of interest were extracted from the publications for presentation in the tables, while categorical variables were described by the percentage of subjects with values in the different categories.
Results
Study selection
We identified a total of 715 original articles in six databases. After automatic system deletion of the duplicates and further manual removal of the remaining duplicates, 332 were retained. A title and abstract-based selection resulted in the exclusion of 178 articles that were irrelevant and 118 that did not meet the inclusion criteria (twenty-two of which reviewed articles). After reading the full text of the remaining thirty-six articles, eleven additional articles and reports from their reference lists were included. Thus, forty-seven articles reporting on six national surveys and forty sub-national studies meeting the inclusion criteria were selected. The representative schema of the research and the number of eligible studies are shown in Fig. 1.
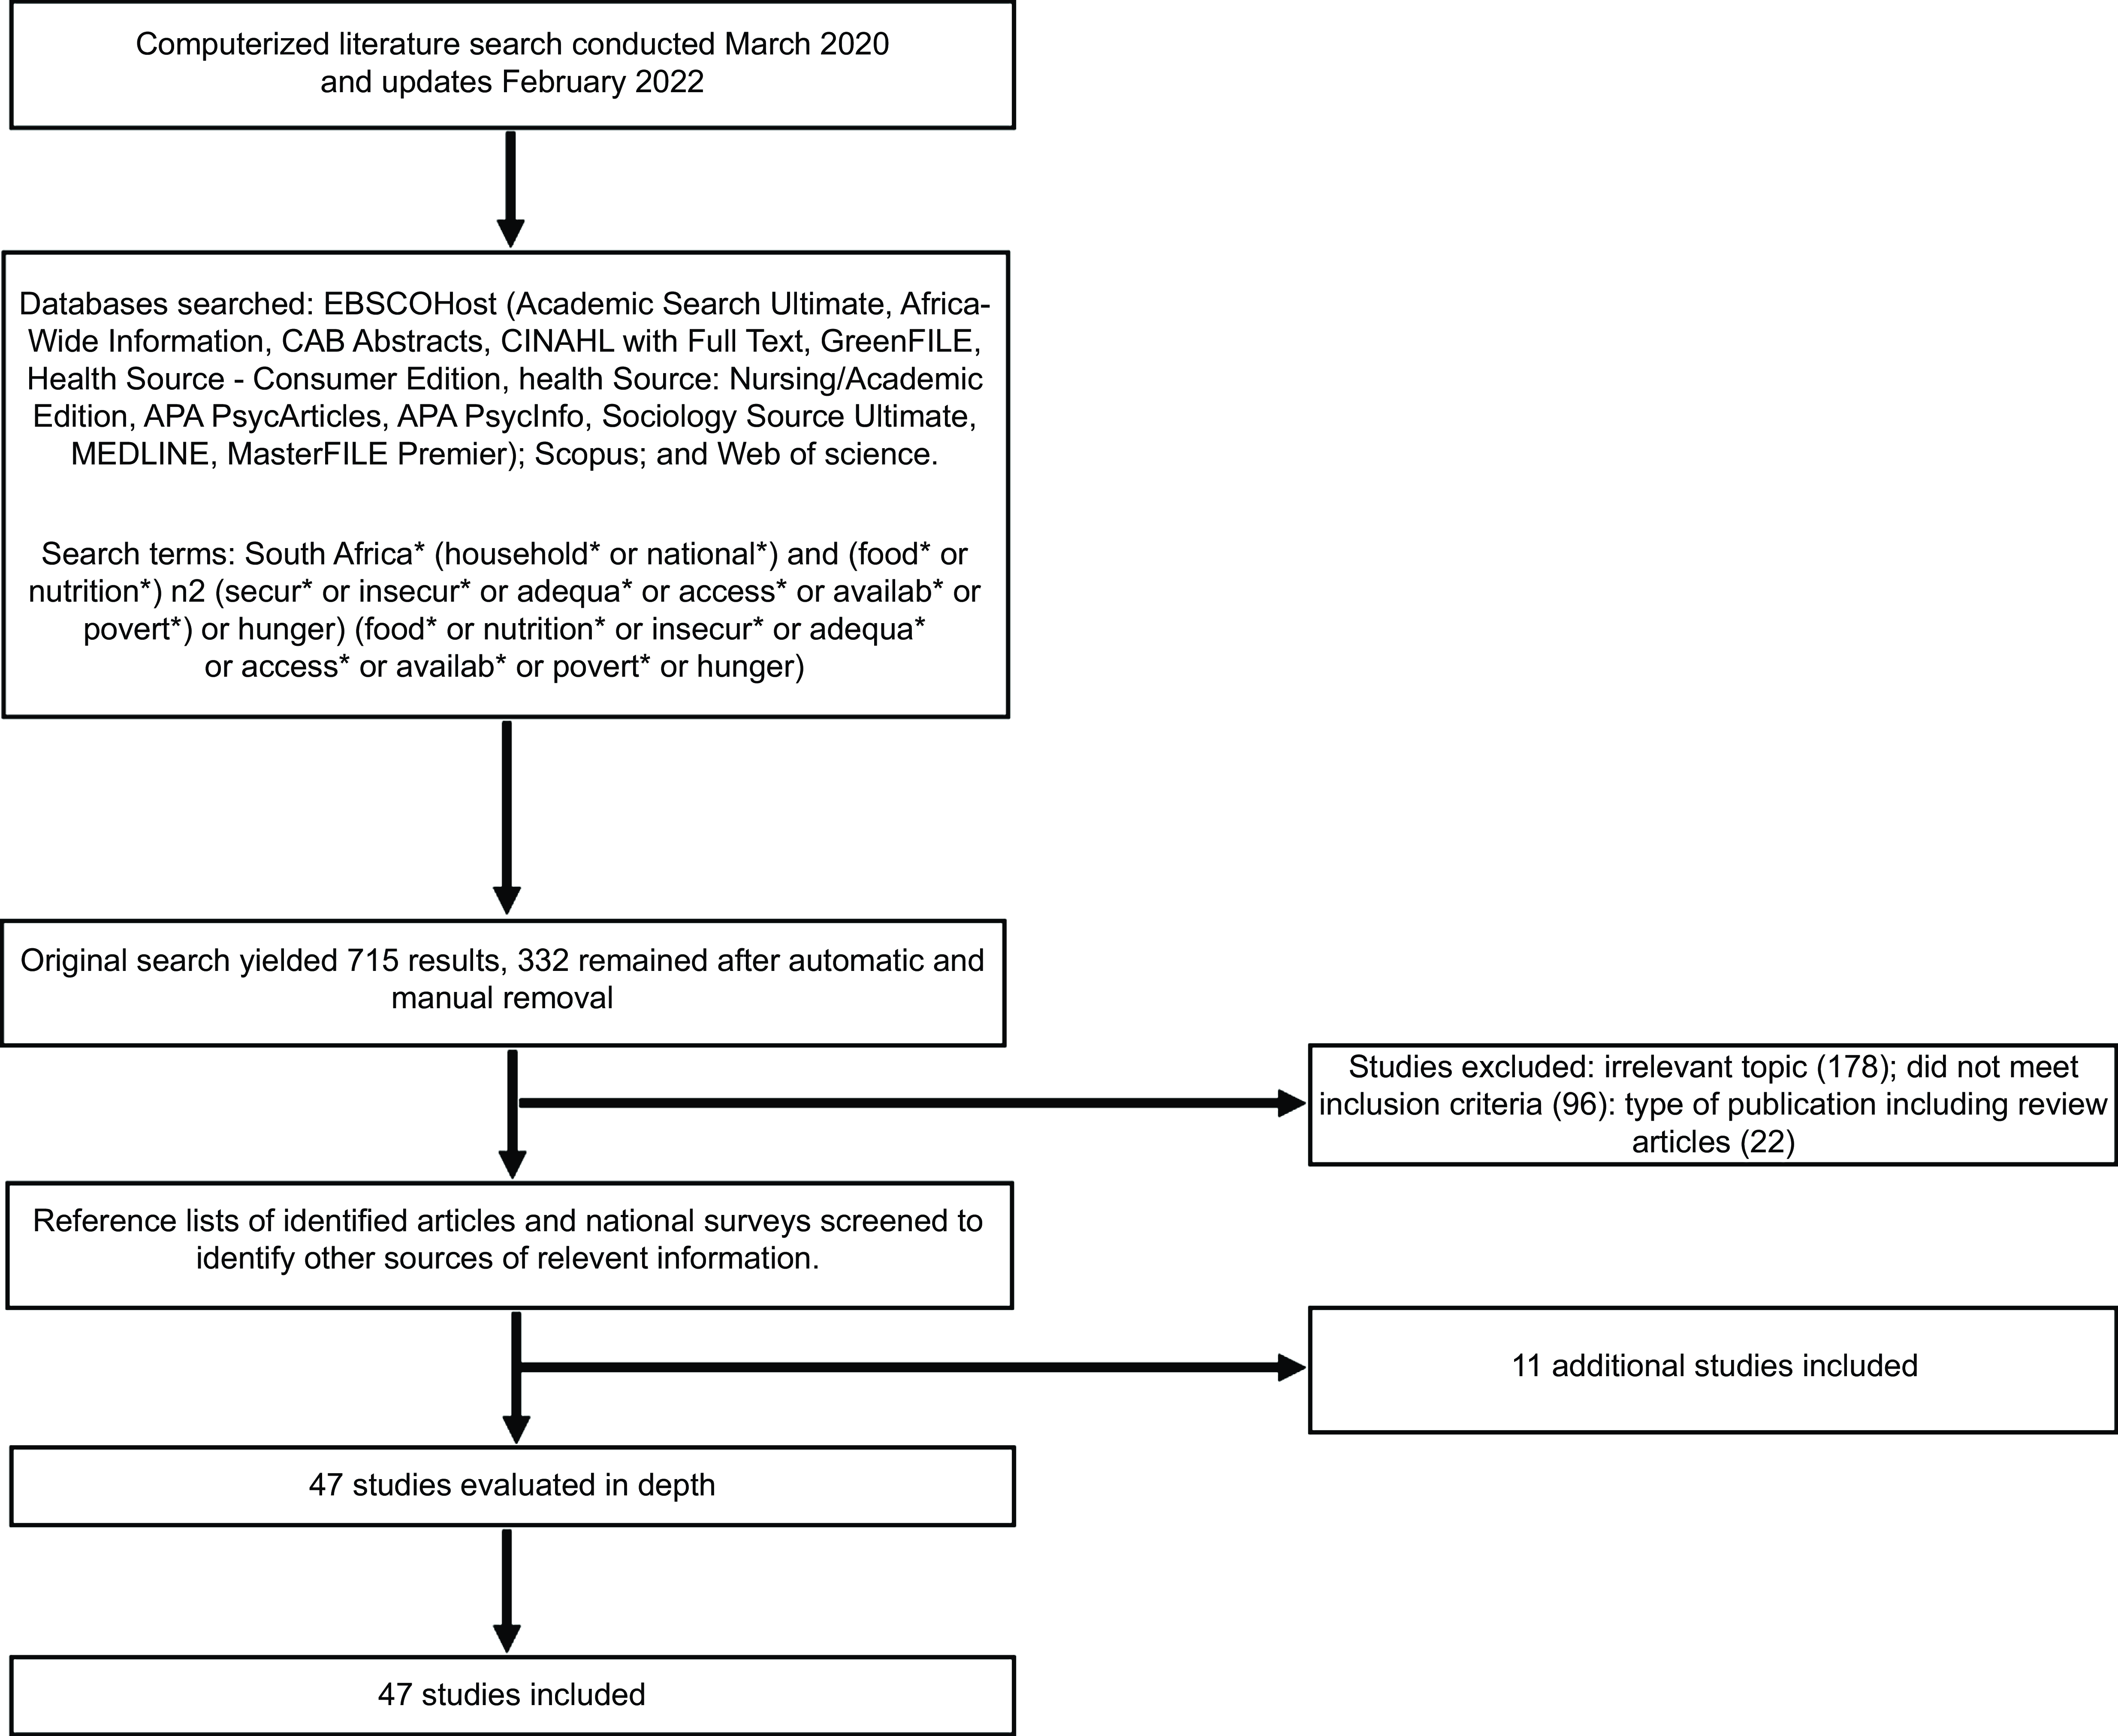
Fig. 1 Flow chart representing the search, screening and selection of studies
Metrics and prevalence of household food security in national surveys
The search parameters identified six nationally representative surveys (Table 1). Three of these, namely the 1999 National Food Consumption Survey (NFCS 1999), the National Food Consumption Survey – Fortification Baseline (NFCS-FB) and the South African National Health and Nutrition Examination Survey (SANHANES-1), used the eight-item CCHIP index to assess household food security with a recall period of 3 months(Reference Wehler, Scott and Anderson33). The NFCS 1999 reported that nationally 52 % of households ‘experienced hunger’ (extreme food insecurity), while 23 % were ‘at risk of hunger’. More households in rural areas (62 %) than urban areas (42 %) reported experiencing hunger. Moreover, hunger was more prevalent in informal urban (61 %) and informal rural areas (66 %) compared to formal urban (37 %) and formal rural (48 %)(Reference Ladadarios, Steyn and Maunder29). The NFCS-FB, undertaken 6 years later(Reference Labadarios, Swart and Maunder30), found a similar national prevalence of household hunger as the NFCS 1999, with 51·6 % experiencing hunger and 28·2 % at risk of hunger(Reference Labadarios, Swart and Maunder30). However, the percentage of participants that experienced hunger in informal rural areas had increased from 48 %(Reference Ladadarios, Steyn and Maunder29) to 58 %(Reference Labadarios, Swart and Maunder30).
Table 1 National surveys of household food security status of South African adults (1999–2021)
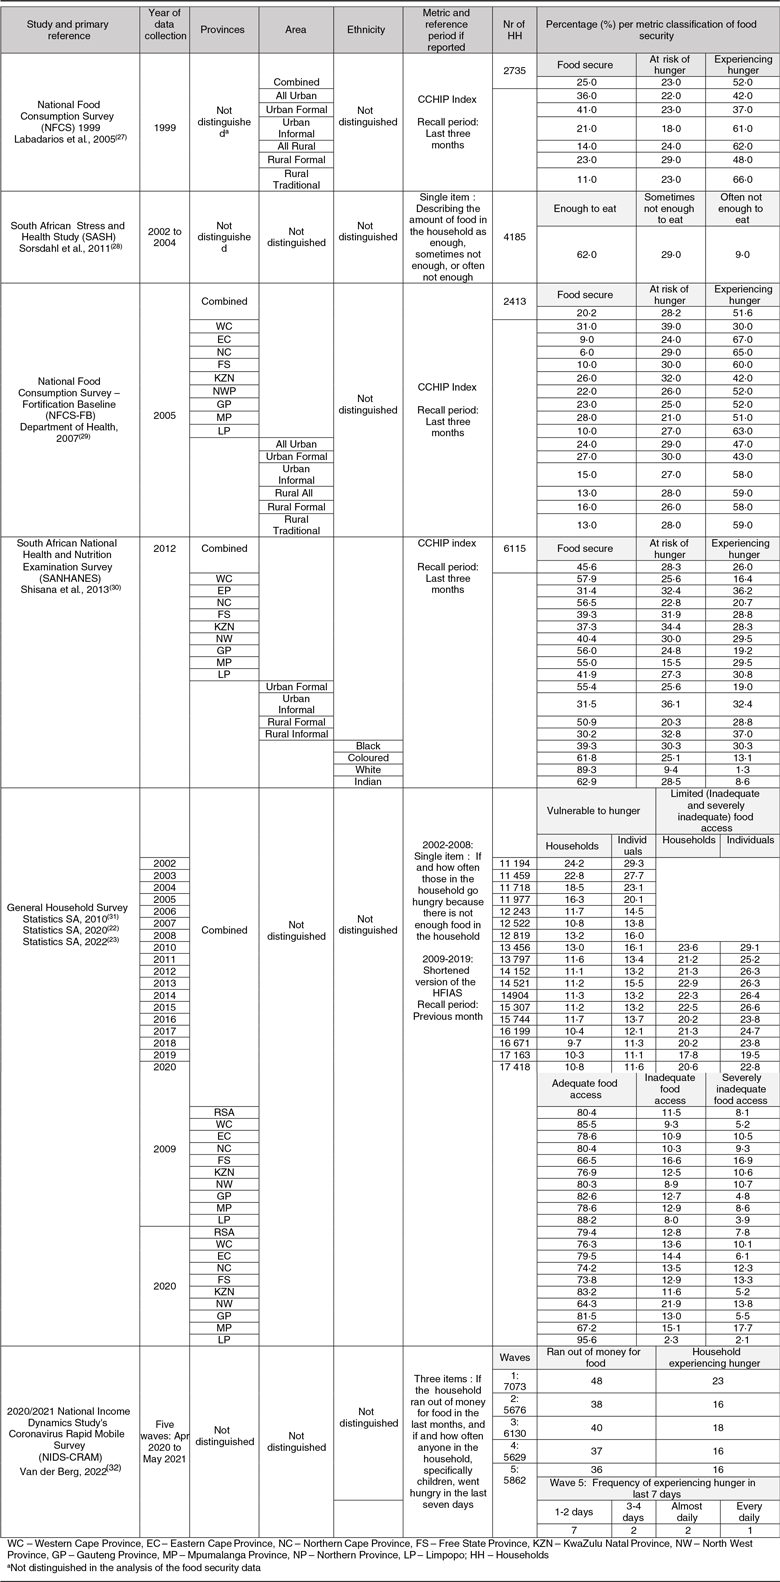
The SANHANES-1 followed in 2012(Reference Shisana, Labadarios and Rehle34); by this time, the national prevalence of households experiencing hunger had decreased to 26·0 %, with 28·3% still at risk of hunger. The prevalence of food insecurity had dropped in formal and informal urban areas and formal rural areas but had increased to 37% in informal rural areas. The prevalence of hunger remained higher in rural compared to urban areas and in informal areas compared to formal areas(Reference Shisana, Labadarios and Rehle34). Data were also analysed according to ethnicity, showing that the highest prevalence of hunger occurred in South African households of Black Africans (30·3%) and those of mixed ethnic origin (referred to as Coloureds by Statistics South Africa) (13·1%), followed by Indians (8·6%), while only 1·3% of White households experienced hunger. A comparison between the provincial data from the NFCS-FB (2005) and SANHANES (2012) shows that hunger declined in all nine provinces over the 7 years between the surveys, which agrees with the decline in multidimensional poverty in the country over the same time frame(Reference Stats28). Hunger remained most prevalent in the Eastern Cape (2005: 67% v. 2012: 36·2%) and least prevalent in the Western Cape (2005: 30% v. 2012: 6·4%). A decline in food insecurity was most pronounced in the Northern Cape (2005: 65% v. 2012:20·7%), followed by Gauteng Province (2005: 52% v. 2012:19·2%).
Other nationally representative surveys that collected data on household food security included the South African Stress and Health Study (SASH), the South African GHS and, most recently, the 2020/2021 NIDS-CRAM. SASH collected data from 2002 to 2004 using a single question to assess food access (‘Which of the following describes the amount of food your household has to eat: enough to eat, sometimes not enough to eat, or often not enough to eat?’)(Reference Sorsdahl, Slopen and Siefert35). The recall period is not reported but was presumably the last 12 months, as the other metrics in the survey used this reference period(Reference Williams, Herman and Kessler32). SASH reported that 38 % of households ‘sometimes’ or ‘often’ did not have ‘enough to eat’.
The GHS has been conducted annually since 2002. Until 2008, it included only one question to assess hunger (‘How often do adults and children go to bed hungry because there is not enough food in the household’). From 2009 onwards, a shortened version of the HFIAS was added to capture food access, with the last month as the recall period. The GHS single-question metric indicates that the percentage of households ‘vulnerable to hunger’ decreased from 24·2 % in 2002 to 11·8 % in 2020. The HFIAS showed that the percentage of households that had ‘inadequate’ and ‘severely inadequate access’ (pooled for reporting purposes as ‘limited access’) to food decreased from 26·3 % in 2010 to 17·8 % in 2019 and then rose again to 20·6 % in 2020(Reference Stats23). The GHS has tracked provincial food access since 2009. From 2009 to 2020, the prevalence of severely inadequate food access decreased in four provinces: KwaZulu Natal, Eastern Cape, Free State and Limpopo Provinces, but increased in the other five provinces, most markedly in Mpumalanga. Food security data and overlapping time points between the NFCS (1999), NFCS-FB (2005), SANHANES (2012) and the GHS data are summarised in Table 2.
Table 2 Comparison of reported food security prevalence (%) at overlapping time points in South African national surveys (1999–2021)
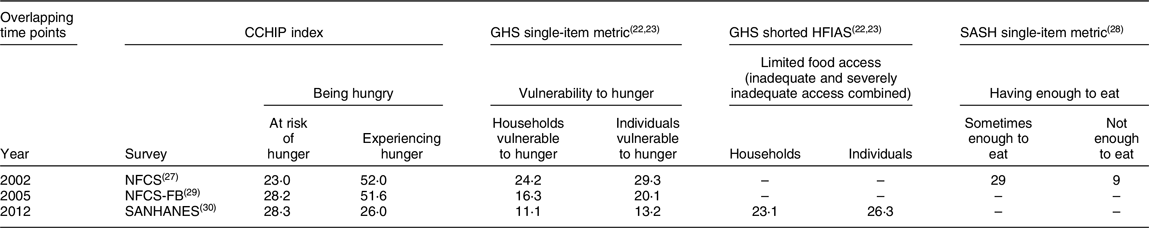
CCHIP, Community Childhood Hunger Identification Project; GHS, General Household Survey; HFIAS, Household Food Insecurity Assessment Score; SASH, South African Stress and Health Study; NFCS, National Food Consumption Survey; NFCS-FB, National Food Consumption Survey – Fortification Baseline; RSA, Republic of South Africa; SANHANES, South African National Health and Nutrition Examination Survey.
Finally, the NIDS-CRAM was conducted in five waves of data collection from March 2020, when a national lockdown was mandated in response to the international coronavirus pandemic, until May 2021 to assess the impact of the pandemic on household food security. The NIDS-CRAM used three items, one related to food access, asking if the household ran out of money for food in the last month, and two asking if anyone in the household, including children, went hungry in the last 7 days and how often, reporting the results in these terms instead of using scoring scales(Reference van der Berg, Patel and Bridgman36). The survey found that food access improved over the five waves, from 48 % of households running out of money for food in March 2020 to 36 % in May 2021. The number of individuals that went hungry initially dropped from the first wave (23 %) to the second wave (16 %) but then stabilized at that level. In wave 5, with data collection in April/May 2021, 3 % of adults reported experiencing hunger daily or almost daily in the last week.
Metrics and prevalence of household food security in sub-national surveys
Thirty six sub-national studies fit the inclusion criteria (excluding four studies focused on students in higher education). These studies (Table 3) used a variety of metrics: HSFIAS (n 16)(Reference Oldewage-Theron, Duvenage and Egal44,Reference Nawrotzki, Robson and Gutilla46,Reference Baiyegunhi, Oppong and Senyolo48–Reference Chakona and Shackleton50,Reference Cheteni, Khamfula and Mah52,Reference Naicker, Venter and MacIntyre55,Reference Walsh and van Rooyen56,Reference Crush and Caesar59–Reference Faber, Schwabe and Drimie61,Reference Kruger, Schönfeldt and Owen63,Reference Oduniyi and Tekana66,Reference Musemwa, Muchenje and Mushunje67,Reference Naicker, Mathee and Teare69,Reference Omotayo and Aremu70) , CCHIP (n 2)(Reference Oldewage-Theron, Dicks and Napier41,Reference Horwood, Haskins and Hinton58) ; Cornell Hunger Scale (n 2)(Reference Kendall, Olson and Frongillo42,Reference Ningi, Taruvinga and Zhou43,Reference Kassier and Veldman71) ; HHS (n 3)(Reference Hendriks, van der Merwe and Ngidi2,Reference Faber, Wenhold and Laurie40,Reference Sinyolo, Mudhara and Wale62) ; and Household Food Insecurity Access Prevalence (HFIAP) (n 1)(Reference Naicker, Mathee and Teare69); single-item (n 3)(Reference Saha, Abu and Oldewage-Theron45,Reference Masekoameng and Maliwichi47,Reference Akinboade and Adeyefa57) or two-item metrics (n 1)(Reference Musemwa, Zhou and Ndhleve38); Food-Coping Strategy Index (n 1)(Reference De Cock, D’Haese and Vink65); Coping Strategies Index (CSI) (n 2)(Reference Hendriks, van der Merwe and Ngidi2,Reference Walsh and van Rooyen56) ; FCS (n 3)(Reference Hendriks, van der Merwe and Ngidi2,Reference Hunter-Adams, Battersby and Oni54,Reference De Cock, D’Haese and Vink65) ; HDDS (n 1)(Reference Hunter-Adams, Battersby and Oni54); Modified Complex Access to Food (mCAF) score (n 1)(Reference Hendriks, van der Merwe and Ngidi2); Months of Adequate Household Food Provisioning (MAHFP) (n 2)(Reference Walsh and van Rooyen56,Reference Musemwa, Muchenje and Mushunje67) ; months of food shortages (n 1)(Reference Kruger, Schönfeldt and Owen63); food access based on a composite econometric model (n 1)(Reference Jesson, Dietrich and Beksinska39); Household Food Intake Index developed from principal component analysis (n 1)(Reference Shisanya and Mafongoya53); low energy availability (n 1)(Reference Musemwa, Muchenje and Mushunje67); household food accessibility based on per capita energy intakes (n 3)(Reference Shisanya and Mafongoya53,Reference Eaton, Cain and Pitpitan64) , including the Food Poverty Index (FPI) (n 1)(Reference Musemwa, Muchenje and Mushunje67); and household food accessibility based on household food expenditure (n 2)(Reference Ndobo and Sekhampu68,Reference Rudolph, Kroll and Muchesa72) . Recall periods varied according to the metric and included 1 year, 30 d, 1 month, 7 d, 5 d and 24 h. Prevalence of food security was reported using a wide variety of scoring systems reported as mean scores or in categories using an array of terminology.
Table 3 Published sub-national studies of household food security status of South African adults (1999–2021)
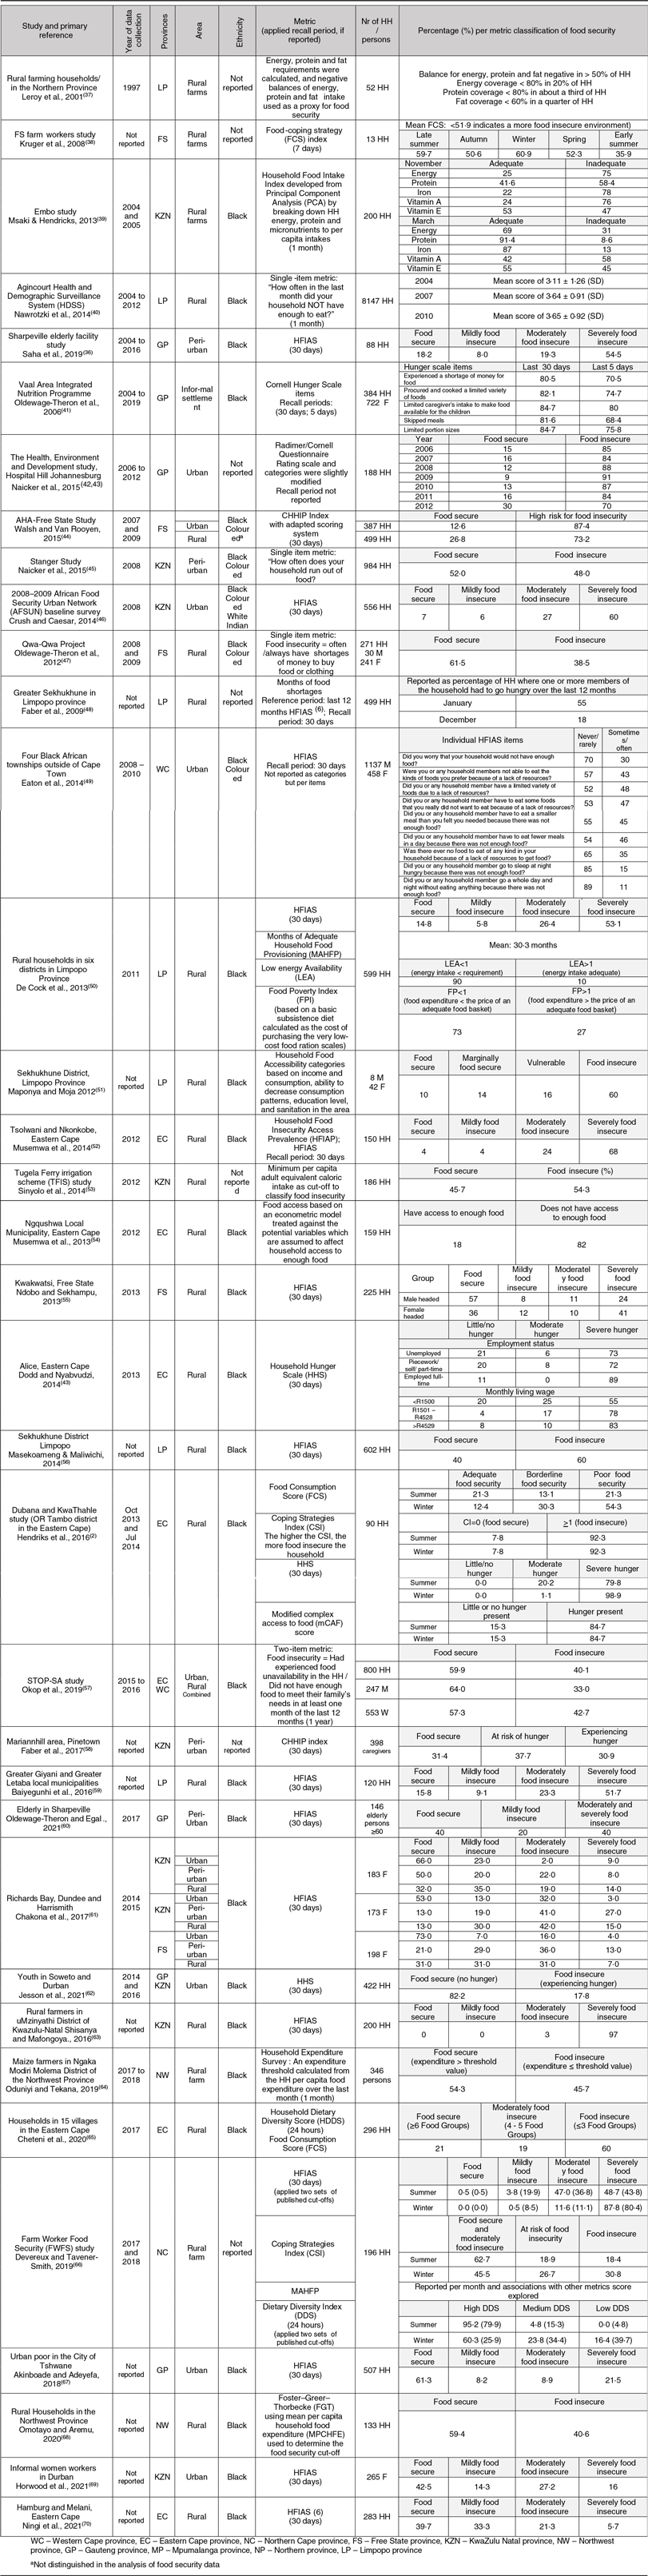
As summarised in Table 3, most of the included sub-national studies were conducted in rural areas (n 27), while thirteen studies recorded data in urban areas (five in peri-urban areas). The prevalence of severe food security ranged from 3 % to 97 % depending on the metric used and was consistently higher in rural areas compared to urban areas across studies and within studies that used the same metrics. Nine studies collected data in KwaZulu Natal province, seven in the Eastern Cape province, six in Gauteng province, seven in Limpopo province, five in the Free State province, two in Northwest province, one in the Northern Cape Province, one in the Western Cape province and none in Mpumalanga province. Studies included mostly only Black participants, with five studies including Coloured participants and only one study also including White and Indian participants. Six studies did not report ethnicity. Food security was almost exclusively reported per household, with women mostly being the interviewees. None of the studies reported food security per individual in the household, and only one focused specifically on elderly individuals, finding that 54·5 % of participants ≥ 60 years (Black, from a peri-urban area in Gauteng province) were severely food-insecure, and none had high food security(Reference Chakona and Shackleton50).
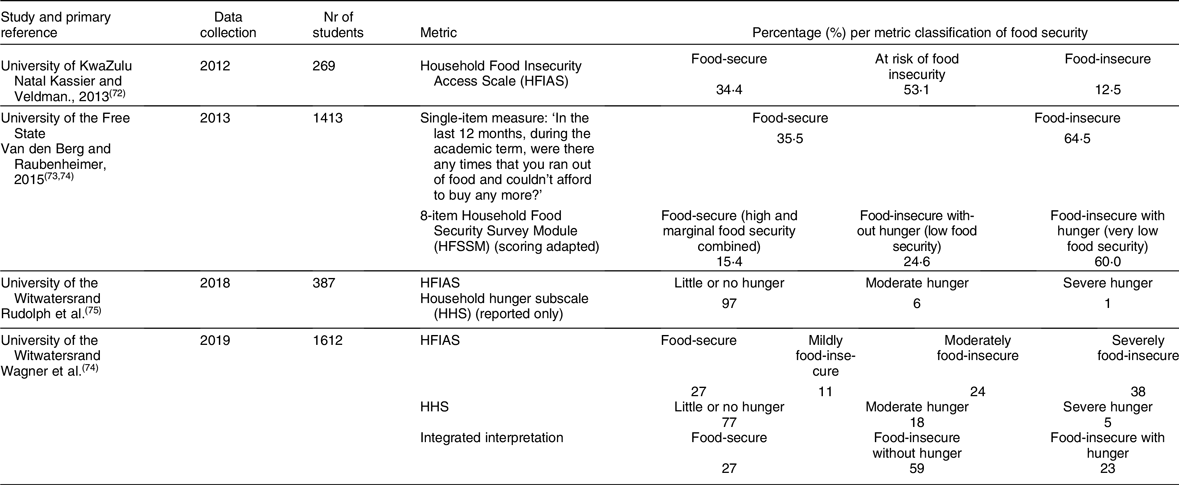
Four studies reported on the prevalence of food security among South African university students (Table 4), adapting the wording of the metrics to apply to students. However, most of these manuscripts did not indicate how this was done or which reference periods were used. In 2012, using the HFIAS, 12·5 % of students at the University of KwaZulu Natal (UKZN) receiving government aid to support their studies were classified as food-insecure and 53·1 % at risk of food insecurity(Reference Van den Berg and Raubenheimer73). In 2013, a single-item metric and the eight-item HFSSM were used to collect data on a representative sample of all students registered at the University of the Free State (UFS). The reference period was defined as the academic term while studying at the university from the beginning of the academic year to exclude university breaks when students are not studying from home and might find themselves in a different food situation. The single-item metric (‘In the last 12 months, during the academic term, were there any times that you ran out of food and couldn’t afford to buy any more?’) classified 64·5 % of students as food-insecure. For this survey, the classification system for the HFSSM was slightly adapted from the published metric, and it was reported that 24 % of respondents had marginal or low food security, and 60 % had very low food security(75). Another two surveys at the University of the Witwatersrand (WITS) in 2018(Reference Wagner, Kaneli and Masango74) and 2019(Reference Cafiero, Viviani and Nord76) used the HFIAS to assess food insecurity among students. The first(Reference Wagner, Kaneli and Masango74) reported only the HHS, finding that 1 % of students were experiencing severe hunger and 6 % were experiencing moderate hunger. The second was conducted among a representative sample of first-year students who were enrolled in 2019(Reference Cafiero, Viviani and Nord76). According to the HFIAS, 73 % of respondents in this survey were classified as food-insecure; 38 % were severely so. According to the HHS, 18 % were moderately hungry and 5 % were severely hungry. An ‘integrated’ scoring was also reported, showing that 59 % were food-insecure without hunger and 23 % were food-insecure with severe hunger.
Table 4 Published surveys of food security status of South African adult students in higher education (1997–2021)
Discussion
Assessment of food security depends to a large extent on the methodology employed. This systematic review included six national surveys (one repeated annually since 2002) and thirty-six sub-national studies reporting household food security conducted from 1999 to 2001. The wide variety of metrics and different ways of reporting the findings limit the comparability of the results to measure the scope and scale of the problem.
Regularly conducting nationally representative surveys is important for tracking changes in food security over time to guide policies, programs and strategies. Valid and comparable metrics are required to compare data over time and across populations. However, food security as a multidimensional construct is difficult to capture holistically in a single metric. Experienced-based multi-item metrics are considered more valid measures of food security than consumption-based metrics(Reference Cafiero, Melgar-Quiñonez and Ballard10) and are extensively used to track and compare global, regional and national food security. The HFSSM, based on items identified by Radimer et al. in the 1990s(Reference Radimer, Olson and Greene15,Reference Radimer, Olson and Campbell16) , has been used to track food insecurity in the USA since 1995 and Canada since 2004. Subsequently, based on the items of the HFSSM, the HFIAS was developed for tracking food access in low and middle-income countries(Reference Jones, Ngure and Pelto6). More recently, the FAO developed the FIES to establish an indicator for global monitoring of food insecurity that has been applied across countries and cultures since 2014(Reference Nikolaus, Ellison and Nickols-Richardson77,Reference Mthethwa and Wale78) . Of the nationally representative surveys that measured food security in South Africa since 1999, three used the CCHIP index, namely the NFCS of 1999(Reference Ladadarios, Steyn and Maunder29), the NFCS-FB of 2005(Reference Labadarios, Swart and Maunder30) and SANHANES-1 of 2012(Reference Shisana, Labadarios and Rehle34). The GHS started collecting annual food security data in 2002. Up to 2008, only a single-item metric was used that only asked whether the household ran out of money for food and if and how frequently they experienced hunger. From 2009 onward, a shortened version of the HFIAS was added. When the findings of the national surveys at overlapping time points (2002, 2005 and 2012) are compared (Table 2), it becomes clear that the reported prevalence, expressed as the percentage of participants that represent different levels of food insecurity, is hardly comparable, suggesting that the metrics used were not measuring the same construct of food security.
Moreover, the terminology used to describe the categories with each metric is difficult to compare. Surveys using the CCHIP reported the prevalence of food security as the percentage ‘at risk of hunger’ and ‘experiencing hunger’. The single-item measure used by the GHS reported the prevalence of those ‘vulnerable to hunger’ (the shortened version of the HSFIA used in the GHS since 2009) reported the prevalence of those with ‘limited food access’ (which combines those with ‘inadequate’ and ‘severely inadequate’ access). The single-item measure used in SASH reported the prevalence of those who ‘do not have enough to eat’. Jones et al. (2013) pointed out that many disciplines, including agriculture, economics, nutrition, public policy, anthropology and sociology, engage with food security, each contributing its jargon, so that terminology has become confusing and terms that represent different constructs are often used interchangeably(Reference Jones, Ngure and Pelto6).
Nevertheless, these three metrics showed the same trend of decreasing levels of food insecurity over the reference period, even though they may have measured slightly different food security constructs. However, this poses a problem for comparing the prevalence of food insecurity between studies using different metrics.
The difficulties incurred by the diversity of metrics and the diverse classification systems and terminology used to classify household food security are even more apparent in the sub-national surveys summarised in Table 3. Six different previously validated experienced-based metrics, namely HSFIAS, CCHIP, Cornell Hunger Scale, HHS and HFIAP, were used, with some studies adapting the scoring systems and/or reporting the prevalence of food security by combining the categories that represent the level of food security in the household, in different ways. Four studies used other single- or two-item metrics based only on the quantitative component usually represented by the first item of the other experience-based metrics.
Three studies used indexes based on the frequency and severity of the household’s coping mechanisms in the face of food insecurity(Reference Hendriks, van der Merwe and Ngidi2,Reference Walsh and van Rooyen56,Reference De Cock, D’Haese and Vink65) . These metrics were not intentionally moulded on the experienced-based metrics but attempt to capture the behaviour of individuals faced with ‘uncertainty, irreversibilities, and binding constraints on choice’(Reference Coates4), thus introducing the element of ‘perceived vulnerability’(Reference Coates4). These metrics cannot classify households along the food security continuum, and as coping strategies differ according to the study’s specific context, community engagement is necessary to establish severity levels for each strategy. While these metrics are unsuitable for comparative national surveys, they render important information for designing appropriate intervention programs(Reference Hendriks, van der Merwe and Ngidi2). Four studies used direct metrics of household food security that can be classified as consumption-based metrics, namely the FCS(Reference Hendriks, van der Merwe and Ngidi2,Reference Hunter-Adams, Battersby and Oni54,Reference De Cock, D’Haese and Vink65) and the HDDS(Reference Jesson, Dietrich and Beksinska39), which attempt to define a concept of food consumption that would reflect both quantity and quality(Reference Leroy, Ruel and Frongillo7,Reference Cafiero, Melgar-Quiñonez and Ballard10) . Variety is a key element of high-quality diets. However, while dietary diversity scores may be significantly associated with food insecurity in the South African context(Reference Kruger, Schönfeldt and Owen63), it is not clear to what extent dietary diversity consistently reflects differences in the food security status of households or individuals(Reference Cafiero, Melgar-Quiñonez and Ballard10). Thus, it is recommended that dietary diversity scores should be used in combination with other food security measures(Reference Hendriks, van der Merwe and Ngidi2,Reference Jones, Ngure and Pelto6,Reference Leroy, Ruel and Frongillo7) . Several other metrics used in the sub-national studies focus on how long the household had experienced limited access to food, including the mCAF score(Reference Hendriks, van der Merwe and Ngidi2), MAHFP(Reference Walsh and van Rooyen56,Reference Musemwa, Muchenje and Mushunje67) and months of food shortages(Reference Kruger, Schönfeldt and Owen63). Lastly, several metrics focused on food access based on meeting per capita energy requirements(Reference Jesson, Dietrich and Beksinska39,Reference Shisanya and Mafongoya53,Reference Eaton, Cain and Pitpitan64,Reference Musemwa, Muchenje and Mushunje67) or on how much a household can spend on food(Reference Ndobo and Sekhampu68,Reference Rudolph, Kroll and Muchesa72) . These metrics measure very different constructs compared to the HSFIAS, CHHIP, Cornell Hunger Scale and HHS.
Notably, even the experience-based metrics, which were designed not only to capture the quantitative aspects of food access but also the psychological and normative aspects embodied in the FAO definition of food security, have limitations when considered in the context of the various national surveys and sub-national studies included in this review. The interviewee in almost all of the included studies portraying household food security research over the last two decades was a single female representing the household. Hendriks et al.(Reference Hendriks, van der Merwe and Ngidi2) note that ‘the experience of hunger is not universal and perception of what constitutes being hungry differs according to context, culture, and experience’. Concerns have been raised that the experience-based metrics (used in all of the national surveys and most of the sub-national studies included in the current review) were developed based on research by Radimer et al. in the 1990s(Reference Radimer, Olson and Greene15,Reference Radimer, Olson and Campbell16) on the perceptions of women in the household. Radimer et al. (1992)(Reference Radimer, Olson and Greene15,Reference Radimer, Olson and Campbell16) pointed out that the metric was standardized on women and that application to men and the elderly would need further investigation, but no progress has been made in this regard. A case in point is the measurement of food security among students in higher education, which has become a global issue. The most widely used metric for assessing food insecurity among students globally is the HFSSM. However, cognitive interviewing with US students recently found that they interpreted key terms, such as ‘money for more’, ‘balanced meals’ and ‘real hunger’, differently from theoretical dimensions(Reference Wills, Patel and van der Berg79). South African studies of student food insecurity have used the HFSSM and the HFIAS (Table 4), but as these two metrics share similar terminology, they would likely incur the same problems when assessing students.
A household is considered food-insecure when it contains one or more food-insecure individuals. At the same time, though, various authors argue that a single individual respondent cannot accurately represent the experience of others in their household in an interview(Reference Coates4,Reference El-Rhomri and Domínguez-Serrano8) . Coates(Reference Coates4) argues that while children’s food security is related to that of adults in the same household, it depends on the child’s age. Subsequently, it seems that separately measuring children’s and adults’ food security is better than one measure that tries to represent both, as current experience-based metrics were designed to do. El-Rhomri and Domínguez-Serrano(Reference El-Rhomri and Domínguez-Serrano8) note that household members do not always pool their resources equitably, for example, due to gender dynamics and gender power imbalance. Furthermore, members may share responsibilities to provide food, which can change according to circumstances. Members of a household may also obtain food from various sources not figured into the assessment. Similarly, coping strategies often used to assess food security (as in the CSI) vary between regions, communities, social classes, ethnic groups, households, gender, age and seasons(Reference El-Rhomri and Domínguez-Serrano8). These nuances are not necessarily captured by approaches that only interview one person representing the household.
The geographical location of households raises another concern concerning the metrics used. This systematic review highlights that food insecurity over the last two decades has decreased in South Africa but remains high in rural areas. The lack of natural resources to sustain agricultural livelihoods leading to the abandonment of own food production and prevailing gender inequality have been identified as major drivers of high food insecurity in rural South Africa(Reference Naicker, Mathee and Teare69,80). Most included sub-national studies focused on rural areas, with less emphasis on urban areas. However, the urban population in sub-Saharan Africa is projected to increase from 376 million in 2015 to over 1·25 billion people by 2050(81). The effect of this rapid urbanization on food security needs to become a research priority(Reference Tuholske, Andam and Blekking9), also in the context of the nutrition transition and the impact on malnutrition. Haysom and Tawodzera (2018)(Reference Haysom and Tawodzera27) point out that food security metrics currently used to measure household-level food security in urban areas may be more appropriate to the rural contexts where they have been extensively used. They state that these metrics ‘may not shed light on the broader urban food system, including infrastructure challenges, travel, food safety, and market governance’.
The recall period is another factor that varied much between the metrics used in the studies included in this review. The periods varied from 24 h to 7 d, to 30 d (1 month), to 3 months to a year. Longer recall periods reflect chronic food security, while short periods reflect short-term vulnerability. In the context of studies like the NIDS-CRAM, a very short recall period was valid based on the purpose of the survey to assess the impact of the COVID-19 pandemic and the impact of emergency government assistance and other interventions on household food security in the country. However, most studies included in this review did not indicate that they had specifically considered the recall period. In the context of university students, for example, using a reference period of 12 months or indeed any period that spans recesses where students vacate the university residences and student housing that they occupy during the academic term to return to possibly different household food situations may complicate the interpretation and comparability of food security results in this context. Therefore, considering the purpose of planned food security surveys is vital when deciding on the recall period. Jones et al. (2013)(Reference Jones, Ngure and Pelto6) also emphasized the importance of training fieldworkers to communicate to survey participants the same conceptual understanding of recall periods to temper recall bias. These considerations will only become more important considering a rising incidence of food security shocks linked to catastrophic climate change events, economic upheaval, civil unrest and war, amongst others, that have immediate and long-term effects on household food security, disproportionally affecting the poor.
There is growing recognition that we can no longer rely on a single metric when conducting food security research in the sub-Saharan African context, but that multi-variable approaches, drawing on the toolboxes of multiple disciplines, are vital(Reference Coates4,Reference Jones, Ngure and Pelto6–Reference Cafiero, Melgar-Quiñonez and Ballard10) . Among the studies that met the inclusion criteria of this review, only two sub-national studies used multiple complementary food security metrics. The most appropriate combination of metrics and recall periods needs further research(Reference Hendriks, van der Merwe and Ngidi2,Reference Jones, Ngure and Pelto6,Reference Cafiero, Melgar-Quiñonez and Ballard10,Reference Faber, Schwabe and Drimie61) . An in-depth analysis of the levels and components for which the available metrics are validated is vital(Reference Cafiero, Melgar-Quiñonez and Ballard10). Furthermore, few studies have assessed whether results obtained with common household food security indicators converge(Reference Hendriks, van der Merwe and Ngidi2,Reference Tuholske, Andam and Blekking9) . Evidence suggests that a panel of metrics chosen to assess food insecurity should also include metrics that assess the causes and consequences of food insecurity(Reference Hendriks, van der Merwe and Ngidi2). Since food security metrics are not sensitive enough to identify those who most need support, anthropometric measurements should be included(Reference Hendriks, van der Merwe and Ngidi2,Reference Coates4,Reference Pinstrup-Andersen31) . Furthermore, dietary diversity data should be included because, while the experience of hunger reflects the presence and frequency of deprivation, it does not provide information on the quality of the diet(Reference Hendriks, van der Merwe and Ngidi2,Reference Jones, Ngure and Pelto6) . Notably, none of the current food security metrics per se provides insight into the causes of food insecurity(Reference Hendriks, van der Merwe and Ngidi2). Thus, food security studies should be designed also to measure variables related to the determinants of food insecurity to inform intervention.
The following limitations are acknowledged: The quality of data collected in all studies included in a review of this nature cannot be assured. Although all identified studies were included in the current review, it may be argued that studies with very small sample sizes or inappropriate assessment methods should have been excluded. The authors decided to include them to provide a holistic picture of the work done over the review period, but their data have not been taken into account in the conclusions.
Conclusion
Although the current review suggests that the percentage of South African adults that have experienced food insecurity and hunger has decreased over the review period, the multitude of metrics used to assess the different components and levels of food security make it difficult to draw definitive conclusions. There is growing support for developing multi-variable approaches for food security research in sub-Saharan Africa. Future research should focus on finding the most appropriate combination of complementary metrics that would allow comparable data while holistically capturing food security and giving insight into the causes and consequences. Many South Africans still experience food insecurity and hunger regardless of the metrics used.
Acknowledgements
The authors wish to acknowledge Annamarie du Preez, the librarian who kindly assisted with the literature search.
Financial support
No financial support was received.
Conflict of interest
The authors declare that the research was conducted without any commercial or financial relationships construed as a potential conflict of interest.
Authorship
The authors confirm that the authors contributed equally to the paper, including study conception and design, systematic search and screening, and draft manuscript preparation and approval of the final version of the manuscript.
Ethics of human subject participation
No human subjects participated in the study.


 Open access