

Food insecurity is a crucial health and economic challenge in the USA, with 16·5 % of households with children experiencing food insecurity in 2016( Reference Coleman-Jensen, Rabbitt and Gregory 1 ). For many of these families, nutrition assistance programmes administered by the US Department of Agriculture (USDA) are a crucial support( Reference Poppendieck 2 ). USDA school meal programmes – specifically, the National School Lunch Program (NSLP)( 3 ) and the School Breakfast Program (SBP)( 4 ) – are available to all children attending participating schools, which includes virtually all US public schools and some private schools( Reference Oliveira 5 ). These programmes play a particularly important role in the diets of children from low-income and food-insecure households( Reference Ralston, Treen and Coleman-Jensen 6 ), who receive these meals for free or at reduced price (FRPM). In 2017, more than 22 million children across the USA received lunch and/or breakfast for free or at reduced price each day, on average( Reference Oliveira 5 ). For children from low-income families, participation is associated with better diet quality and academic performance( Reference Nord and Romig 7 ); for their households, these meals contribute to the household food supply and reduce the risk of household food insecurity( Reference Coleman-Jensen, Rabbitt and Gregory 1 , Reference Ralston, Treen and Coleman-Jensen 6 , Reference Mancino, Guthrie and Ver Ploeg 8 ). However, most children lose the support provided by FRPM from school during the summer, with the USDA estimating that only 15·5 % of FRPM-eligible children received summer meals from any of its programmes in 2015( 9 ). Increased childhood food insecurity in summer has been linked to limited access to government-sponsored meals programmes( Reference Nord and Romig 7 ), while findings from a USDA demonstration project have shown that additional food assistance when school meals are unavailable can improve the food security of low-income families with children( Reference Klerman, Wolf and Collins 10 ).
The USDA’s Summer Food Service Program (SFSP) provides free, nutritious meals to children and teens aged 18 years or younger in low-income communities. In 2016, over 48 600 sites in the USA offered SFSP meals, serving more than 2·8 million students daily( 11 ). The SFSP is financially supported by the USDA, with state-level administration and technical assistance from each state’s child nutrition agency. Unlike school meal programmes, however, summer sites can be operated by an array of local organizations (‘sponsors’), often including government agencies, summer camps, non-profit organizations and school districts. The Seamless Summer Option (SSO) is available to school food authorities (districts), to make the administration of summer programmes more similar to the NSLP. Together, the SFSP and SSO are hereafter referred to as ‘summer nutrition programmes’ (SNP). Expanding the reach of SNP is a priority for the USDA. The USDA’s 2014–2018 strategic plan included the goal of increasing the percentage of students eligible for FRPM who participate in summer meals, from 15·5 % in 2012, to 17·5 % in 2018( 9 ). This modest goal reflects the underutilization of the USDA’s programmes, both by sponsors and students.
While many SNP are located at schools, many others are located at community centres, parks, churches and apartment complexes. Summer sites must be located within the attendance area of a school where ≥50 % of students are eligible for FRPM or ≥50 % of students within a census tract/block group are eligible. In terms of criteria for who may receive meals, options include: closed programmes, open programmes, camps and programmes specifically for children of migrant families( 12 ). Closed sites require students to enrol with proof of eligibility, whereas open sites allow all students to eat, without enrolment or certification. Despite the convenience afforded by open programmes, uptake remains low.
Rural sites report several challenges limiting uptake, particularly involving transportation issues such as long travel distances, lack of family transportation options, and the costs of vehicle maintenance and gasoline( 13 ). Additional barriers that impact SNP sponsors in rural areas include administrative requirements, lack of trained staff, and low numbers of students that limit economies of scale( 13 – 15 ). Administrative requirements were streamlined and simplified in 2014( 16 ); however, work is needed to assess whether programme availability and student participation have increased in rural areas as a result of efforts to remove such barriers. Furthermore, despite known challenges for rural SNP sponsors, little is known about the extent of disparities in the presence of these programmes based on rurality and community demographics.
Prior work on ‘food access’ has recommended the use of five conceptually different categories including: availability, accessibility, affordability, accommodation and acceptability( Reference Caspi, Sorensen and Subramanian 17 ). While all five categories are of much importance, the present paper focuses on availability and access to these affordable food sources for children. ‘Availability’ is often studied using Geographic Information System (GIS) measures, conceptualized as the presence and/or density of food sources such as grocery stores within a specified area surrounding the home( Reference Caspi, Sorensen and Subramanian 17 ). A similar but slightly different construct is ‘accessibility’, which measures distance travelled to the nearest food source( Reference Caspi, Sorensen and Subramanian 17 ). A recent review of GIS measurement of obesogenic environments indicates that availability and accessibility are highly correlated( Reference Thornton, Pearce and Macdonald 18 , Reference Burgoine, Alvanide and Lake 19 ). GIS measures are generally stronger predictors of food insecurity than are survey measures of perceived availability or accessibility( Reference Caspi, Sorensen and Subramanian 17 ). While these constructs are relevant to summer food insecurity, limited research has examined children’s summer food insecurity in the USA, with only one study using GIS to examine accessibility (driving time) to SNP in California in 2011( Reference Miller 20 ). Those analyses of state-wide data from 5394 low-income families with children revealed that greater accessibility to SNP sites was associated with reduced rates of very low food security, particularly for families with younger children and those in non-urban areas( Reference Miller 20 ). Although studies demonstrate the value of SNP in addressing the immediate needs of extremely food-insecure families during months when school meals are unavailable, several questions remain, such as where there are gaps in SNP availability.
The current study uses administrative data from a large, diverse state (California) to: (i) examine characteristics of SNP in 2016; (ii) examine patterns of summer meal uptake by students; and (iii) examine how SNP availability varies by school and community demographics.
Methods
Data regarding SNP sites were obtained from publicly available information on the California Department of Education website. Data regarding summer claims and school-year NSLP and SBP claims for all public schools in California were obtained through a public records request to the California Department of Education. School demographic data were obtained from the National Center for Education Statistics (NCES).
Summer meal information
Site-level claims data for summer meals included site name, sponsor, site eligibility type (open, closed, etc.), number of each type of meal served (breakfast, lunch, snack, supper) and number of days served, for each month. Separate files for the SFSP and SSO were merged by researchers. Average daily lunches served were calculated by dividing total meals each month by number of serving days in that month (June, July, August). The number of NSLP lunches served at free or reduced price only (paid lunches not included) at schools operating in July 2016 were added to the SFSP/SSO data set for the calculation of summer uptake rates. Street addresses were added to the claims file by cross-referencing a publicly downloadable list of summer sites( 21 ).
School-year meals information
School-level claims for the NSLP were obtained for each month of the 2015–16 school year, including: number of students eligible for meals at free, reduced-price or paid status; total meals served at each price per month; and number of serving days per month. Calculations included: (i) average daily number of FRPM served each month; and (ii) average daily NSLP participation rate for each meal category (free/reduced-price/paid), in each month from October 2015 to March 2016. This was calculated by dividing total meals served each month, at each price, by total number of students at that price status, and by number of operating days. August/September and April/May were not examined because the participation in those months is sometimes less stable than in other months( Reference Guinn, Baxter and Finney 22 ). For subsequent analyses, October 2015 was selected because it has the fewest holidays and most serving days (mean 21·1 (sd 1·8) d). Participation rates in October were correlated highly with other months (all r>0·89). The same calculations were made for SBP participation rates.
Administrative data for 8442 public schools were used to characterize school-year meals. Claims data received through the records request included 9348 sites; however, only 8759 had a unique ‘County-District-School’ identifier to link data with NCES demographics or street addresses, thus 589 cases without an identifier were dropped. These were mostly pre-schools, annex programmes, community centres or alternative programmes. Another 317 cases were dropped because demographic data or addresses could not be found.
School characteristics
School characteristics were obtained from NCES for the 2014–15 school year. School level was categorized as elementary school (referent), middle school, high school or other type of school (multiple grades). School size was based on student enrolment, coded as: ≤399 (referent), 400–699, 700–999 and ≥1000. Student race/ethnicity was the percentage of students with self-reported race of White, Asian, Black, American Indian or multi-racial, and/or Latino ethnicity. School-level poverty was proxied by FRPM eligibility, grouped as <50 % (referent); ≥50 to <75 %; and ≥75 %. The 50 % cut-off was chosen to align with the SFSP threshold, and 75 % was based on how NCES identifies high-poverty schools( 23 ).
Data analysis
Descriptive statistics characterized the sample, including school demographics and school-year SBP and NSLP participation rates. Descriptive statistics also characterized lunches served in June, July and August. Thereafter, two strategies were used to examine associations between school year and summer meals. Because many SNP are sponsored by entities other than schools, a strategy is needed to link schools and summer sites. One approach is to aggregate data up to the county level and compare, county by county, how summer meal service relates to school-year lunch participation. A second approach involves a micro-level GIS linkage between schools and SNP, by creating a service area around each school and calculating how many SNP operate around each school.
Strategy 1: aggregated county-level analyses
For county-level aggregation, lunch claims for summer (July 2016) and school year (October 2015) were summed, by county. Summer claims included three sources: SFSP, SSO and free/reduced-priced NSLP claims for schools operating in July (1566 year-round schools, which primarily included school districts and county education agencies, plus juvenile justice agencies, group/residential homes and social service agencies). Each county’s uptake rate was calculated as the county-level sum of average daily number of lunches in July 2016, divided by average daily number of FRPM lunches in October 2015. Comparisons of uptake rates were made by metro and non-metro areas, based on the USDA’s 2015 county typology codes( 24 ). In addition, comparisons were made by USDA’s county-level typologies for: (i) low education rates; (ii) low employment rates; and (iii) persistent child poverty.
Strategy 2: micro-level geographic analyses
Geographic examination of SNP availability around each school utilized ArcGIS version 10.4.1, with TIGER/Line Shapefiles available from the US Census Bureau. Schools and SNP were added to the map using geocoding, adding a point to a map based on street address. Network distance, following the path individuals would take to access a point of interest, was utilized to determine the presence of SNP within certain distances from each school using the service area function in Network Analyst in ArcMap. Both a 1·6 km (1 mile) and a 16 km (10mile) service area were created following road systems around schools( Reference Apparicio, Abdelmajid and Riva 25 , Reference Apparicio, Shearmur and Brochu 26 ). These distances were selected to align with USDA’s definition of food accessibility for urban (1 mile) and rural communities (10 miles)( 27 ).
Data from SNP were joined with both service areas, which allowed for calculation of number (count) of SNP within the service areas around each school. These data were merged with the school data set for subsequent analyses to characterize SNP availability. Each school was categorized as urban/suburban or rural/township based on NCES classifications( 28 ). The exception was for town fringe and rural fringe; schools in these categories were classified as urban/suburban, as they were located within 16 km (10 miles) of an urban centre. Descriptive statistics were used to characterize SNP availability and logistic regressions were used to examine SNP availability around schools, performing the regression with a binary outcome of any availability (yes/no) v. school characteristics of: SBP and NSLP participation rates, student race/ethnicity, poverty, school level and school size. The statistical software package Stata/SE version 13.0 was used for analyses, with clustering to account for county.
Results
Summer nutrition programmes: Summer Food Service Program and Seamless Summer Option
In 2016, 4685 unique sites served summer meals through the SFSP or SSO; nearly half (n 2203; 47·0 %) used the SSO, whereas the rest used the SFSP. Most sites (n 4141; 88·4 %) offered an open programme, with 464 using a closed programme (9·9 %) and eighty (1·7 %) operating at camps. The majority of sites (n 4332; 92·5 %) served lunch, either alone (n 1706; 36·4 %) or in combination with other meals such as breakfast/lunch (n 1530; 32·7 %), lunch/afternoon snack (n 766; 16·4 %), or lunch plus supper, morning snack, or another combination including lunch (n 330; 7·0 %). The remainder of sites (n 353; 7·5 %) did not serve lunch, instead serving various combinations of morning or afternoon snacks, with or without breakfast or supper.
The earliest start was 26 May, with the latest service date being 30 September; however, only four programmes served meals in September. Most SNP programming occurred between June and August. For parsimony and to avoid double-counting sites that offered multiple meals, subsequent analyses focused on claims for lunch only, at open or closed sites (excluding camps), during June, July or August. The intent of this reduction was to focus on programmes that provide drop-in opportunities for food-insecure children to receive lunch during the summer (v. those attending camps or sites serving only snacks or breakfast). Table 1 provides descriptive information about lunches served in summer 2016 and splits these statistics into urban counties v. rural counties. Urban and rural counties did not vary in number of serving days per month, but the volume of meals was significantly lower in rural counties. The number of days on which meals were served dropped sharply in August in both rural and urban counties; while many schools start in mid/late August, the number of sites serving lunch in August was less than half that in June and July.
Table 1 Lunches served by month in summer 2016, using the Summer Food Service Program or Seamless Summer Option Footnote †, all open and closed sites in the state of California, USA
* P<0·05 is used to denote significant differences between urban/suburban and rural/township counties.
† Does not include camp or migrant-only programmes; and does not include meals provided at year-round schools through the National School Lunch Program.
School characteristics
As shown in Table 2, the majority of schools in California are located in areas classified as urban (including suburban) v. rural (including townships). Compared with urban schools, rural schools were smaller, with higher levels of poverty and higher proportions of White non-Latino students (all P<0·001). Because none of the race/ethnicity variables were normally distributed and could not be used as covariates, a two-category variable was calculated, classifying schools as majority (>50 %) White non-Latino v. other (diverse, or majority of students of colour).
Table 2 Characteristics of the sample of 8442 public schools in California, USA, in the 2015–16 school year, with urban v. rural differences
† Includes urban or suburban.
‡ Includes rural and township.
§ P values are for comparisons between urban and rural schools, using χ 2 test for categorical variables (top of table) or t test for continuous variables (bottom of table).
Participation rates for breakfast and lunch
The NSLP participation rate in October 2015 averaged 52·5 % across all schools, consistent with national rates( 29 ). NSLP participation rates were significantly higher in rural schools than urban schools (56·1 v. 52·1 %; P<0·001). For breakfast, however, many schools do not participate in the SBP, making the distribution of this variable non-normal; therefore, SBP participation rate was classified in deciles. Schools not participating in the SBP were grouped with those having <10 % participation (referent). There was a significant difference between urban and rural schools (P<0·001), with rural schools having higher breakfast participation rates (Table 2).
Aggregated results for uptake in July 2016
State-wide, summer lunch uptake was 18·2 % but varied considerably by county and rurality of each county (see Fig. 1). Three counties (all rural) had no SNP. Among counties with at least one SNP, uptake ranged from 1·8 to 59·0 %. The coastal counties (with highest population densities) had higher uptake, whereas northern rural counties had lower uptake; in particular, rural central and eastern counties in the Sierra Nevada region had very low uptake. To further explore county-level characteristics associated with SNP uptake rates, county-level uptake was cross-tabulated with demographics (Table 3). Because of the non-normal distribution of uptake, this outcome was split at 10 % as well as at 18 %, the state average. The χ 2 test showed few statistically significant county-level differences in uptake, based on USDA classifications, but significantly more urban counties had uptake above 10 % v. rural counties (P<0·05). Uptake was significantly lower in counties with low levels of education (P<0·05) but did not differ according to county-level child poverty rates.
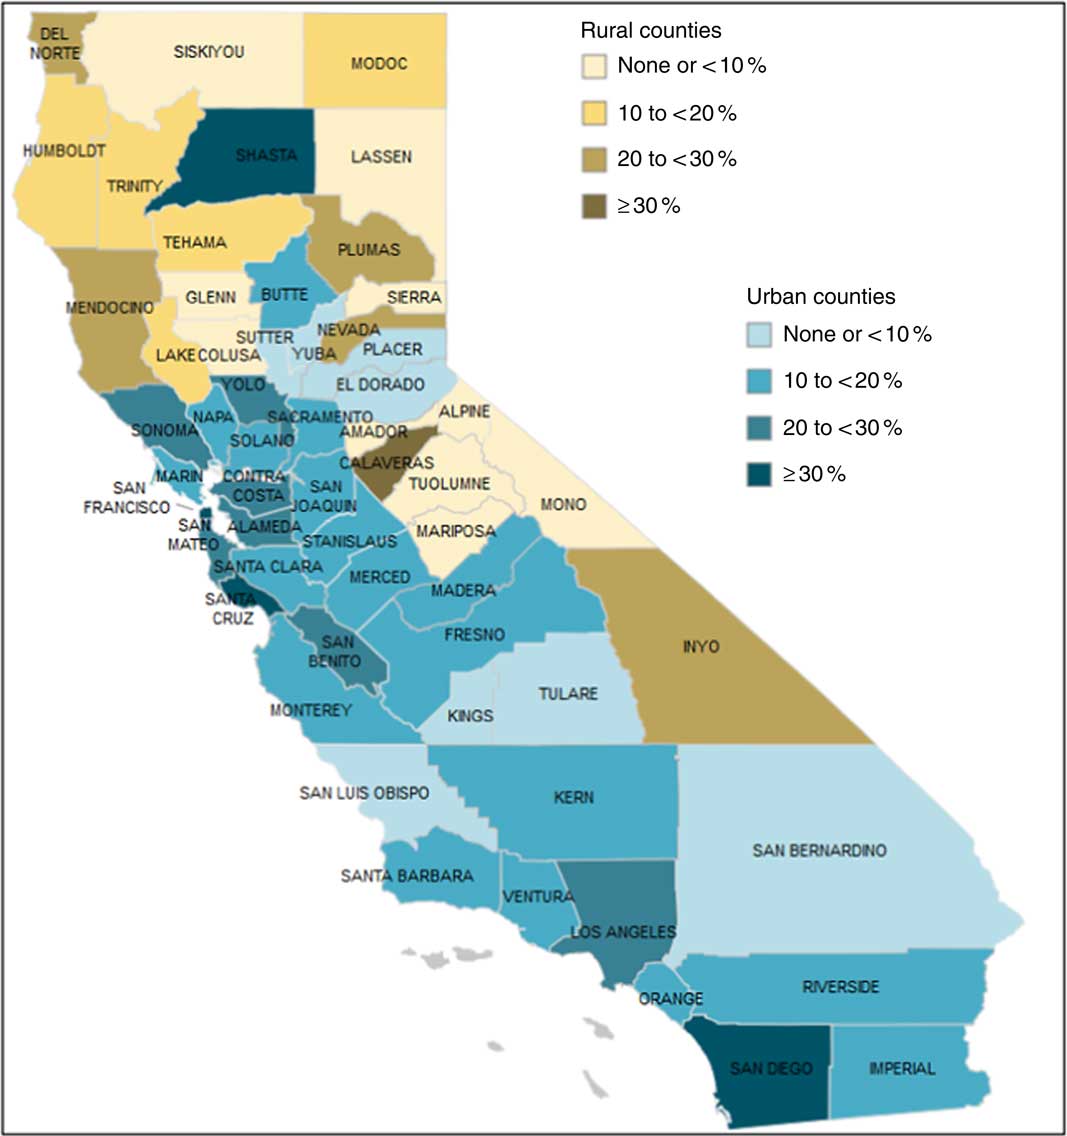
Fig. 1 Map of summer meal uptake rates by county, California, USA, July 2016. Uptake rates are calculated as percentages, based on number of summer lunches served daily per county through the Summer Food Service Program, Seamless Summer Option or National School Lunch Program (NSLP) in July 2016, divided by number of meals served daily at free/reduced price through NSLP in October 2015
Table 3 Associations between county-level characteristics and summer lunch uptake ratesFootnote † in 2016, in all fifty-eight counties in California, USA
† Calculations of uptake rate included daily lunches served in July 2016 through three programmes: Summer Food Service Program, Seamless Summer Option or National School Lunch Program.
‡ Categories are defined by the US Department of Agriculture’s 2015 county typology codes( 24 ).
Because county-level aggregated analyses had limited statistical power due to having only fifty-eight cases, each of which were weighted equally in analyses despite differing geographical area and population densities, a second strategy was used to geographically examine the availability of summer feeding opportunities.
Geographic Information System results
GIS was used to overlay school locations and SNP sites. Importantly, the SNP sites included only SFSP and SSO programmes, but not the 1566 year-round schools participating in the NSLP in July. This was done to examine availability of optional SNP programmes, with the goal of mapping areas with opportunities to improve drop-in food access for children not attending school. Most data points were included in the analysis, with 87·1 % of schools and 88·6 % of summer sites mapped through street address geocoding or XY data. An additional twenty-five cases were lost in the process of locating schools in the network during creation of the service areas. The final sample resulted in 7752 complete cases (91·8% of schools). This rate of missing data is similar to prior research using TIGER/Line shapefiles when geocoding schools( Reference Zandbergen and Green 30 ).
Figure 2 illustrates the mapping of urban schools and SNP, using a 1·6 km (1 mile) service area. As can be seen, there is a high density of schools, with considerable overlap among service areas. While several of the schools have an SNP at the school building (upper left), on the right part of Fig. 2 there are several schools with no SNP in the service areas. Figure 3 illustrates a rural area with six schools and the 16 km (10 mile) service area around each. The schools in the upper far left, middle and bottom of the map have no SNP in the service area, whereas the two schools close together in the upper left have two within 16 km (10 miles). Figure 4 shows the distribution of all SNP sites and schools across the state.
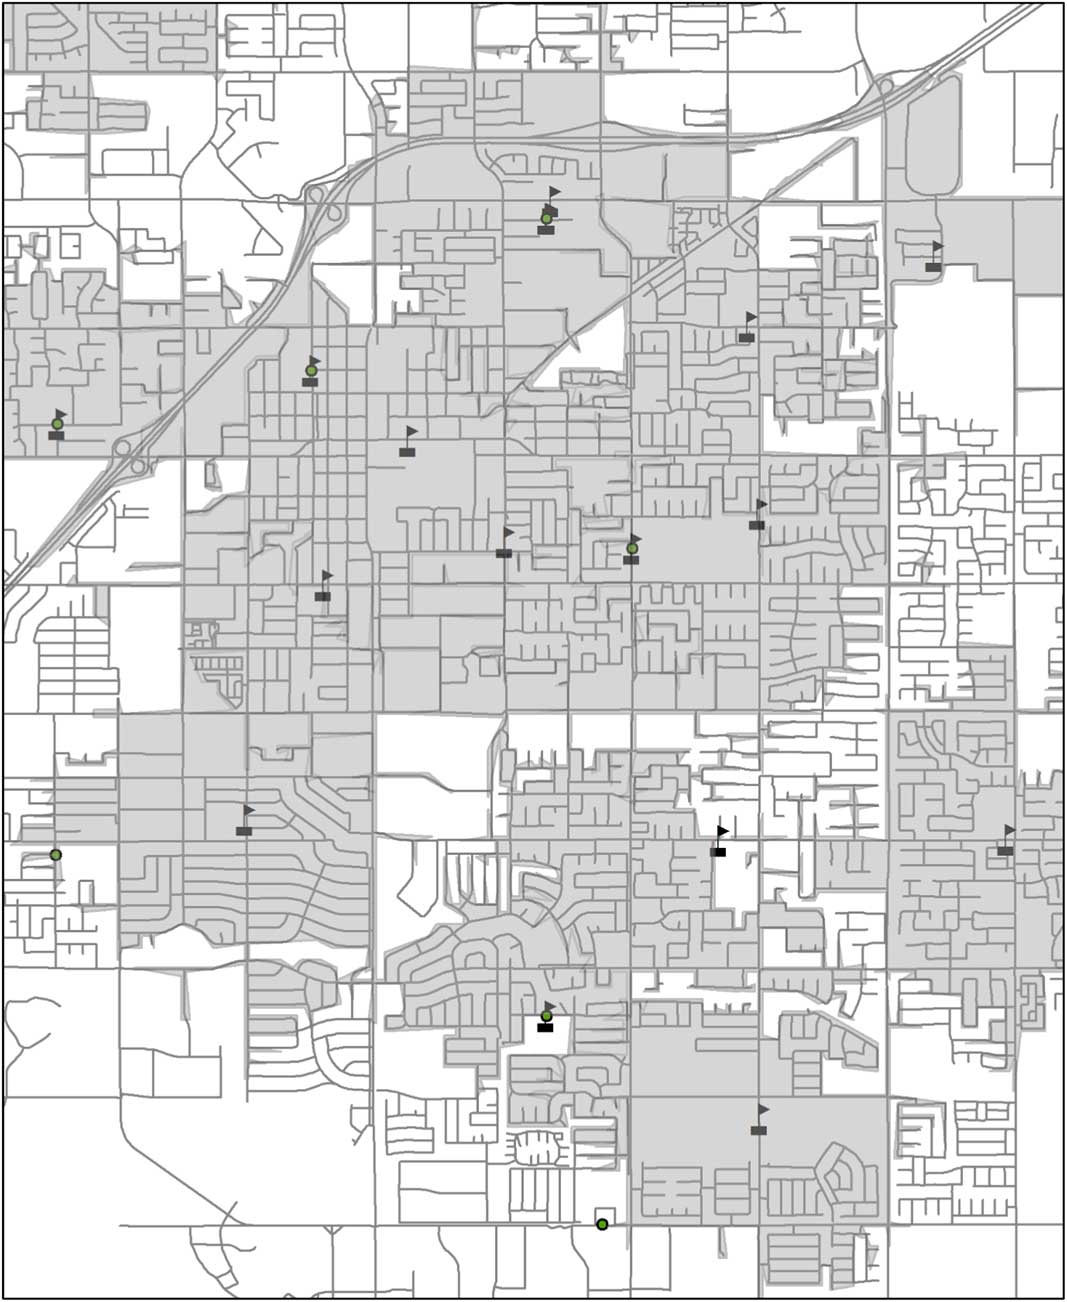
Fig. 2 (colour online) Illustration of urban schools with 1·6 km (1 mile) service areas, California, USA, summer 2016. Circle indicates a summer nutrition programme site; flag indicates a school building and is the centre of each service area. Grey areas are the service areas around each school and white areas are outside the service area
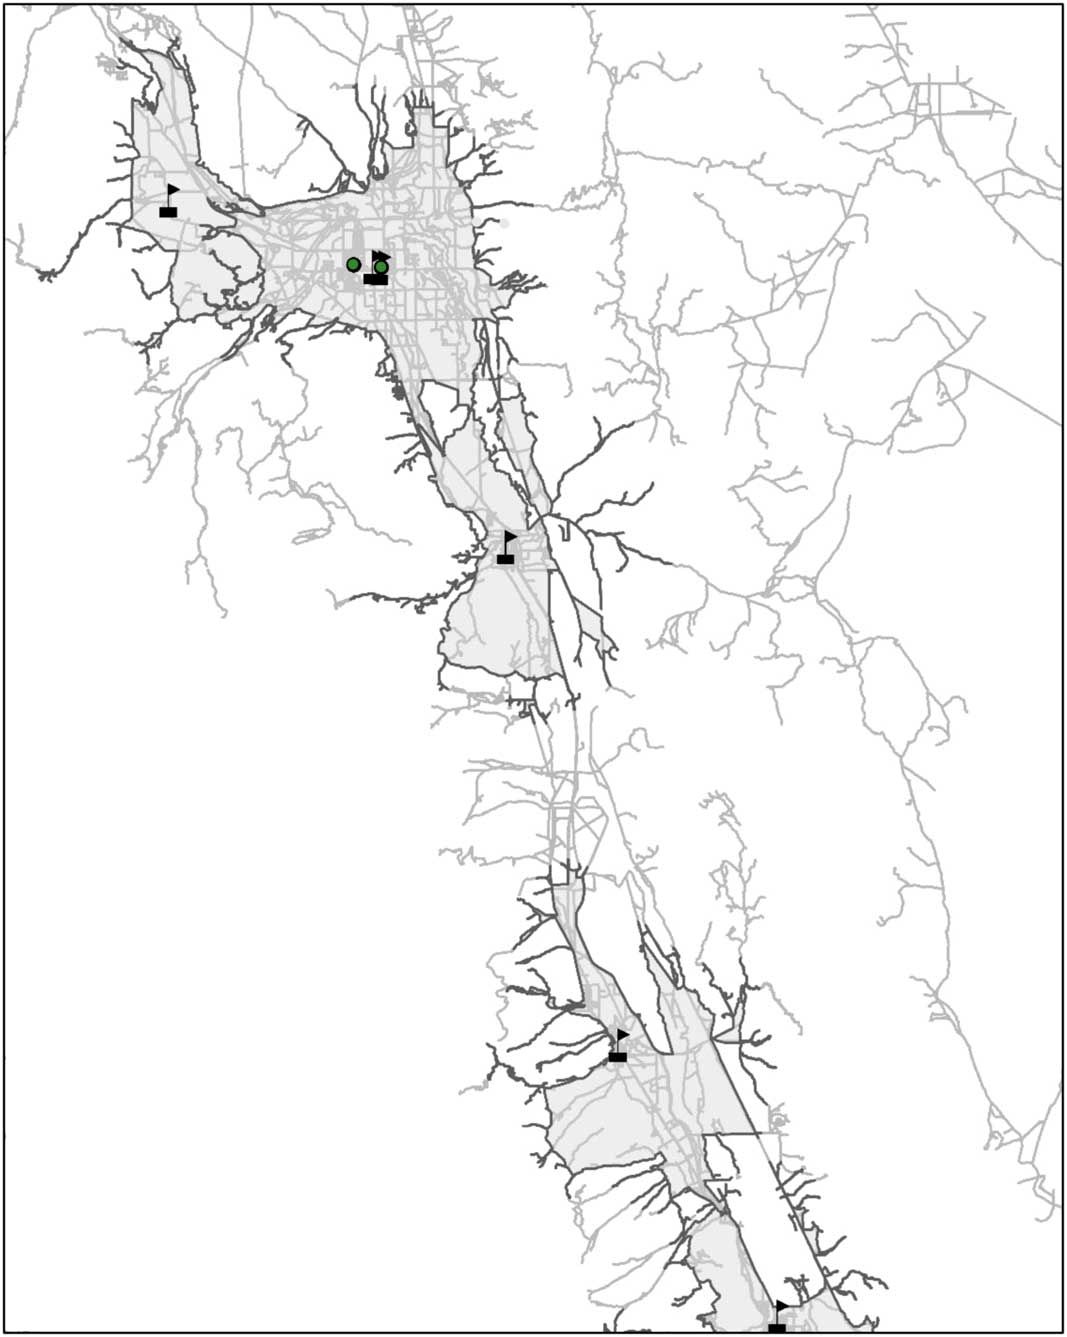
Fig. 3 (colour online) Illustration of rural schools with 16 km (10 mile) service areas, California, USA, summer 2016. Circle indicates a summer nutrition programme site; flag indicates a school building and is the centre of each service area. Grey areas are the service areas around each school, and the roads within the service area are shown in darker grey. Lighter grey roads are outside the service area, and white areas are roadless areas that are outside the service area
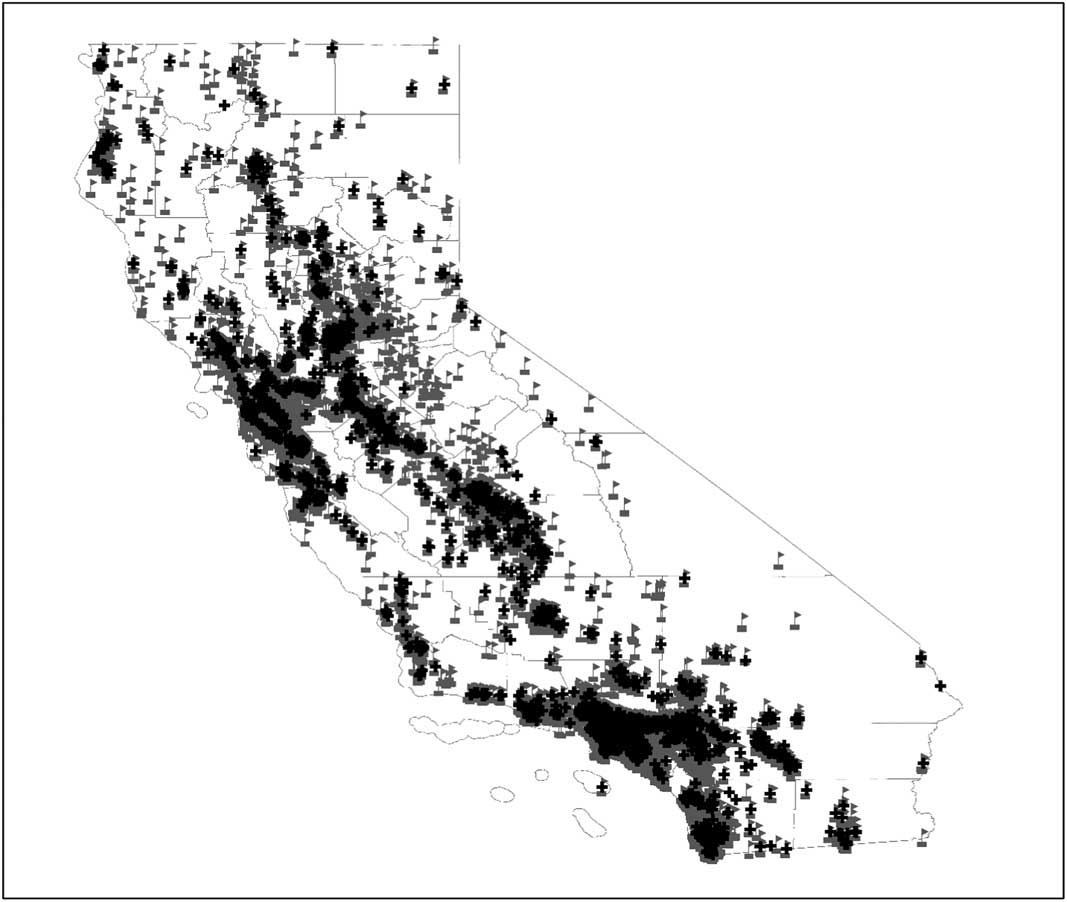
Fig. 4 Location of summer nutrition programme sites and schools, California, USA, summer 2016. Black plus sign indicates a summer nutrition programme site and grey flag indicates a school building
After mapping, the availability of any SNP around each school was analysed with logistic regression to examine school characteristics associated with availability. This was done separately for rural/township and urban/suburban schools (Table 2). Because of the non-normal distribution of this outcome, and the goal of examining whether students had any SNP available, the outcome for subsequent analyses was a binary variable indicating the presence of any SNP within the surrounding service area, coded as none v. one or more. A 1·6 km (1 mile) area was used for urban schools, within which distance 58·5 % of schools (unadjusted for covariates) had an SNP, in contrast to only 43·8 % of rural schools. A 16 km (10 mile) area was used for rural schools, within which distance 65·7% had an SNP, in contrast to 98·6 % of urban schools.
Regression results
For both urban and rural schools, SNP availability was associated with many school-level demographic characteristics (see Table 4). After adjusting for all predictors in the model, 63·9 % of urban schools had at least one SNP available within 1·6 km (1 mile) and 68·1 % of rural schools had at least one SNP available within 16 km (10 miles).
Table 4 Results of logistic regressions to predict presence of any summer nutrition programme (Summer Food Service Program or Seamless Summer Option) within the service area around schools, by school characteristics, California, USA, summer 2016
Ref., referent category.
† n 6131 for urban schools and service area uses a 1·6 km (1 mile) distance.
‡ n 576 for rural schools and service area uses a 16 km (10mile) distance.
§ Percentages are based on adjusted prevalences, which represent the percentage of schools with a summer nutrition programme in the service area, adjusting for all other covariates in the model.
Urban schools
SNP were least available in the proximity of urban elementary schools (60·5 %), compared with middle schools (65·3 %; P<0·01), high schools (72·6 %; P<0·001) or other multiple-grade schools (69·8 %; P<0·05). Urban schools with diverse or majority non-White students were more likely to have SNP (65·5 % v. 51·4 %; P<0·001). As expected, SNP were more common within 1·6 km (1 mile) of urban schools with high percentages of students eligible for FRPM, particularly for the highest poverty schools, but even 34·0 % of schools with <50 % FRPM eligibility, which are themselves not eligible to be summer sites, still had at least one site available nearby. Although total NSLP participation rate was not significantly associated with SNP availability near urban schools, SBP participation rate was significantly associated with availability, with the biggest difference in availability between schools having breakfast participation of 70–80 % (77·4 % had an SNP available) v. those at 10 % or lower, or no breakfast programme at all (61·3 % had an SNP available).
Rural schools
The sample size for rural schools was smaller, but adequate to detect interesting patterns. While school level was not associated with SNP availability within 16 km (10 miles), availability varied by school size, with significantly lower availability around schools with fewer than 400 students (60·2 % had an SNP in the service area) compared with those with 400–699 students (78·5 %; P<0·001), 700–999 students (94·7 %; P<0·001) and those with ≥1000 students (87·3 %; P<0·05). As with urban schools, SNP availability was higher among rural schools with diverse or majority non-White students (76·2 v. 58·7 %; P<0·001). As with urban schools, SNP availability for rural schools was significantly and positively associated with student FRPM eligibility. Student participation rates in the NSLP and SBP were not associated with SNP availability around rural schools. For comparability with urban schools, a second regression model was computed to examine predictors of SNP availability within the 1·6 km (1 mile) service area; although the covariate-adjusted prevalence of availability was much lower (46·5 % of schools had an SNP within 1·6 km (1 mile)), the pattern of results for rural schools was similar to those for the 16 km (10mile) service area shown in Table 2 (results not shown; available from authors upon request).
Discussion
Goals of the present study were to expand the understanding of characteristics of SNP in California, variations in student uptake rates for summer meals and patterns of SNP availability around schools. A key element of the study involved exploration of rural and urban differences in availability of programmes that can support food-insecure children and teens during the summer months when school is not in session. State-level uptake for summer meals was 18·2 %, but varied considerably by county, with some counties (e.g. Shasta and San Francisco) having uptake of 30 % or higher, whereas many rural counties did not have SNP lunch programmes in July, although some counties had camps and/or one or two sites offering snacks only.
For urban and rural SNP, there was a significant drop in serving days and meals per day in August. The fewer serving days in August may reflect decreased demand during that time, but also indicates a gap in support for food-insecure students. Research in Texas also found that participation drops in late July and August after summer schools end( 13 ). However, because summer is already a time of heightened food insecurity for children from low-income households( Reference Miller 20 , 31 – Reference Huang, Barnidge and Kim 33 ), this lowered SNP availability makes August a risky time for children. As a recent report notes, 1 million more meals were served nationally in August 2016 compared with August 2015( 31 ), with state agencies making specific efforts to close the summer meal availability gap. However, it appears likely that additional efforts are needed at the end of summer break.
The GIS strategy revealed variations in SNP availability. In keeping with USDA definitions( 27 ), a 16 km (10mile) travel distance was used for rural schools, and 65·7 % of rural schools (unadjusted for covariates) had an SNP available in that area. However, nearly all urban schools had an SNP available within 16 km (10 miles), making that distance inappropriate for urban areas. Although the 16 km (10mile) distance is utilized in many studies, food-insecure families often lack access to personal vehicles( Reference Mancino, Guthrie and Ver Ploeg 8 ), which limits their ability to travel to obtain food. The lower uptake of SNP in counties with low education rates may reflect such differences: because one of the consequences of lower education is lower wages( 34 ), residents of such counties, while not necessarily unemployed, may struggle to afford vehicle maintenance costs and gasoline, or they may be unable to transport their children due to being at work during the day. In other words, families who may most need SNP may struggle to access them. Whereas 16 km (10 miles) may be too far a distance for children or teens to walk or bike to rural SNP sites, a 1·6 km (1 mile) distance in urban areas might allow students to access these programmes by walking, biking or using public transportation. A 16 km (10mile) service area distance is large and although it is common that rural schools are charged with covering a wide geographic area( 35 ), this can result in administrative and logistical challenges( 36 ) for child nutrition assistance programmes such as SNP and the families that utilize them.
GIS analyses illustrated demographic differences in SNP access. For urban schools, the percentage of students eligible for FRPM was associated with availability of SNP, as would be expected due to the ≥50 % FRPM eligibility criteria for SNP. However, sometimes there are exceptions, with the USDA allowing weighted averaging in up to three adjacent census block groups so long as at least 40 % of students in each block group are eligible( 37 ). This can result in some schools with 40–50 % FRPM eligibility serving summer meals. Adjusted prevalences in the regression model showed that 34·0 % of urban schools with 0–50 % FRPM eligibility had at least one SNP available nearby; a likely explanation is that the service area around those schools overlaps with a school with higher FRPM eligibility (e.g. a high school with a broader catchment area). For students eligible for FRPM who attend schools with relatively low poverty rates (defined here as <50 % FRPM), there is often still a need to have summer feeding options. Such options exist for food-insecure students at only 34·0 % of lower-poverty schools in urban areas and 53·9 % in rural areas.
There was a significant difference in SNP availability by racial/ethnic composition, with higher availability around schools with diverse student race/ethnicity (e.g. no majority) or those with a majority of non-White students or majority Latino ethnicity. In other words, schools serving high proportions of students of colour were more likely to have programmes available nearby, in urban and rural areas. This effect was significant in multivariate models, after accounting for school poverty. SNP may be a key aspect of the food insecurity safety net among communities of colour, which experience higher rates of food insecurity( Reference Coleman-Jensen, Rabbitt and Gregory 1 ).
With regard to school level, in urban areas the highest SNP availability was at urban high schools; this is not surprising because high schools are often centrally located and have large enough numbers of students to allow economies of scale in meal preparation. Larger schools may have greater demand and may also have more resources to administer programming in the summer months. This effect is consistent with patterns among school district sponsors to locate SFSP sites at their district’s high schools. In contrast, rural schools did not show school-level differences, perhaps because in small towns all schools are in close proximity to one another, thus all schools show an SNP within the service area.
For rural schools, school size was a key predictor, with nearly all rural schools (94·7 % of schools) with 700–999 students having an SNP available v. only 60·2 % of the smallest schools. This speaks to the importance of student demand and the lack of economies of scale that occur in smaller communities. In other words, even if the majority of students in a rural area are eligible for FRPM, if the absolute number of students is low, then it becomes challenging for sponsors and sites to financially balance the labour and production costs of meals with the low number of claims for reimbursement. This is especially important, as nearly two-thirds of the rural schools in this sample had fewer than 400 students. Although this sample used data from California, a state with a relatively low rural population, across the USA, 57 % of school districts and 32 % of all US public schools are in rural areas( 35 ). Furthermore, rural communities in the USA experience high levels of poverty, with more than 20 % of rural counties having persistent poverty since the 1970s( Reference Lichter and Brown 38 ). Rural US counties represent a disproportionally larger percentage of counties with higher-than-average household and child food insecurity( 39 ). In these data, rural schools had higher SBP and NSLP participation rates, suggesting that, during the school year, these programmes contributed importantly to children’s diets.
Although school-year NSLP participation rate was not significantly associated with SNP availability, SBP participation was significantly and positively associated with having an SNP near urban schools. School breakfast programmes are especially important for students who are food insecure( Reference Bartfeld and Myoung 40 , Reference Fletcher and Frisvold 41 ). Thus, it is perhaps not surprising that breakfast participation would be associated with a higher likelihood of SNP in the community. In such communities, school administrators, food service directors and community partners are likely to make specific efforts to address food security using multiple USDA programmes. SBP participation may not only reflect increased effort or commitment among these school districts (i.e. potential summer sponsors), but also perhaps a greater administrative capacity and skill to complete programme paperwork.
The present study explored rural and urban differences in summer food availability and access in one state in the USA, but additional research is needed to understand other aspects of the ‘5 As’( Reference Caspi, Sorensen and Subramanian 17 ) such as parent and child perceptions about the ‘acceptability’ of SNP, with particular consideration of issues such as perceived stigma about accessing safety-net programmes. Stigma remains a barrier to accessing many nutrition assistance programmes. Also exploring acceptability in terms of students’ dietary perceptions – that is, the palatability, appeal and nutritional adequacy of meals – will also be important. Recent work suggests that rural and urban residents in the USA differ in attitudes about summer food and strategies for coping with food insecurity. For example, among African American caregivers in Missouri, rural caregivers rated community food assistance resources as most strongly associated with their children’s food security, whereas urban caregivers focused more on food costs and employment( Reference Barnidge, Chapnick and Sawicki 42 ). This may reflect the greater availability of SNP in urban areas, which makes this topic less salient for urban residents because there are more feeding options for their children to utilize. Other work examining family strategies for coping with food insecurity( Reference Edin, Boyd and Mabli 43 ) has found that although most families using the Special Nutrition Assistance Program (SNAP) face challenges at the end of the month when benefits have often been used up, those who are the most food insecure have fewer alternatives for support such as sharing with family members and using budgeting strategies to stretch their purchasing power (i.e. maximizing ‘affordability’). Future analyses that examine SNP uptake on a more-specific calendar basis, focusing on days at the end of the month, would contribute important information about how these programmes might be used by families to reduce food insecurity among their children and entire household at those vulnerable time periods.
The current work utilized distances of 1·6 km (1 mile) in urban locations and 16 km (10 miles) in rural locations, a definition based on retail food environment research, which pertains to adults. However, transportation options are different for children from those for adults, and prior work has clearly demonstrated that transportation challenges are a barrier to SNP utilization. Because of these known barriers to SNP access and availability, other strategies may be necessary. In 2011, the USDA started pilot-testing the Summer Electronic Benefits Transfer for Children (SEBTC), which provides families of children eligible for FRPM with electronic benefit cards to purchase food from local retailers. A variety of models have been tested, including monthly benefits of $US 30 or $US 60, with or without requirements that specific foods be purchased. Demonstration projects, including randomized trials, have shown that these approaches reduce food insecurity and increase consumption of healthful foods( Reference Klerman, Wolf and Collins 10 , Reference Gordon, Briefel and Collins 44 – Reference Collins and Klerman 46 ). SEBTC can supplement the supports available to food-insecure children via SNP, because family participation in the SEBTC does not preclude children from also receiving meals at SNP sites. Given the lower availability of SNP in rural locations, this approach may be particularly valuable for alleviating food insecurity in remote areas, although limited availability of retail environments that stock healthful foods and beverages will also impact nutrition outcomes and food insecurity status for residents of remote rural areas. Future research assessing the strengths and limitations of this approach and the extent to which it could complement existing programmes would be valuable.
Limitations
Although California has a large population density, educating more than 6 million public school students from kindergarten to 12th grade (12 % of American students)( 47 ), the current analysis may not generalize to other states in the USA, nor to other countries. The demographics of California residents differ from other states in the USA, as does the political climate, with more support for, and utilization of, social services programmes( 48 ). High costs of housing in California may impact household allocations of limited resources, changing the ways in which safety-net programmes such as SNP may be used by households with children. And, in recent years, changes to immigration policies have reduced the number of legally eligible low-income immigrant families who utilize nutrition assistance programmes such as SNAP( Reference Evich 49 ). US states vary considerably in the extent to which SNP operate, for how long, and how many eligible low-income school-age children are served( 31 ). A forthcoming national study from the USDA may provide more insight into the extent to which the factors identified in the present study are found in other states( 50 ).
While county-level aggregated estimates of uptake are relevant for some comparisons, such as those involving USDA county typologies, any analyses at the county level should be interpreted with consideration of the ways in which such aggregated data mask school-level and community-level variability within those counties. Therefore, we utilized GIS analyses to explore micro-level variations around schools. In the GIS analyses, availability was conceptualized as presence of an SNP within a service area centred on the school, but school catchment areas vary and often students live outside those 1·6 km (1 mile) and 16 km (10mile) areas. The service area utilized the actual road-based travel route, but future analyses can be strengthened by incorporating time and mode of travel, as geographic distance is not a complete picture of accessibility( Reference Tenhanen, Saarsalmi and Järv 51 ) and factors such as road safety hazards for pedestrians were not assessed. Finally, these analyses considered only a binary outcome of whether any SNP was available, but not the density or number of SNP or types of meals available.
Implications
In the USA, school meal programmes play an important role in promoting the food security of low-income children and their households( Reference Ralston, Treen and Coleman-Jensen 6 ), supplementing household-based assistance provided through SNAP( Reference Mancino, Guthrie and Ver Ploeg 8 ). Changes in the safety net in the USA over the past several decades have resulted in additional supports for working poor families; however, the elimination of support programmes that are not contingent upon employment status threatens the health of children from many poor families( Reference Tach and Edin 52 ). When students lose access to school meals during the summer, food insecurity increases( Reference Nord and Romig 7 ). Although the USDA has allocated considerable resources to expanding the SFSP and increasing participation( 12 , 15 , 16 ), summer meal programme participation continues to be far below that of school meals( 31 ). The current work shows that several gaps in availability and access remain, particularly for rural communities. Innovative solutions are needed for transportation barriers; the USDA’s Summer Meals Toolkit includes information about a variety of transportation approaches, with examples from sites that have used them, such as mobile meals, call-to-ride services, bus passes and community partnerships( 53 ). Non-profit agencies also provide valuable resources such as toolkits with month-by-month action guides( 54 ) and strategies for raising community awareness( 55 ).
The USDA also offers targeted technical assistance to state and community agencies. In 2013, five states were supported with technical assistance teams, resulting in 7 million more meals served than during than the prior summer; in 2014, six more states were supported, with an increase of 10 million meals( 56 ). Clearly, such efforts are a valuable aspect of expanding SNP. Research should continue to explore the relationship between SNP and food insecurity. Summer increases in food insecurity for households with children are higher in states with fewer SNP( Reference Nord and Romig 7 ), and low-income households are unable to absorb the reductions in nutrition benefits that are typical during the summer for such families with school-aged children( Reference Almada and McCarty 57 ). Because SNP can alleviate summer food insecurity for families in rural areas( Reference Miller 20 ), continued allocation of federal and state resources to these programmes is well warranted.
Acknowledgements
Financial support: This work was funded by cooperative agreement 58-4000-6-0054R from the US Department of Agriculture to Boise State University. Authors K.R. and J.F.G. are employed by the Economic Research Service at the US Department of Agriculture, and were involved in the design, analysis and writing of this article. The findings and conclusions in this preliminary publication have not been formally disseminated by the US Department of Agriculture and should not be construed to represent any agency determination or policy. Conflict of interest: None. Authorship: L.T., K.R. and J.F.G. designed the study. L.T. compiled the data. L.T. and N.O’R. conducted the analyses and wrote the first draft. K.R. and J.F.G. reviewed the first draft and provided substantive feedback. Ethics of human subject participation: This project was determined to not involve human subjects research by the Institutional Review Board at Boise State University.


