


The health benefits of whole grain (WG) foods are well established, including lower risk of CVD, weight gain and diabetes(Reference Mozaffarian, Appel and Van Horn1). Such benefits are likely related to multiple factors including higher contents of micronutrients, polyphenols, fatty acids and dietary fibre alone or in combination; lower glycaemic index; and also their replacement of more refined grains and sugars in one's diet(Reference Mozaffarian, Appel and Van Horn1–Reference Slavin, Jacobs and Marquart3). Based on this evidence, the US Department of Agriculture's (USDA) 2010 Dietary Guidelines recommends that Americans consume at least 3 servings of WG products daily(4), and the new US Nutrition Standards for the National School Lunch and School Lunch Programs require that at least half of all grains be WG-rich(5). Many countries worldwide include an emphasis on eating whole grains (WG) in their dietary recommendations(6, 7). Industry has responded with an explosion of products marketed to consumers as being or containing WG. In 2010, the number of new grains marketed as WG was nearly twenty times higher than the number introduced in 2000(6). The global market for WG foods is expected to exceed $US 24 billion by 2015(8).
Remarkably, this formulation, marketing and promotion of ‘whole grain’ foods has come with relatively little standardization to assist individuals and organizations in identifying and selecting healthful WG options. Internationally, requirements vary for industry to be able to add a specific WG health claim. In the UK and the USA, in order to use a health claim, WG foods must contain at least 51 % WG ingredients by wet weight; in Sweden and Denmark, at least 50 % WG ingredients by dry weight; and in Germany, at least 90 % WG in bread(9). However, not all products that are eligible to use the WG health claim actually include it on the package, limiting the utility of this criterion for guiding consumers. Furthermore, the health claim is based on partial WG content alone, without any limitations or guidelines on contents of sugars, sodium, energy or trans-fats, so that products using the health claim can still be unhealthy in other aspects.
More problematic, for grain products that do not include a health claim, there are currently few regulations on what can be defined as WG, called a WG, or marketed as having or containing WG. Many products marketed as WG foods contain a mixture of WG, refined grains and sugars, with unknown relative proportions that are closely guarded as proprietary information by food manufacturers(7, Reference Jonnalagadda, Harnack and Liu10). The variety of terms used to describe ‘whole grains’ as well as the unclear and inconsistent labelling of WG ingredients by manufacturers make it challenging for consumers and organizations such as schools and workplaces to identify more healthful WG products(7, Reference Silverglade and Heller11, Reference Kantor, Variyam and Allshouse12). Thus, we aimed to determine the best identification criteria to assist consumers, food service personnel, and policy makers to select healthful WG products, for example to meet recommended dietary guidelines or programmatic requirements such as the new US National School Lunch Program Guidelines. Furthermore, the relative performance of these diverse identification criteria could be used to inform potential future WG labelling policy.
Several criteria have been proposed for identifying WG foods. One criterion, and the only one directly visible on food packages, is the Whole Grain stamp (WG-Stamp)(6). The WG-Stamp is a front-of-pack icon used in thirty-six countries worldwide and is promoted and regulated by a non-governmental organization with funding support from industry. The WG-Stamp is the most common front-of-package symbol dietitians report recommending to their clients as a reliable way to identify healthful WG products(Reference Latortue and Weber13). In addition, the USDA and the European Food Information Council recommend other criteria to help consumers and organizations identify WG products, each of which makes use of the ingredient list. Notably, even USDA guidance is inconsistent across publications, and at least three different criteria exist (Table 1, second to fourth criteria)(4, 14–16). The American Heart Association 2020 Strategic Impact Goals Committee also recently developed a criterion to define WG, based on the relative contents of total carbohydrate and fibre(Reference Lloyd-Jones, Hong and Labarthe17).
Table 1 Recommended criteria for identifying a grain product as ‘whole grain’

WGC, Whole Grain Council; USDA, US Department of Agriculture; FDA, Food and Drug Administration; AHA, American Heart Association.
Given the importance of identifying healthful WG foods, information is needed regarding the proportions of different grain products identified as WG by each of these criteria and, more importantly, their relative discrimination of health-related factors. If a metric identifies healthful WG foods but only a limited number of products meet the metric, then consumers and organizations (e.g. schools, workplaces) will have a relatively small selection of products to choose from and could also have trouble actually finding the healthful products in their stores or distributors. Conversely, if a metric identifies healthful WG foods and also includes many options, then this greater selection will make it more likely that consumers and organizations can find healthful WG products that they both prefer and are available to them. Most relevantly, it is unknown whether any of these metrics actually identify healthful WG products.
To elucidate these issues, we investigated how these five different recommended criteria to identify WG products compared in terms of distinguishing contents of dietary fibre, sugars, sodium, trans-fats and energy. Because a second potential limitation for people to consume more WG products may be perception of higher cost(Reference Kantor, Variyam and Allshouse12, Reference Chase, Reicks and Smith18, Reference Burgess-Champoux, Marquart and Vickers19), we also evaluated whether products identified as WG by each criterion were more expensive than non-WG options.
Methods
Identification of grain products
We found no single publicly available database providing information on all components required to define the different WG criteria, including nutrition content, detailed ingredient lists and presence or absence of the WG-Stamp on product packages. Thus, we collected data on grain products from the online websites of two of the largest US grocery stores: Wal-Mart (www.walmart.com) and Stop & Shop (www.peapod.com). We selected these chains based on their national sales volume as well as physical presence in the Boston area to facilitate our in-store visits for confirming the online data and for gathering data on price. We accessed the Wal-Mart and Stop & Shop websites from July 2010 to April 2011.
We searched the store websites for all products in eight categories of frequently consumed grains, including bread, bagels, English muffins, cereals, crackers, cereal bars, granola bars and chips(20). Because most cereals are consumed cold in the USA, we excluded cereals that are primarily served hot (e.g. oatmeal). We also excluded crackers that contained fillings or coatings (e.g. peanut butter, cheese or chocolate), that were served as a part of a lunch pack (e.g. Lunchables), that were targeted toward infants or toddlers (e.g. Zwieback), or that were part of a snack mix or assortment pack (e.g. Chex Mix).
Whole grain criteria
We evaluated five different criteria that have been recommended to help identify WG (Table 1). The first criterion is that products display the WG-Stamp, an icon set up by a non-governmental organization and supported by industry dues(6). To merit the WG-Stamp, US products must contain at least 8 g of WG per serving, as determined by each company's own check of its product formulations. Based on annual sales, companies pay between $US 1000 and $US 9000 in annual dues to be a member of the Whole Grain Council, and may include the stamp on any product that meets the 8 g WG/serving criterion(6). Three other criteria have been recommended by the USDA from Myplate.gov and/or the 2010 Dietary Guidelines for Americans to help consumers and organizations identify WG. These criteria define the WG products by the presence and location of WG in the ingredient list as well as – for one criterion – the absence of any added sugars. The USDA criteria include having a WG as the first ingredient (WG-first); a WG as the first ingredient without added sugars (WG-first-no-added-sugars); and the presence of the word ‘whole’ before any grain anywhere in the ingredient list (‘whole’-anywhere). We also evaluated a fifth criterion based on the ratio of total carbohydrate to fibre content of ≤10:1 (10:1-ratio; approximately equal to the carbohydrate to fibre content of whole wheat flour), as developed by the American Heart Association 2020 Strategic Impact Goals Committee for identifying WG foods. The ratio aims to capture the relative balance of WG v. both sugars and refined grains in a product(Reference Lloyd-Jones, Hong and Labarthe17).
Determination of whole grain criteria
For each grain product, we recorded the ingredients from each package into an electronic database including whether each product contained a WG as the first ingredient, added sugars(Reference Mozaffarian, Wiecha and Roth21) or any grain with the word ‘whole’ before it. WG ingredients were defined as any of the twenty-nine ingredients classified as WG in the USDA's Pyramid Servings Database, e.g. oats, whole wheat flour, brown rice flour, wheat bran, etc.(Reference Cleveland, Moshfegh and Albertson22). Added sugars included any of twenty-one ingredients as indicated by Myplate.gov, e.g. sugar, brown sugar, corn syrup, dextrose, etc.(23). For each product, we also recorded information from nutrient labels including grams of carbohydrate and fibre per serving, from which we calculated the total carbohydrate to fibre ratio of each product. We also recorded which product packages displayed the WG-Stamp based on the Whole Grains Council website, that lists all products utilizing the icon(6). When the same product was identified on both Stop & Shop and Wal-Mart websites, we used the Stop & Shop website as the primary source for collecting nutrition and ingredient information. When either nutrition or ingredient information was missing from websites, we obtained the missing information directly from product manufacturer's websites or from in-store visits(Reference Mozaffarian, Wiecha and Roth21).
Determination of outcomes
For each product we recorded information from nutrient labels to assess the healthfulness according to the five WG criteria. We recorded serving size, fibre (g/serving), sugar (g/serving), sodium (mg/serving) and energy (kJ/serving). We classified products as containing trans-fats if partially hydrogenated oils were in the ingredient list(Reference Mozaffarian, Wiecha and Roth21). We collected information on prices at Wal-Mart by direct visits to a store in the Boston area and at Stop & Shop by using peapod.com with a Boston zip code. We calculated price per serving by dividing the product price by the number of servings per container from the Nutrition Facts panel. For products available at both stores, we averaged the price per serving from each. To accurately determine standard product prices, we did not include sale prices of any products. To allow for potential differences in serving sizes between products, we also evaluated each outcome standardized to 1 oz, rather than per serving.
Statistical analysis
We first categorized all products into meeting or not meeting each WG criterion separately. For the analyses, we combined bread, bagels and English muffins into one grain group, and granola bars and cereal bars into another group, due to overlapping classification in the search methods and because of the similarity in these food types.
For each criterion, we used linear regression with each WG criterion as the independent variable, and fibre (g/serving), sugars (g/serving), sodium (mg/serving), energy (kJ/serving) and price ($US/serving) as dependent variables, to assess the extent to which each criterion was associated with these outcomes. We used robust error of variance in the regression to account for the non-normal distribution of the outcomes. For trans-fats, we used logistic regression because it was categorized as yes/no for each product. We performed sensitivity analyses evaluating the total carbohydrate to fibre ratio at other potential cut-off points (≤8:1, ≤5:1).
Because the WG-Stamp is a widely recognized and used front-of-package label and because the 10:1-ratio identified the most healthful products, we also investigated the independent effects of these two criteria to determine whether each criterion provided any additional independent value for identifying healthful WG products when the other criterion was already present. Products were classified into mutually exclusive indicator categories of meeting the WG-Stamp only, the 10:1-ratio only, both criteria, or neither criterion (reference category). The extent to which these joint categories were associated with the outcomes was evaluated using regression. We performed a similar analysis comparing the 10:1-ratio with WG-first, as the latter represented the most simple and practical among those criteria which utilize the ingredients list.
All major dietary guidelines recommend a minimum number of total daily servings of WG, rather than a minimum number of WG servings within any specific grain categories (e.g. breads, cereals, crackers, etc.). Thus, our primary analysis evaluated the relationship of each metric to our outcomes among all identified WG products. In secondary post hoc analyses, we evaluated these relationships stratified by each grain category separately.
We used the SAS statistical software package version 9·2 to conduct all analyses, two-tailed α = 0·05. The investigation was exempt from Human Subjects determination.
Results
We identified a total of 545 grain products, including 185 (33·9 %) breads, bagels or English muffins; 142 (26·1 %) cereals; 107 (19·6 %) crackers; sixty-three (11·6 %) granola or cereal bars; and forty-eight (8·8 %) chips. Products were represented from a range of national and subnational manufacturers, including major companies such as General Mills, Kelloggs, Stop & Shop, Great Value (Wal-Mart brand), Kashi, Nabisco, etc. (Supplementary Materials, Supplemental Table 1). Different proportions of grain products were classified as WG according to each criterion (Table 2). The least restrictive criterion was ‘whole’-anywhere, which identified 54·3 % of all products as WG, followed by the 10:1-ratio (40·7 %) and WG-first (40·0 %) criteria. The WG-Stamp and WG-first-no-added-sugars criterion were the most restrictive, identifying only 20·7 % and 16·9 % of products as WG, respectively.
Table 2 Classification of grain products as whole grain according to each whole grain criterionFootnote *: 545 grain products from two major grocery store chains, Boston, MA, USA, July 2010–April 2011
* See Table 1 for definition of criteria.
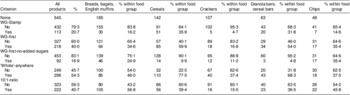
Across different food categories, cereals and granola/cereal bars were the food groups with the highest proportions of products meeting the WG-Stamp (cereals 35·9 %; granola/cereal bars 31·8 %), WG-first (cereals 59·9 %; granola/cereal bars 54·0 %) or ‘whole’-anywhere (cereals 77·5 %; granola/cereal bars 68·3 %). In comparison, only 16·2 % of bread products, 14·6 % of chips and 4·7 % of crackers were considered WG by the WG-Stamp. Chips (35·4 %) and breads (24·9 %) were the products with the highest proportions meeting the WG-first-no-added-sugars. Breads (56·8 %), chips (45·8 %) and cereals (39·4 %) most frequently met the 10:1-ratio.
We evaluated the average content of fibre, sugars, sodium, trans-fats and energy in products meeting v. not meeting each criterion. All five criteria identified products that contained more fibre per serving (Table 3). The largest difference in fibre content was for products meeting the 10:1-ratio, with 3·15 g/serving more than products that did not, a difference more than twofold greater than for any other criterion. The 10:1-ratio also identified products less likely to contain trans-fats (OR = 0·15; 95 % CI 0·08, 0·30; P < 0·0001), less sugar (−1·28 g/serving, P = 0·001), less sodium (−15·4 mg/serving, P = 0·001), and no energy differences. The WG-first-no-added-sugars criterion performed similarly to the 10:1-ratio with respect to sugars, energy and trans-fat, but such products did not contain less sodium and identified many fewer products compared with the 10:1-ratio (ninety-two products v. 222).
Table 3 Dietary fibre, sugars, sodium, total energy, trans-fats and price per serving of grain products by recommended whole grain criteriaFootnote *: 545 grain products from two major grocery store chains, Boston, MA, USA, July 2010–April 2011

* See Table 1 for definition of criteria.
† Values are means with their standard errors.
‡ Values are the percentage of products containing trans-fats, based on containing partially hydrogenated oils in the ingredient list, and the odds ratio and 95 % confidence interval for the comparison.
§ Average difference between grain product meeting v. not meeting the specified whole grain criterion.
Products meeting the WG-Stamp, WG-first or ‘whole’-anywhere criterion identified products with less sodium (ranging from −22·7 mg to −38·0 mg/serving; P < 0·01 for each), but more sugars and energy per serving. For example, the WG-Stamp identified products with 2·05 g more sugars/serving (P < 0·0001) and 44·4 more kJ/serving (P = 0·01) compared with products without the WG-Stamp. Among the five criteria, all except the ‘whole’-anywhere criterion identified products less likely to contain trans-fats (range OR = 0·14–0·33; P < 0·05 for each). Findings stratified by individual grain categories are presented in the Supplementary Materials.
When we evaluated average price, products were more expensive if they displayed the WG-Stamp (+$US 0·04/serving; P = 0·009) or met the 10:1-ratio (+$US 0·05/serving; P = 0·003). There were no significant price differences between products meeting or not meeting the other three criteria (Table 3).
When we evaluated potential alternative total carbohydrate to fibre ratios, products contained higher dietary fibre when they achieved the ≤8:1 ratio (+3·32 g/serving, P < 0·0001) or the ≤5:1 ratio (+4·33 g/serving, P < 0·0001), as well as less sugars (8:1-ratio: −1·26 g/serving, P = 0·002; 5:1-ratio: −1·54 g/serving, P = 0·0004). Compared with the 10:1-ratio, products identified by these alternative ratios contained similarly less sodium, and products were similarly less likely to contain trans-fats. Products meeting the 5:1-ratio also contained significantly less energy (−90·4 kJ/serving, P < 0·0001). Products meeting the 8:1- or 5:1-ratio were more expensive than products that did not (+$US 0·05/serving, P < 0·05 for each). As expected, these lower ratios were also increasingly more restrictive, with only 182 and seventy-two products meeting the 8:1- and 5:1-ratio cut-off points, respectively, compared with 222 products meeting the 10:1-ratio.
Overall, these findings suggested that the 10:1-ratio performed well, identifying products with more fibre, less sugars, that were less likely to contain trans-fats and with no increase in energy, and was not overly restrictive in the number of products identified. We therefore compared this criterion with the industry-sponsored WG-Stamp to determine their separate and combined effects (Table 4). Compared with products meeting neither criterion, products with only the WG-Stamp contained 0·63 g more fibre (P < 0·0001) but also 4·00 g more sugars (P < 0·0001) per serving, with borderline significance for more energy (+45·2 kJ/serving, P = 0·05). In contrast, products meeting only the 10:1-ratio had 3·21 g more fibre (P < 0·0001) and 1·19 g less sugars (P = 0·01) per serving. Products meeting both criteria had similarly higher fibre as products meeting the 10:1-ratio alone, but did not have less sugars (+0·19 g/serving, P = 0·74) or differences in energy. Thus, the presence of the WG-Stamp appeared to negate the benefit of less sugars among products meeting the 10:1-ratio only. Among all categories, products were lower in sodium and less likely to contain trans-fats (P < 0·05 for each). The average price of products in all three of these mutually exclusive categories was similarly higher than for products not meeting either criterion (+$US 0·06 and $US 0·07/serving, P < 0·05 for each).
Table 4 Difference in fibre, sugars, sodium, energy, trans-fats and price of products according to the WG-Stamp only, the 10:1-ratio only, both the WG-Stamp and the 10:1-ratio, or neither criterionFootnote *: 545 grain products from two major grocery store chains, Boston, MA, USA, July 2010–April 2011

* See Table 1 for definition of criteria.
† Values are mean differences with their standard errors compared with products meeting neither criterion.
‡ Values are odds ratios and 95 % confidence intervals compared with products meeting neither criterion.
We similarly compared the WG-first criterion with the 10:1-ratio to determine their separate and combined effects. Results were generally similar, with products meeting the 10:1-ratio alone having highest fibre and lowest sugars with no energy differences, products meeting the WG-first criterion alone having higher fibre but also higher sugars and energy, and products meeting both criteria having intermediate values, compared with products meeting neither (Supplementary Materials, Supplemental Table 2). All findings were similar when we evaluated contents of fibre, sugars, sodium and energy standardized to 1 oz servings (data not shown).
Discussion
We assessed five recommended WG criteria to determine which might best serve as a guideline for consumers as well as organizations such as schools and cafeterias to identify and select more healthful WG products. Overall, the 10:1-ratio appeared to be the best indicator, identifying foods with more fibre, less sugars and sodium, and less likely to contain trans-fats, without energy increases. The WG-first-no-added-sugars was useful in identifying products with more fibre and less sugars that were less likely to contain trans-fats, but was not associated with lower sodium and was more restrictive in terms of the number of products it identified. The industry-supported WG-Stamp and the USDA-recommended criteria for WG-first and ‘whole’-anywhere each identified products with more fibre and less sodium, but also more sugar and energy. The 10:1-ratio and WG-Stamp each identified products that were more expensive per serving.
Our analyses suggest that using several of the readily available or recommended information on product packages and ingredient listings to select healthful WG products may be misleading for consumers and organizations (e.g. schools, workplace cafeterias). Although individual contents of sugars, sodium, energy and trans-fat are contained on product nutrition facts panels in many countries, consumers find it challenging to synthesize and interpret such detailed products nutrition listings and rarely use them effectively(Reference Campos, Doxey and Hammond24–Reference Mozaffarian, Afshin and Benowitz26). Consequently, alternative and simpler methods are needed to assist consumers, food service personnel and policy makers in selecting healthful WG products that are higher in fibre and lower in sugars, sodium, trans-fats and energy. In addition, such metrics could be further codified as front-of-package labels or icons to make it easier to provide consumers and organizations with quick and accurate health guidance they can readily use. Our findings suggest that the 10:1-ratio might be the best single metric for these purposes. Given the surfeit of refined grains, starches and sugars in modern diets, identifying the best criteria to define carbohydrate quality and inform WG labelling policy, in conjunction with consumer education, is a key priority in the fields of nutrition and public health.
While the stated goal of the WG-Stamp is to help consumers identify WG products containing at least half a serving of WG, it also identified products that contain more sugars and energy, and at a higher price(Reference Silverglade and Heller11). The utility of the WG-Stamp as well as several of the USDA criteria may be limited by their lack of consideration of other components in each product, in particular contents of refined grains and sugars which have adverse physiological effects(Reference Mozaffarian, Appel and Van Horn1). The WG-Stamp is also the only criterion that is determined only by each food manufacturer's own assessments and willingness to pay a fee for its use. The WG-Stamp is a widely recognized front-of-package symbol, used on 7500 different products and seen by over two billion consumers worldwide in 2011 alone(6). Furthermore, 60 % of shoppers are aware of the WG-Stamp and shoppers report trusting it more than all other symbols except the Heart Check, USDA Organic Symbol and the standard recycling symbols(6). Our analysis indicates that consumers may be misled by the promised healthfulness that the symbol implies. Whether or not a product contains WG is just one measure of healthfulness, and other factors must be considered. For example, the WG-Stamp also identified products with significantly higher contents of sugars and energy, each of which are also important for health.
Among criteria recommended by the USDA, the ‘whole’-anywhere criterion (presence of any grain in the ingredient list preceded by the word ‘whole’) identified the greatest numbers of products as WG but was also relatively unhelpful for identifying healthful products. Because the word ‘whole’ can occur anywhere in the ingredient list, this criterion selected many products that are mostly refined grains with only small amounts of WG; it was also the only criterion that did not identify products less likely to contain trans-fats. In addition, this criterion may miss true WG products, as many such products may contain WG such as oats or barley that do not contain the word ‘whole’ before it. A second USDA-proposed metric, having WG as the first ingredient, identified products that contained higher sugars and energy than products not meeting this criterion. In contrast, identifying products by having WG as the first ingredient without added sugars performed relatively well for selecting more healthful products with respect to lower sugars and trans-fats and higher fibre. However, this criterion identified by far the fewest products (16·9 %) and also did not identify products containing significantly lower sodium. This criterion presents additional practical challenges by requiring consumers and organizations to review the ingredient list in detail to identify any one of at least twenty-nine types of WG as the first ingredient on the list while also looking for any one of twenty-one types of added sugars. As one example, distinguishing ‘wheat flour’ (a refined grain) from ‘whole wheat flour’ may be difficult for many consumers. Similarly, while some types of sugars are familiar to consumers (e.g. sugar, brown sugar) others are less common or disguised under more healthful-sounding names (e.g. brown rice syrup, fruit juice concentrate).
The 10:1-ratio, as a measure of total carbohydrate v. fibre, was proposed to implicitly incorporate both the WG content as well as additional contents of both sugars and refined grains in a product. This could best capture overall carbohydrate quality, particularly when the fibre content is derived from WG. This criterion identified products that were higher in fibre, lower in sugars and sodium, and also much less likely to contain trans-fats. Based on the nutrition facts panel alone, this ratio cannot distinguish between naturally occurring fibre from WG v. added bran alone, which may have less biological benefit compared with WG(Reference Jenkins, Kendall and Augustin27, Reference Jenkins, Kendall and McKeown-Eyssen28). If this ratio is considered for broader policy or labelling use in the future, it may be preferable to limit the amount of added bran that can contribute to its calculation. This would be facilitated by involvement of industry or regulatory policy, as such information is often proprietary and cannot be calculated based on the ingredient list or nutrition facts panel alone. Nevertheless, even without this additional information, the 10:1-ratio presently performs well in identifying grain foods with higher fibre, lower sugars, less sodium, less trans-fats and no additional energy. Although the information required for its calculation is readily visible on the Nutrition Facts panel and may be simpler than reviewing the detailed ingredient list to identify any one of numerous WG or added sugar ingredients, it still requires some maths which may be a challenge for some consumers. Future policy should consider the potential utility of this ratio in front-of-pack labelling for helping consumers and organizations identify more healthful grain options.
Four of the five WG criteria identified products with significantly lower sodium and trans-fats. Excess sodium consumption is a major cause of preventable deaths(Reference Danaei, Ding and Mozaffarian29) and average sodium consumption in the USA is more than double the recommended levels(Reference Roger, Go and Lloyd-Jones30). Thus, identification of healthier WG products that also contain lower sodium is important to improve individual and population health. Interestingly, while trans-fat consumption is estimated to have declined in the USA since 2000(Reference Vesper, Kuiper and Mirel31), many products still contain trans-fat. Our results indicate that about 16 % of grain products in the USA still contain industrial trans-fats from partially hydrogenated oils and that products identified as WG by most – although not all – WG metrics were much less likely to contain trans-fats.
Reasons for the observed price differences of products identified as WG by the WG-Stamp and 10:1-ratio are unknown. The 10:1-ratio identified more healthful products, which could increase price due to higher costs of using more healthful ingredients(Reference Adams and Engstrom32). The WG-Stamp requires industry evaluations of their products, potential product reformulations, industry dues, and costs of package design and labelling to promote the icon, which could be partly passed on to consumers. Our findings demonstrate modest price differences for these, but not the other WG criteria, highlighting the need for further research into reasons for these observed price differences. For WG-Stamp products, consumers are paying more for WG products and still consuming more sugars and energy. Although we found that price differences were relatively modest (+$US 0·04 and +$US 0·05/serving for the WG-Stamp and 10:1-ratio, respectively), this could potentially affect the selection of WG foods, especially in price-sensitive populations. Subsidies for development and sale of healthful WG products may be a useful incentive for companies to create more healthful options and for consumers to select these products and increase their WG intake.
Our analysis of 545 grain products based on standardized assessment of multiple data sources is a strength of the present study; no national data sets exist that have detailed information on specific grain products, nutrition and ingredient listings, presence of the WG-Stamp icon and price. Limitations of the analysis must also be considered. We assessed fibre, sugars, sodium, trans-fats and energy as health-related constituents of grain foods. Other constituents or characteristics may be relevant for health, such as germ content, glycaemic index/load or extent of processing, but we did not identify available product-specific data on these factors, nor is this type of health information available to consumers. For example, a product such as Wonderbread Whole Grain White® was identified as a WG based on all five criteria, but would have a relatively high glycaemic index due to extensive milling of the WG flour. We assessed products identified online and sold at two large national grocers rather than all nationally available products; however, the products sold by these two grocers are likely to include a significant range of grain products which would represent those available nationally. Product data were collected from July 2010 to April 2011, and ingredients and WG-Stamp status of individual products may have subsequently changed. Such reformulations might alter whether an individual product meets each WG criterion, but would be unlikely to alter the relative comparisons between different WG criteria. Finally, we collected price data only in Boston and not in other regions, so generalizability of the observed price differences should be confirmed in future analyses.
Conclusions
Our findings call into question the usefulness of the industry-supported WG-Stamp and several USDA-recommended criteria available to consumers and organizations to identify healthful WG products. A criterion based on a ratio of total carbohydrate to fibre ≤10:1 may represent a useful method for consumers, policy makers and organizations in identifying more healthful WG products.
Acknowledgements
Sources of funding: Activities were supported by gifts to the Harvard School of Public Health from the Donald and Sue Pritzker Nutrition and Fitness Initiative; funding from the Centers for Disease Control and Prevention (Prevention Research Centers Grant U48DP000064 including the Nutrition and Obesity Policy, Research and Evaluation Network to R.S.M., M.A.K., R.M.L. and S.L.G.); and grants from the New Balance Foundation, the National Institute of Diabetes and Digestive and Kidney Diseases (K24082730 to D.S.L.) and the National Heart, Lung, and Blood Institute, National Institutes of Health (R01 HL085710 to D.M.). This work is solely the responsibility of the authors and does not represent official views of the Centers for Disease Control and Prevention. Conflicts of interest: R.S.M., R.M.L., M.A.K., D.S.L. and S.L.G. had no conflicts of interest. D.M. received ad hoc travel reimbursement and/or honoraria from International Life Sciences Institute, Bunge and Nutrition Impact (modest), and ad hoc consulting fees from Foodminds and McKinsey Health Systems Institute (modest). Authors’ contributions: R.S.M., R.M.L., M.A.K., D.S.L., D.M. and S.L.G. designed the research plan, reviewed the article for intellectual content and wrote the manuscript; R.S.M. and M.A.K. conducted the research; R.S.M. analysed the data and performed the statistical analysis. R.S.M. and S.L.G. have responsibility for final content. All authors read and approved the final manuscript. Acknowledgements: The authors thank Analisa Andry and Arthur Sobol for their assistance and review of the SAS code.
Supplementary Materials
For Supplementary Materials for this article, please visit http://dx.doi.org/10.1017/S1368980012005447


