

A high-sodium diet is a primary risk factor for hypertension and CVD(Reference He and MacGregor1). According to the Institute of Medicine, teens and adults require approximately 1500 mg Na/d for optimal health(2). However, Canadians consume more than twice this amount – approximately 3400 mg Na – on a daily basis(3). This high sodium intake is predominantly due to the high levels of sodium present in the food supply rather than salt added by consumers(Reference Brown, Tzoulaki and Candeias4) and to food consumed outside the home(3). Many prepared or pre-packaged food products on the Canadian market contain more sodium per serving than an adult requires in an entire day. Given that CVD accounts for the death of more Canadians annually than any other disease(5), high-sodium diets represent a major public health challenge.
Nutrition labelling on pre-packaged foods has emerged as an important tool to communicate dietary information to consumers. In most jurisdictions, including Canada, nutrition facts appear on the side or back of packages. International evidence suggests that adding nutrition information to the front of the package, where it is more visible at the point of purchase, may be more effective at helping consumers make a healthy choice than the Nutrition Facts table or other back-of-package nutrition labels alone(Reference Scott and Worsley6–Reference Geiger, Wyse and Parent8). In fact, this strategy has been used as an effective component of sodium reduction campaigns in other countries. For instance, Finland and the UK have used front-of-package (FOP) labelling in conjunction with education, media campaigns and cooperation with the food industry in order to reduce the sodium consumption of their populations(Reference He and MacGregor9).
Although there are regulations surrounding the Nutrition Facts table and health claims on Canadian food products, FOP nutrition labels are currently unregulated(10). A range of health and nutrition logos currently appear on pre-packaged foods in Canada; however, this information is predominantly provided by manufacturers and is currently unregulated and lacks standardization, with the exception of specific health and nutrient content claims(11). As a result, consumers may be confused by the various implicit health claims that appear on Canadian food products(12). Indeed, a desire for clear and accessible nutrition labels has been expressed in qualitative studies(10). Research examining the effectiveness of various FOP labelling formats in other countries has demonstrated that FOP labelling designs such as the Guideline Daily Amount (GDA) or Traffic Light (TL) symbol can improve consumer understanding and influence product selection(Reference Feunekes, Gortemaker and Willems7, Reference Kelly, Hughes and Chapman13–Reference Jones and Richardson15). However, the effectiveness of these designs in comparison to other formats has not been examined in the Canadian context.
The current study sought to answer the following research objectives: (i) to determine the impact of FOP sodium labels on consumers’ selection of products low v. high in sodium; (ii) to examine perceptions of sodium labels in terms of consumer liking, believability, ease of understanding and overall effectiveness; and (iii) to determine the extent to which the impact of sodium labels varies as a function of sociodemographic and health-related factors.
Methods
Study design
A between-group experimental research study was conducted between November 2010 and June 2011. Study groups of up to ten people were conducted per night. Study groups were randomly assigned to view grocery products that displayed one of five types of FOP label (see below). The study was integrated into a larger study examining the influence of placing nutritional information on fast-food menus.Footnote * Upon completion of the larger study, participants were presented with two boxes of crackers and asked to select one of the boxes to take home as a free sample as a token of appreciation for completing the study. The two boxes included a high- and a low-sodium option, and displayed one of five FOP labels corresponding to the experimental condition (explained in further detail below under ‘Experimental conditions’).
Participants and recruitment
The study was conducted with 430 adults from the Waterloo Region, Ontario, Canada. Participants were recruited via advertisements posted in newspapers, buses and online, as well as at local farmers’ markets. Participants who expressed interest in the study were asked to provide their contact information and were later called by a research assistant and given more information on the study. Eligible participants were aged ≥18 years, able to speak and read English and had no food allergies to gluten or other grain products. Participants were told that the study was related to ‘lifestyles’ in the Waterloo Region; neither sodium nor product labelling was mentioned as a research focus to minimize self-selection bias. Participants received $CAN 20 as an incentive for completing the study. Ethics approval was provided by the Office of Research Ethics at the University of Waterloo. Informal pilot testing was conducted with approximately twenty participants in order to determine preferences on cracker box design and labelling formats.
Study protocol
All sessions occurred at 18.00 hours to eliminate time effects and to justify the offer of a free dinner for the larger menu labelling study. As part of this larger study, participants were given time to select and consume a free meal. Participants completed a questionnaire unrelated to nutrition that was not analysed in the current study, a sociodemographic questionnaire, as well as a ‘product selection task’ that served as the main behavioural outcome of the current study. A follow-up survey examining ratings and rankings of the experimental labels was administered immediately following the product selection task.
Experimental conditions
Figure 1 displays images of the experimental label conditions. The experimental FOP labels comprised approximately 10 % of the top-right corner of the box. The control condition included no FOP label. The remaining four conditions included: a basic FOP label with mg and per cent Daily Value (%DV) for sodium; an FOP label with added low and high content descriptors; a TL label with numeric information, content descriptors and colour coding; and a TL label with no numeric information. All boxes included the Nutrition Facts table on the side of the package, as per standard Canadian nutritional regulations (see Fig. 2).
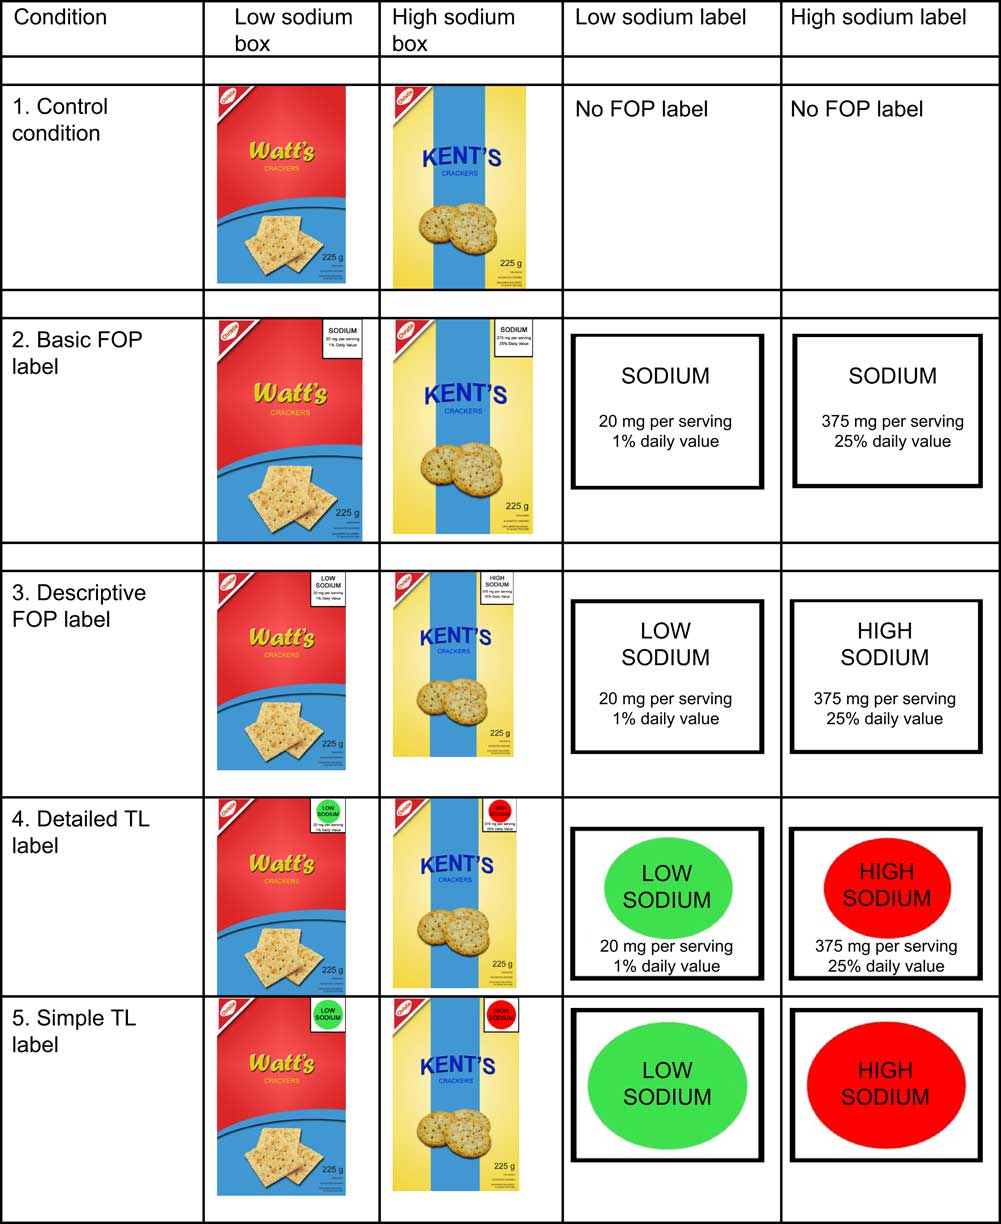
Fig. 1 (colour online) Cracker boxes and labels by experimental condition (FOP, front-of-package; TL, Traffic Light)

Fig. 2 Experimental Nutrition Facts panels
For each of the five experimental conditions, a low-sodium and a high-sodium product were tested. All low-sodium boxes listed 20 mg sodium (1 % DV) and high-sodium boxes listed 375 mg (25 % DV). As a result of pilot testing, the remaining nutrients were varied minimally to make the nutrition information seem more realistic. Two package designs and fictitious brand names were used in order to make the boxes look authentic: a yellow box (‘Kent's’) and a red box (‘Watt's’). The sodium levels (low v. high) were counterbalanced across the two package designs. Research assistants recorded participants’ product selection (low- v. high-sodium option), as well as whether participants picked up the box before selecting a product. Images of the experimental cracker boxes are shown in Fig. 1.
Measures
Selection of measures was guided by previous reviews of nutritional labelling and conceptual frameworks developed for understanding the impact of product labelling and health warnings(Reference Feunekes, Gortemaker and Willems7, 16).
Sociodemographic survey
A sociodemographic survey was administered prior to the product selection task. Questions included sex, age, presence of children under 18 years old in the home and ethnicity (recoded as 1 = white/Caucasian, 0 = other). Education level was measured on a 7-point scale (recoded as 1 = high school or less, 2 = some/completed college or university, 3 = graduate or professional school), and annual household income before tax was measured as a categorical variable (recoded as 1 = <$CAN 40 000; 2 = $CAN 40 000–79 999, 3 = ≥$CAN 80 000, 4 = prefer not to say). The survey also assessed self-reported general health (‘In general, would you say your health is…?’; 1 = poor to 5 = excellent)(17), perceived diet healthiness (‘How would you describe your overall diet?’; 1 = poor to 5 = excellent)(Reference Feunekes, Gortemaker and Willems7), frequency of eating outside the home (‘In a typical week, how often do you eat outside the home at a sit-down or fast-food restaurant?’; 1 = never to 5 = four or more times per week), self-reported nutritional knowledge (‘I am knowledgeable about health and nutrition issues’; 1 = strongly disagree to 5 = strongly agree)(Reference Feunekes, Gortemaker and Willems7) and dieting (‘During the past year, have you been on a diet (such as Weight Watchers, Atkins Diet, South Beach Diet, etc.) or actively tried to lose weight?’; 1 = no, 2 = yes, 3 = prefer not to say).
Product selection task
Participants were taken individually into a separate room and offered a choice between two boxes of crackers to take home as an incentive for participating in the larger study. They were told that the brands were currently being test-marketed by the manufacturer and that responses were being collected as feedback on consumer preferences. One box of crackers was higher in sodium and one was lower in sodium. The nutritional information appearing on the boxes was systematically altered according to one of five experimental conditions, described above.
Label ratings and rankings
A follow-up survey designed for the current study was administered after completion of the product selection task. Participants were shown an image of the experimental labels they saw during the behavioural selection task and asked to rate them on four measures: liking (‘How much do you like these nutrition labels?’), effectiveness (‘To what extent, if at all, do you think the type of information provided on these labels would help you choose healthier foods?’), understanding (‘How easy is it for you to understand the information provided by these labels?’) and believability (‘How believable are these labels, in your opinion?’). Each of the four items was scored on a 10-point Likert scale (1 = not at all to 10 = extremely). In the absence of any validated scales, these measures were created for the current study and modelled after those used in Feunekes et al. (2008)(Reference Feunekes, Gortemaker and Willems7). Participants in the control condition answered these questions in reference to the Nutrition Facts table, since this condition did not include an FOP label.
Finally, participants were shown all four experimental labels and asked to rank them in order of effectiveness at helping people select low-sodium products.
Support for front-of-pack labelling policy
Participants were also asked a question examining support for FOP labelling policy: ‘In your opinion, should the government require food companies to put nutrition information on the front of food packages?’ (0 = no, 1 = yes or maybe). This question was included in order to assess whether consumers would be generally opposed to, or supportive of, mandatory FOP labels on pre-packaged products.
Analysis
All analyses were conducted using the statistical software package IBM SPSS version 19·0. Regression models were used to examine differences between the five experimental conditions. Logistic regression models were used for binary outcomes and linear regression models were used for continuous outcomes. Odds ratios and Nagelkerke R 2 values are reported for all logistic regression models; unstandardized beta coefficients and adjusted R 2 values are reported for linear regression models. Experimental condition was coded as a categorical variable. All models were adjusted for the following five sociodemographic variables: age, sex, ethnicity, education and income. For behavioural outcomes, which were the primary research focus, nine diet- and health-related variables that were correlated with product selection outcomes (P < 0·10) were also added to the model: self-reported overall health, self-reported overall diet, frequency of eating outside the home, dieting, frequency of reading product labels, ‘usually’ looking for sodium on packages when grocery shopping, self-reported knowledge of health and nutrition issues, and two questions measuring understanding of the Nutrition Facts panel. Participants who did not select any crackers (n 9) were excluded from analyses of the behavioural task. Two-way interactions between experimental condition and each of the five sociodemographic variables were also tested. Interaction terms were included only if they were significant in the adjusted model and remained significant in the full model. No two-way interactions met these criteria.
Linear regression modelling was used to examine consumer ratings of the experimental labelling formats on four measures: (i) liking; (ii) effectiveness; (iii) understanding; and (iv) believability. The mean score from each of these four continuous variables served as the dependent variable in separate linear regression models, where experimental condition was the independent variable. Finally, the Friedman test was used to determine a mean rank for ranking of ‘overall effectiveness’ for each of the four FOP labelling formats (range = 1–4). Lower rankings indicate higher ratings of effectiveness (i.e. the lowest ranking denotes ‘most effective’).
Results
Sample characteristics
Table 1 presents the demographic characteristics of the sample (n 430). The χ 2 test was used to analyse possible differences in key sociodemographic factors between experimental conditions. No significant differences were observed between sociodemographic factors according to experimental condition (P > 0·05).
Table 1 Sample characteristics by randomly allocated study group: adults (n 430) aged ≥18 years, Waterloo, Ontario, Canada, November 2010–June 2011

FOP, front-of-package; TL, Traffic Light.
Behavioural outcomes
Product selection
Overall, 79·6 % of participants selected the low-sodium option. The proportion of individuals who chose the low-sodium option in each condition is displayed in Fig. 3. Logistic regression analyses were used to test the impact of experimental condition on product selection (where 0 = high sodium and 1 = low sodium). Results of the adjusted model (R 2 = 0·26) indicated that product selection varied significantly by experimental condition. Compared with the control group, those given the descriptive FOP (OR = 3·76, 95 % CI 1·46, 9·68, P = 0·006), detailed TL (OR = 2·44, 95 % CI 1·03, 5·80, P = 0·04) and simple TL labels (OR = 4·20, 95 % CI 1·52, 11·61, P = 0·006) were significantly more likely to choose the low-sodium product.

Fig. 3 Proportion of participants who selected the low-sodium product, by experimental condition: adults (n 421) aged ≥18 years, Waterloo, Ontario, Canada, November 2010–June 2011 (FOP, front-of-package; TL, Traffic Light)
Sex, age, ethnicity, education and income were not significant predictors of product selection. However, participants who reported ‘usually’ looking for sodium information when grocery shopping were significantly more likely to choose the low-sodium option compared with those who did not (OR = 3·00, 95 % CI 1·63, 5·53, P < 0·001). In addition, there was a trend whereby participants who reported eating outside the home more frequently were less likely to choose the low-sodium option than those who ate outside the home less frequently (OR = 0·76, 95 % CI 0·57, 1·00, P = 0·05). The remaining diet- and health-related variables were not associated with product selection.
Did the participant pick up the box?
Overall, 71·6 % of participants picked up at least one of the cracker boxes before making their product selection (n 308). Logistic regression analysis indicated that participants were significantly less likely to pick up the box when Kent's was the low-sodium option compared with when Watt's was the low-sodium option (OR = 0·65, 95 % CI 0·42, 1·00, P = 0·047). This variable was added to the regression model for subsequent analyses. Logistic regression analyses were used to test the impact of experimental condition on the proportion of participants who picked up the box before making their product selection (0 = no; 1 = yes). Results of the adjusted model (R 2 = 0·16) indicated that participants in the detailed TL and the simple TL conditions were significantly less likely to pick up the box compared with the control condition (62 %, OR = 0·42, 95 % CI 0·19, 0·89, P = 0·02 and 63 %, OR = 0·39, 95 % CI 0·18, 0·85, P = 0·02, respectively) and compared with the descriptive FOP condition (OR = 0·32, 95 % CI 0·15, 0·70, P = 0·005 and OR = 0·30, 95 % CI 0·13, 0·67, P = 0·003, respectively). In addition, participants with higher levels of self-reported overall health were significantly less likely to pick up the box than those with lower levels (OR = 0·66, 95 % CI 0·49, 0·89, P = 0·007).
Survey outcomes
Quantitative assessment of labels
Mean ratings for each FOP label condition on the four outcomes (liking, effectiveness of the label at helping choose healthier foods, understanding and believability) are shown in Table 2.
Table 2 Mean ratings (range = 1–10, low–high) of labelling formats and overall effectiveness ranking (range = 1–4, most effective–least effective): adults (n 430) aged ≥18 years, Waterloo, Ontario, Canada, November 2010–June 2011
FOP, front-of-package; TL, Traffic Light.
Liking. Results of the adjusted linear regression model (R 2 = 0·10) indicated that mean ratings for liking were significantly higher for the detailed TL label compared with both the basic FOP label (β = 0·85, 95 % CI 0·12, 1·59, P = 0·02) and the simple TL label (β = 0·83, 95 % CI 0·06, 1·60, P = 0·04). With regard to liking for labels overall, adults aged 35–64 years liked the labels significantly more than adults aged 18–24 years (β = 1·35, 95 % CI 0·68, 2·02, P < 0·001) and 25–34 years (β = 0·86, 95 % CI 0·17, 1·55, P = 0·02). Adults aged ≥65 years liked the labels significantly more overall compared with those aged 18–24 years (β = 2·41, 95 % CI 1·53, 3·28, P < 0·001), 25–34 years (β = 1·92, 95 % CI 1·03, 2·80, P < 0·001) and 35–64 years (β = 1·01, 95 % CI 0·32, 1·79, P = 0·005). Those in the middle income bracket rated the labels higher in liking compared with those in the lowest income bracket (β = 0·68, 95 % CI 0·05, 1·32, P = 0·04). Sex and ethnicity were not significant predictors in this model.
Effectiveness. Results of the adjusted model (R 2 = 0·03) indicated that mean ratings in effectiveness of the label at helping choose healthier foods were significantly higher for both the Nutrition Facts panel (β = 0·79, 95 % CI 0·16, 1·56, P = 0·045) and the detailed TL (β = 0·80, 95 % CI 0·04, 1·55, P = 0·04) compared with the simple TL label. Considering the effectiveness of labels overall, middle-aged adults (35–64 years) rated the labels significantly higher in effectiveness than adults aged 18–24 years (β = 0·74, 95 % CI 0·09, 1·40, P = 0·03). Adults aged ≥65 years rated the labels significantly higher in effectiveness than all adults: 18–24 years (β = 1·55, 95 % CI 0·69, 2·40, P < 0·001), 25–34 years (β = 1·20, 95 % CI 0·33, 2·06, P = 0·007) and 35–64 years (β = 0·81, 95 % CI 0·09, 1·53, P = 0·03). Sex, ethnicity, income and education were not significant predictors of effectiveness ratings.
Ease of understanding. Results of the adjusted model (R 2 = 0·01) indicated that ratings of ease of understanding the label were significantly higher for the detailed TL compared with the basic FOP label (β = 0·76, 95 % CI 0·12, 1·40, P = 0·02). Mean ratings for the remaining label conditions were not significantly different. Considering the ease of understanding of labels overall, those in the middle income bracket rated the labels significantly easier to understand compared with those in the lowest income bracket (β = 0·76, 95 % CI 0·21, 1·31, P = 0·007). Sex, ethnicity and education were not significant predictors of overall ratings of understanding.
Believability. Results of the adjusted model (R 2 = 0·01) indicated that mean ratings for believability were lower for the simple TL label compared with all other formats: the Nutrition Facts panel (β = −1·12, 95 % CI −1·86, −0·37, P = 0·003), the descriptive FOP label (β = −0·97, 95 % CI −1·70, −0·24, P = 0·009), the detailed TL label (β = −0·98, 95 % CI −1·71, −0·25, P = 0·008) and the basic FOP label, which verged on significance (β = −0·70, 95 % CI −1·41, 0·01, P = 0·05). Sex, ethnicity, age, education and income were not significant predictors of ratings of label believability.
Rankings. Mean effectiveness rankings for the four labelling formats are shown in Table 2. The detailed TL was ranked as the most effective, followed by the descriptive FOP label. The Friedman test indicated a statistically significant difference between the four rankings overall, χ 2(3) = 539·107, P < 0·001. Post hoc tests were conducted using the Wilcoxon signed-rank test, in order to determine whether mean rankings were significantly different from each other. Results indicated that differences in ranking between all contrasts were statistically significant (P < 0·001 for all contrasts).
Support for labelling policy
Results indicated that 42·2 % of participants responded ‘yes’ to the question regarding support for FOP labelling policy; 24·5 % responded ‘maybe’ and 33·3 % responded ‘no’. Responses of ‘yes’ or ‘maybe’ (66·7 %) were combined for analysis purposes. Results of the logistic regression model (R 2 = 0·09) indicated that older adults aged 35–64 and ≥65 years were significantly more likely to be supportive compared with younger adults aged 18–24 years (OR = 2·53, 95 % CI 1·42, 4·50, P = 0·002 and OR = 5·20, 95 % CI 2·20, 12·27, P < 0·001, respectively) and 25–34 years (OR = 1·99, 95 % CI 1·12, 3·56, P = 0·02 and OR = 4·10, 95 % CI 1·76, 9·56, P = 0·001, respectively). Those in the lowest income bracket were also significantly more likely to support FOP labelling policy than those in the highest income bracket (OR = 1·90, 95 % CI 1·04, 3·46, P = 0·04).
Discussion
The present study is the first to our knowledge to experimentally test the impact of FOP sodium content labels among Canadians. The findings indicate that the FOP labels with ‘high/low’ sodium content descriptors were more effective at guiding product selection than those without descriptors. Labelling with traffic lights also appears to be effective: both the detailed and simple TL labels led to the selection of lower-sodium choices. Participants in these TL conditions were also significantly less likely to pick up the box and seek out more information before making their product selection, compared with the control and descriptive FOP conditions. The red and green colour coding, which signifies high and low amounts of a nutrient, seems to be intuitive to consumers. These results are consistent with previous studies showing that the TL symbol increases consumer use and understanding(Reference Kelly, Hughes and Chapman13, Reference Borgmeier and Westenhoefer14, 18), allows consumers to retrieve nutrition information more efficiently(Reference Jones and Richardson15), and that the multiple TL label is effective at helping consumers identify healthy foods(Reference Kelly, Hughes and Chapman13, Reference Borgmeier and Westenhoefer14). Interestingly, even though the simple TL symbol v. control was more highly significantly associated with low-sodium product selection behaviour than the detailed TL symbol v. control (P < 0·006 v. P < 0·04, respectively), the detailed TL was perceived more favourably. The detailed TL scored highly on all survey ratings (including liking, effectiveness, understanding and believability) whereas the simple TL logo did not appear to fare as well, albeit rated by different participants. When perceptions of all experimental formats were evaluated in all participants, the detailed TL was ranked most effective at helping consumers choose low-sodium products and the simple TL was rated least believable. This may be due to the fact that the simple TL lacked numeric information. Participants may have regarded the simple TL as a health claim or logo added by the manufacturer rather than a trustworthy source of nutrition information. Including supplemental educational materials relating to TL labelling might address this issue.
Overall, it seems that while both TL labels may help consumers choose healthier products, consumers preferred the detailed TL label, which included more numeric information. On the whole, findings suggest that content descriptors, symbols and colour coding add prescriptive value, and may ‘qualify’ nutrient information and improve consumer understanding of nutrient amounts. This is generally consistent with the Institute of Medicine report on FOP labelling, which recommends the use of a ‘star’ system, in which one of the stars reflects sodium levels(19).
Another important finding was that none of the main sociodemographic variables were associated with product selection. Given that numerous studies have documented lower use and understanding of nutrition labels in groups of varying education and income levels(Reference Arthur, Chamberlain and Howard20–Reference Blitstein and Evans23), the absence of differences in product selection among these groups is notable. The results suggest that FOP labels featuring content descriptors and/or TL may address the disparity in the use and understanding of nutrition labels across various socio-economic groups. This is presumably because the prescriptive information included in these labels (i.e. content descriptors, colours and symbols) does not require numeracy skills for comprehension.
Finally, about two-thirds of participants were supportive of FOP labelling policy, which is consistent with previous research indicating that consumers desire simpler, FOP nutrition labels(10, Reference Kelly, Hughes and Chapman13, 18). Further, the wording of this question may have affected responses; more participants may have expressed a desire for FOP labelling if the phrase ‘government require’ had not been specifically mentioned. Results also suggest that older and less financially privileged individuals may be particularly receptive to FOP labelling initiatives. Considering the well-documented association between health and socio-economic status(Reference Adler, Boyce and Chesney24), this is an important and encouraging finding.
Study limitations
The sample was not a probability-based sample and was somewhat more educated than the demographic information from the same Region, as measured by the 2006 Canadian Census(25). This difference could be due to a self-selection bias in which more educated individuals were more likely to volunteer their time to complete a research study. However, an effort was made to recruit participants from a variety of sources and sample characteristics revealed a fairly even distribution of income levels. Furthermore, product selection did not differ significantly by education or income, indicating that a different distribution of participants may have had little effect on the pattern of results.
The behavioural selection task was also subject to limitations. Only one type of product was used to test product selection. Research suggests that consumers tend to look at nutrition labels more often when buying products that are perceived to be generally healthy (such as yoghurt) and less often when purchasing indulgence products (such as chocolate bars)(Reference Grunert, Wills and Fernández-Celemín26). Crackers were selected for the selection task since they typically fall within the ‘mid-range’ in nutritional value compared with other packaged snack foods. Nevertheless, results might differ if a different product was used and could differ in a grocery shopping v. experimental context. Second, since the study aimed to address the issue of excess sodium consumption in Canada, sodium alone was tested on the front of the package. Different results might be obtained if other key nutrients (e.g. calories, fat, sugar) were included. For example, adding other nutrients has the potential to reduce the influence of sodium information in particular, given the potential for competing information, such as where one product may have lower sodium but higher levels of fat, for example. Alternatively, adding other nutrients may increase the overall use and salience of FOP labels. These results therefore might not be fully generalizable to other settings or products. Future studies could test the impact of FOP labelling on different products and/or feature more than one nutrient on the front of the package.
Conclusions
The current study adds to the evidence from the UK(Reference He and MacGregor9, Reference Mohan, Campbell and Willis27), Finland(Reference Mohan, Campbell and Willis27, Reference Karppanen and Mervaala28) and New Zealand(Reference Young and Swinburn29) on the efficacy of FOP labelling. The findings have policy implications, both for a Canadian sodium reduction strategy and for FOP nutrition labelling in general. Improved labelling for sodium is one of the key recommendations issued from the Sodium Working Group convened by Health Canada, with a specific call for FOP labelling, as well as recommendations from the US Institute of Medicine(19, 30). The current study suggests that improvements to the nutrition labelling system in Canada should incorporate standardized FOP labelling to increase consumer awareness of sodium levels and that the use of colour coding and content descriptors (e.g. ‘low’, ‘medium’, ‘high’) would help to improve consumer use and understanding of this information. Enhanced sodium labelling may also promote healthier product reformulation: international evidence suggests that manufacturers often reduce the sodium levels of their products in response to mandatory FOP sodium content labels(Reference Karppanen and Mervaala28, Reference Young and Swinburn29).
Acknowledgements
Source of funding: This study was funded by a research grant from the Canadian Cancer Society Research Institute. Scholarship funding was provided by an Ontario Graduate Scholarship (S.G.), a Canadian Institutes for Health Research (CIHR) Master's Award (S.G.) and a Population Interventions for Chronic Disease Prevention (PICDP) Training Grant funded by CIHR, the Heart and Stroke Foundation of Canada and the Propel Centre for Population Health Impact at the University of Waterloo (S.G.). Funding was also provided by a CIHR New Investigator Award (D.H.) and a Canadian Cancer Society Research Institute Junior Investigator Award (D.H.). Conflicts of interest: The authors have no conflicts of interest to report. Authors’ contributions: Data collection and analyses were conducted by S.G. and D.H., as well as a team of research assistants, and Ms Samantha Daniels, who acted as the project manager and supervised research assistants. R.H. collaborated with D.H. in writing the research grant. R.H. and J.S. provided advice and expertise on nutrition-related matters and study methods, and reviewed the manuscript.


