


Despite a tremendous research effort, substantial questions still remain about when, where and how obesity matters as a driver of mortality( Reference Levine 1 , Reference Greenberg, Fontaine and Allison 2 ). For estimating the burden of obesity on health, the majority of studies have been done in high-income countries and have most frequently used only single measurements of obesity (measured as current BMI) that are typically taken in middle to later life( Reference Flegal, Carroll and Ogden 3 , Reference Allison, Fontaine and Manson 4 ). Using nationally representative data in the USA, work has shown that maximum lifetime body weight is the best predictor of mortality risk, as opposed to the weight that was measured at a particular point in time( Reference Stokes and Preston 5 ). A critical contributing factor to this finding was that associations with mortality were attenuated among individuals who had dramatic weight loss due to illness prior to death, which is reflected in a point-in-time measure but not in maximum lifetime body weight. A small number of studies have suggested that earlier-life measures of weight are also relevant for predicting biological risk factors for CVD( Reference Montonen, Boeing and Schleicher 6 ), particularly for cholesterol( Reference Alley and Chang 7 ). Further understanding of which measures of body weight predict later-life biomarkers risk factors will help to understand the biological pathways of how life-course weight measures correlate with mortality.
The effect of BMI on later health outcomes such as mortality and CVD has most commonly been examined from the perspective of BMI at early ages. Obesity in early childhood or adolescence is similarly predictive of adverse health outcomes later in life( Reference Hoffmans, Kromhout and de Lezenne Coulander 8 – Reference Gunnell, Frankel and Nanchahal 10 ). Under the cumulative disadvantage theory, which posits that the disadvantages of obesity accumulate over time, it may be expected that high BMI in early adulthood or at any point in the life course may also impact later health( Reference Ferraro and Kelley-Moore 11 ). High BMI at age 25 years has been associated with increased functional limitations and mortality in both men and women more than 25 years later( Reference Houston, Ding and Nicklas 12 , Reference Stevens, Truesdale and Wang 13 ).
Our current analysis addresses methodological and substantive questions that build on the current evidence base. First, is current BMI, BMI early in life (at age 25 years) or maximum lifetime BMI the most important predictor of biomarkers later in life? Second, are the associations between these multiple measures of adiposity universal across context as biological risks (as theorized currently in the literature), or might these associations be explained by confounding or effect modification that differs between countries? While infrequently investigated due to lack of comparable data, prior studies of demographic relationships with risk biomarkers have revealed suprising differences across context( Reference Davis, Williams and Oganov 14 ).
The collection of comparable nationally representative data in the USA and Costa Rica allows us to examine whether our findings are consistent across place. In the USA, social class is strongly and negatively correlated with obesity (less obesity at higher social classes), particularly among women, while in Costa Rica there is no association among women and a positive (more obesity at higher clases) association among men( Reference Rehkopf, Dow and Rosero-Bixby 15 ). If universal associations between body weight measures across the life course are found to exist in both contexts, this evidence would further support the hypothesis that associations found in the USA and other high-income countries with strong social class gradients in obesity may be biologically universal. Alternatively, if associations differ in Costa Rica, it may call into question the fundamental biological relationships between life-course weight and biological risk factors for CVD.
Methods
Samples
Data from Costa Rica are from the Costa Rican Study on Longevity and Healthy Aging (CRELES), a longitudinal, nationally representative, probabilistic sample of adults aged 60 years or over selected from the 2000 census database. A selected sub-sample of this population (1329 men, 1498 women) with over-sampling of the oldest old completed an in-depth survey in their household from November 2004 to September 2006, which is the basis of the analytic sample for our analyses. This sub-sample was drawn from a larger number of individuals selected from the 2000 census with the following non-response rates: 19 % of individuals were deceased by the contact date, 18 % could not be found, 2 % had moved and 4 % rejected the interview. Among those interviewed, 95 % provided a fasting blood sample. Data from the USA are from the National Health and Nutrition Examination Survey (NHANES) 1999–2004, restricted to adults aged 60 years or over (2411 men, 3196 women). These cross-sectional data are representative of the non-institutionalized population of the USA. Due to missing data on self-reported weight at age 25 years and maximum lifetime weight, the total analytic sample is 821 in Costa Rica and 4110 in the USA.
Measures
Exposure
BMI was calculated from weight and height. All analyses relied on currently measured height. Current weight was both measured and self-reported. Weight at age 25 years and maximum lifetime weight were self-reported. We also calculated change in weight over two periods of time: between maximum weight and current weight, and between age-25 weight and current weight. Of the samples, 3·5 % in Costa Rica and 4·1 % in the USA attained their maximum weight before the age of 25 years; 28 % of the sample was at their maximum weight currently in Costa Rica and 24 % of the sample in the USA.
Outcomes
Systolic blood pressure, glycosylated Hb (HbA1c), HDL-cholesterol and TAG were measured similarly in each sample, with details described elsewhere( Reference Rehkopf, Dow and Rosero-Bixby 15 ).
Potential confounders
Since the absolute level of educational attainment has different social and economic meaning in each country, it does not make sense to use the same categories of education in each country. For Costa Rica, educational attainment was categorized into three groups: less than 3 years of education, from 3 to 6 years of education (elementary school comprises six grades) and at least 1 year of high school. For the USA, we use the educational categories of less than high school, high school and greater than high school. In both NHANES and CRELES, current smoking was assessed by the question, ‘Do you smoke now?’ In CRELES, sedentary behaviour was defined as participants responding ‘no’ to the question, ‘In the last 12 months, did you exercise regularly or do other physical rigorous activities like sports, jogging, dancing or heavy work, three times a week?’ In NHANES, sedentary behaviour was assessed by whether individuals reported physical activity fewer than thirteen times in the last 30 d and answered ‘no’ to the question of ‘Do you do heavy work or carry heavy loads?’ as an average level of physical activity each day.
Models
Figures present unadjusted associations from generalized additive models using penalized regression splines( Reference Wood 16 ). Ordinary least-squares regression models were then used to examine the association between the multiple measures of BMI and the four biomarkers of focus, controlling for potential confounding factors. In addition to the variables controlled for shown, all models contain the additional covariates not shown: age, age squared, Hispanic (USA only), Black (USA only), gender, age-by-gender interaction, education (as three indicator variables), wealth (income in USA), foreign born, current smoker and physically active. There is not an equivalently important race or ethnicity variable in Costa Rica similar to those used in the USA, the most relevant characteristics are captured by foreign born, which is used in models in both contexts. Because wealth data are not available in NHANES in the USA, we use the poverty income ratio instead, as a continuous measure that ranges from 0 to 5, where all individuals with a ratio of greater than 5 are set to 5. To examine the extent to which the associations are due to levels of current weight, the ‘+current BMI’ is an identical model but additionally controls for current measured BMI. All analyses accounted for over-sampling and clustered sampling using the ‘survey’ package in the statistical software package Stata version 11. Sampling weights were used along with clustering at the primary sampling unit level (n 49) in NHANES and at the health area level in CRELES (n 60).
Our primary modeling strategy is to examine each of the three BMI measurements (current, age 25 and maximum) in separate models. These models are our primary focus for inference because they avoid collinearity between BMI measures and avoid controlling for measures of BMI that come after other measures. However, we also fit two other types of models as a secondary focus. First, we fit models additionally including current BMI, even though it is likely on the causal pathway between early BMI and contemporaneous biomarker measurements. We fit these models because it is of substantive interest to understand whether BMI measures earlier in the life course are associated with variation in biomarker outcomes independent of current BMI, since most literature focuses on current measures of BMI. Finally, based on a similar rationale, we fit models with all three BMI measurements in the model. In each of these secondary models, while there is a potential for collinearity, the reasonable widths of our confidence intervals suggest that this is not empirically a problem with our estimates, even as results must be interpreted with caution. Thus, while the primary models are the focus of inference, when results are consistent across models this provides additional justification for the potential importance of measures of BMI that occur at age 25 years or at maximum BMI.
An earlier analysis of the effect of baseline BMI and waist circumference on 3-year prospective mortality in older Costa Ricans showed that the relationship depends on age( Reference Rosero Bixby, Brenes-Chamacho and Mendez-Chacon 17 ). This age modification of the relationship between BMI and mortality is similarly observed in the USA( Reference Flegal, Carroll and Ogden 3 ). Based on this, we examine whether we find effect modification (interaction) in the BMI–biomarker relationship by age strata (60–74 years, 75 years or older). We also examine effect modification by gender given different levels of biomarkers.
Results
Descriptive
Table 1 shows means or column percentages of the Costa Rican and US full population samples as compared with the analytic sample on which we have all observations of BMI at age 25 years, maximum BMI and current BMI. In both the Costa Rican and US samples, the demographic composition of the population is similar, albeit with fewer individuals over the age of 85 years in the analytic sample, particularly in Costa Rica. Therefore, caution should be taken for generalizing our findings to the population aged 85 years or older. There are also some differences in distribution of education, but these differences are of less concern due to the different categories used in each country. Overall, there is a dramatic difference in the level of being physically active in Costa Rica as compared with the USA. Levels of BMI and the outcomes we examine are nearly identical between the full samples and the analytic sample, and levels are very similar overall between Costa Rica and the USA. Tables S1 and S2 (see online supplementary material) show Pearson correlation coefficients of the relationships between different measures of BMI in Costa Rica and the USA by gender. There is a stronger association between self-reported BMI and measured BMI in the USA compared with Costa Rica. There is also a stronger correlation between maximum BMI and current BMI in the USA.
Table 1 Demographic and health-related characteristics, comparing the full sample with the analytic sample, among nationally representative samples of adults aged 60 years or over from Costa Rica and the USA

Data are from the Costa Rican Study on Longevity and Healthy Aging (CRELES), November 2004–September 2006 and the US National Health and Nutrition Examination Survey (NHANES) 1999–2004.
Data presented are means or column percentages.
Figure 1 shows the unadjusted associations between current measured BMI (yellow line), age-25 BMI (dark green line) and maximum BMI (olive green line) with the four biomarkers of cardiovascular risk. Shaded regions show 95 % CI around the plotted relationship. There is no meaningful relationship between all three BMI measures and systolic blood pressure in Costa Rica, and there is a weak and similar relationship with all three measures in the USA. For HbA1c, there is a stronger relationship with both current and maximum BMI in Costa Rica, but the strongest relationship is with age-25 BMI in the USA. There are higher levels of TAG with current and maximum BMI in Costa Rica and the USA. Finally, for HDL-cholesterol, there are lower (worse) levels with higher current and maximum BMI in both countries, but these relationships are stronger in the USA.
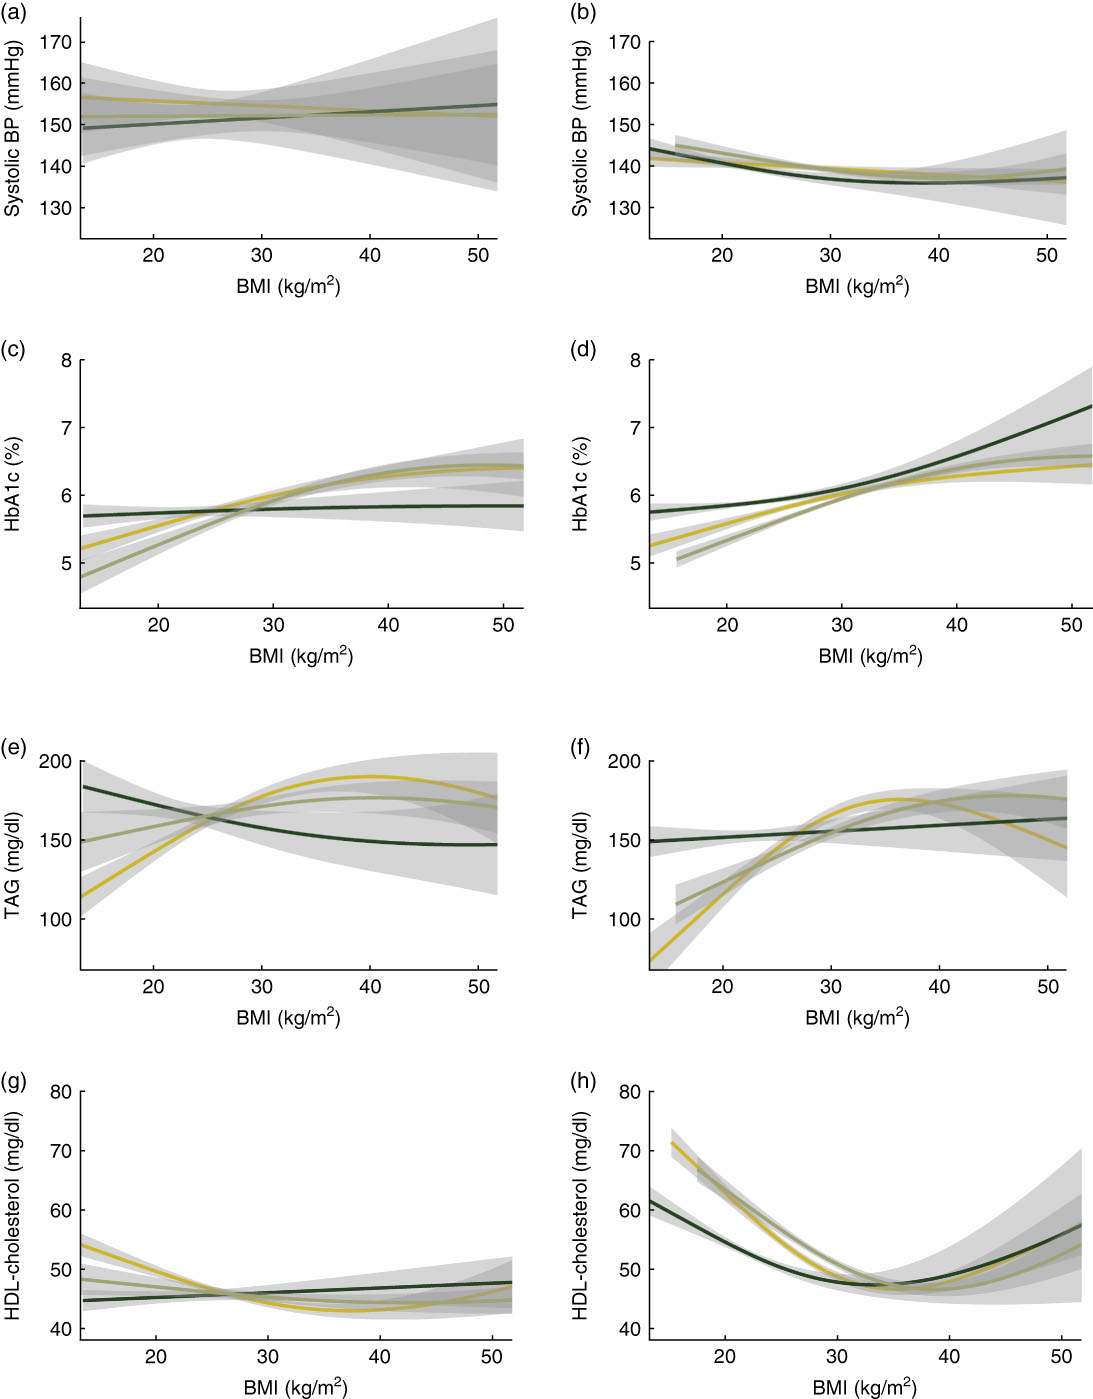
Fig. 1 Plots showing unadjusted associations of current measured BMI (![]() ), age-25 BMI (
), age-25 BMI (![]() ) and maximum BMI (
) and maximum BMI (![]() ) with four biomarkers of cardiovascular risk: (a, b) systolic blood pressure (BP), (c, d) glycosylated Hb (HbA1c), (e, f) TAG and (g, h) HDL-cholesterol, among nationally representative samples of adults aged 60 years or over from Costa Rica (a, c, e, g) and the USA (b, d, f, h). Shaded regions show 95 % CI around the plotted associations. Data are from the Costa Rican Study on Longevity and Healthy Aging (CRELES), November 2004–September 2006 (n 821) and the US National Health and Nutrition Examination Survey (NHANES) 1999–2004 (n 4110)
) with four biomarkers of cardiovascular risk: (a, b) systolic blood pressure (BP), (c, d) glycosylated Hb (HbA1c), (e, f) TAG and (g, h) HDL-cholesterol, among nationally representative samples of adults aged 60 years or over from Costa Rica (a, c, e, g) and the USA (b, d, f, h). Shaded regions show 95 % CI around the plotted associations. Data are from the Costa Rican Study on Longevity and Healthy Aging (CRELES), November 2004–September 2006 (n 821) and the US National Health and Nutrition Examination Survey (NHANES) 1999–2004 (n 4110)
Figure 2 shows the unadjusted associations between currently measured BMI and the four biomarkers of focus. Each plot shows the relationship stratified by age and gender: men aged ≥75 years (yellow line), men aged 60–74 years (dark green line), women aged ≥75 years (olive green line), women aged 60–74 years (medium green line). Shaded regions show 95 % CI around the plotted relationship. In both Costa Rica and the USA, the unadjusted relationship between current measured BMI and systolic blood pressure is fairly weak, with little evidence of an association within any of the age and gender subgroups. There is evidence of a more substantial relationship between BMI and HbA1c, which does not differ substantially by subgroup, although there is evidence for a slightly stronger relationship among men age 60–74 years in the USA. For TAG, there is some evidence of a stronger relationship with current BMI among men and women aged 60–74 years, in both Costa Rica and the USA. Finally, for HDL-cholesterol, there appear to be gender differences in the association in both Costa Rica and the USA, with a given level of BMI associated with lower HDL-cholesterol among men as compared with women, even as the shape and direction of the association (higher BMI associated with lower HDL-cholesterol) was generally consistent across gender.
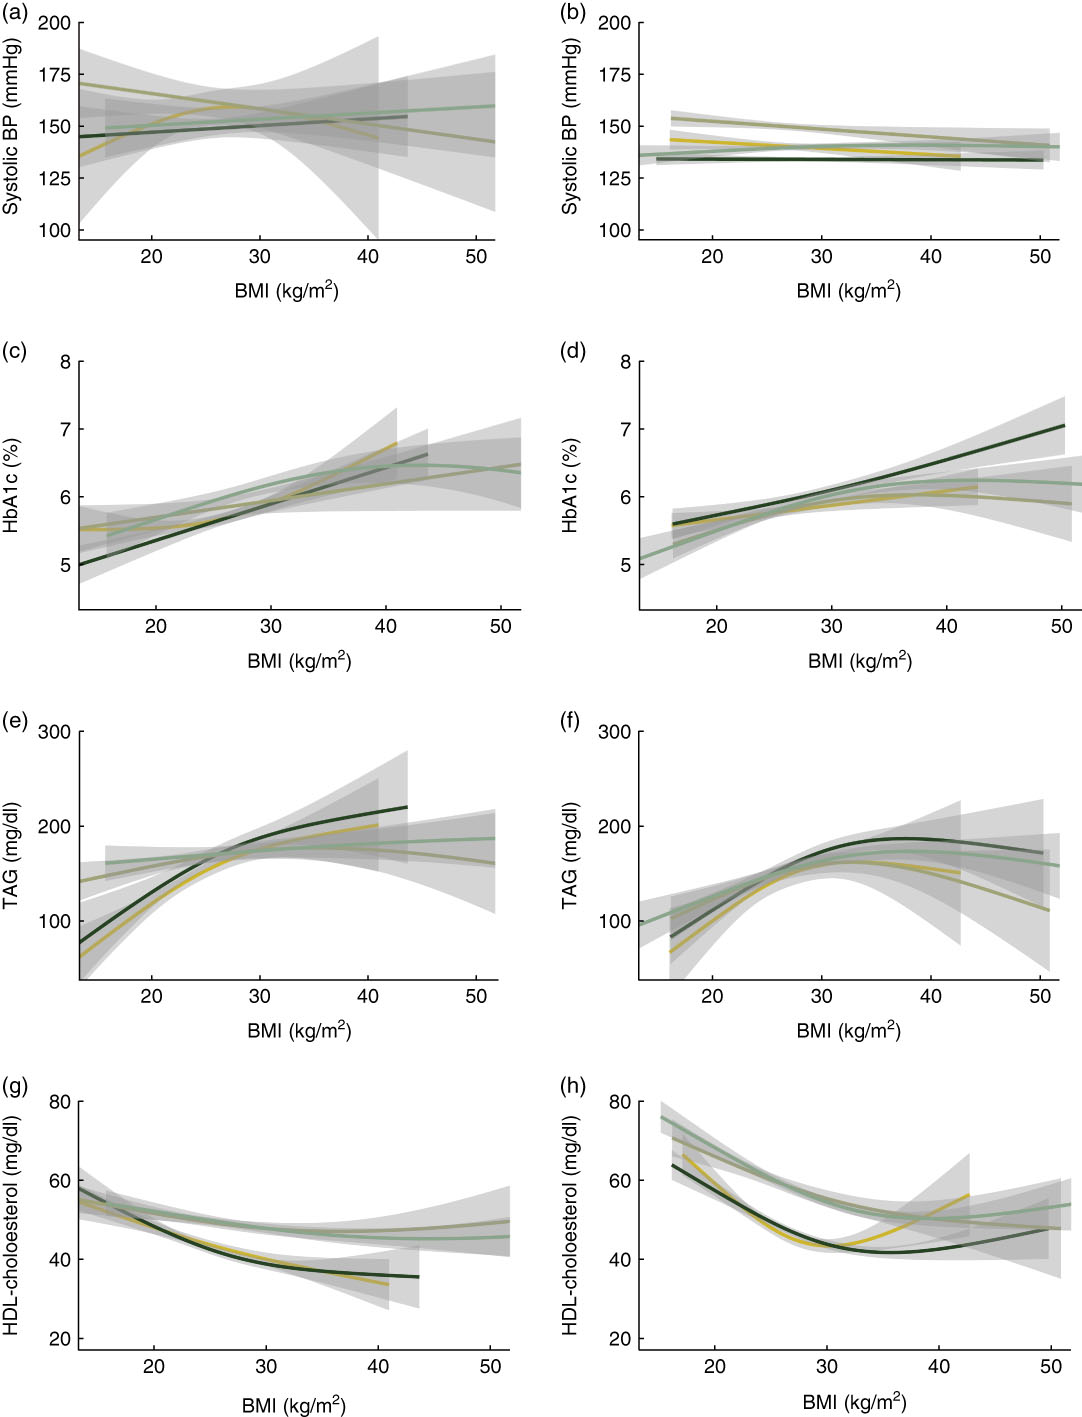
Fig. 2 Plots showing the unadjusted associations between currently measured BMI and the four biomarkers of focus: (a, b) systolic blood pressure (BP), (c, d) glycosylated Hb (HbA1c), (e, f) TAG and (g, h) HDL-cholesterol, among nationally representative samples of adults aged 60 years or over from Costa Rica (a, c, e, g) and the USA (b, d, f, h). Each plot shows the relationship stratified by age and gender: men aged ≥75 years (![]() ), men aged 60–74 years (
), men aged 60–74 years (![]() ), women aged ≥75 years (
), women aged ≥75 years (![]() ) and women aged 60–74 years (
) and women aged 60–74 years (![]() ). Shaded regions show 95 % CI around the plotted associations. Smoothed estimates are from generalized additive models. Data are from the Costa Rican Study on Longevity and Healthy Aging (CRELES), November 2004–September 2006 (n 821) and the US National Health and Nutrition Examination Survey (NHANES) 1999–2004 (n 4110)
). Shaded regions show 95 % CI around the plotted associations. Smoothed estimates are from generalized additive models. Data are from the Costa Rican Study on Longevity and Healthy Aging (CRELES), November 2004–September 2006 (n 821) and the US National Health and Nutrition Examination Survey (NHANES) 1999–2004 (n 4110)
Primary models of different measurements of BMI
Table 2 presents the results of five models for each biomarker, for each country, a total of forty models. Model 1 presents current BMI as the primary predictor of interest, model 2 presents age-25 BMI and model 3 presents maximum BMI. Only the primary coefficient of interpretation from each model is presented, but each of the models also includes the covariates: age, age squared, Hispanic (USA only), Black (USA only), gender, age-by-gender interaction, education (as three indicator variables), wealth (income in USA), foreign born, current smoker and physically active. These are the primary models for inference because they do not include multiple measures of BMI which may be on the causal pathway or may be too collinear to disentangle associations. In addition, the coefficients shown in the second and fourth rows of the results for each biomarker, labelled ‘+current BMI’, also include current measured BMI (in all models except for model 1, which already presents current BMI). Models 1 and 3 also include age-25 BMI since it occurs prior to current and maximum BMI and is a potential confounder. Statistically significant associations (P<0·05) are shown in bold.
Table 2 Ordinary least-squares regression models of correlation between BMI measures and current levels of biomarkers among nationally representative samples of adults aged 60 years or over from Costa Rica and the USA

Data are from the Costa Rican Study on Longevity and Healthy Aging (CRELES), November 2004–September 2006 and the US National Health and Nutrition Examination Survey (NHANES) 1999–2004.
Confidence intervals that do not include the null are indicated in bold. All models contain the following additional covariates not shown: age, age squared, Hispanic (USA only), Black (USA only), education (as three indicator variables), wealth (income in USA), foreign born, current smoker, physically active and age-25 BMI. The ‘+current BMI’ is an identical model but additionally controls for currently measured BMI.
The most consistent associations observed are that current BMI is the strongest predictor of levels of biomarkers, and these associations are consistent between the USA and Costa Rica. However, for HbA1c and for HDL-cholesterol, there are also strong and consistent relationships with maximum BMI. For HbA1c these assocations are not markedly diminished even after controlling for current levels of BMI. In the USA only, there are associations between age-25 BMI and HbA1c, and an inverse association with TAG when controlling for current BMI. In addition, maximum BMI has a positive association with TAG in the USA, but an inverse association in Costa Rica after controlling for current BMI.
Table 3 presents results that include all three measures of BMI in the same model. This is the same model presented in Table 2 for maximum BMI with current BMI, but in Table 3 we present all three coefficients from each of these models. Results are generally consistent with our interpretations of the Table 2 data, but these full models show that HbA1c is more strongly associated with maximum BMI than it is with current BMI. While these coefficients should be interpreted cautiously due to causal ordering of BMI measures and potential collinearity, the similarity of coefficients as compared with the models shown in Table 2 supports the relevance of age-25 and maximum BMI to current measures of cardiovascular risk biomarkers.
Table 3 Ordinary least-squares regression models of correlation between BMI measures and current levels of biomarkers, with all measures of BMI in the same model, among nationally representative samples of adults aged 60 years or over from Costa Rica and the USA

Data are from the Costa Rican Study on Longevity and Healthy Aging (CRELES), November 2004–September 2006 and the US National Health and Nutrition Examination Survey (NHANES) 1999–2004.
Confidence intervals that do not include the null are indicated in bold. All models contain the additional covariates not shown: age, age squared, Hispanic (USA only), Black (USA only), education (as three indicator variables), wealth (income in USA), foreign born, current smoker and physically active.
Differences in the associations by age and gender
We additionally fit the full models (with all three measures of BMI) including interaction terms between BMI and age (<75 years v. ≥75 years) and between BMI and gender. We examined interactions in each of our three main models, for four outcomes in two countries, for a total of twenty-four interactions with age and twenty-four interactions with gender. We used a P value significance threshold of α=0·10 as a guideline for reporting stratified models, while acknowledging that we would identify four models to stratify by chance alone. There were some differences by age and gender, although none of these differences were larger in terms of magnitude or direction, and there were not consistent patterns in these interactions, for example assocations did not tend to be stronger for younger individuals or a particular gender, although there were four by gender in the USA as compared with two in Costa Rica. We found four terms that met this criterion in Costa Rica, and seven interactions in the USA, slightly more than what we would find by chance alone.
In Costa Rica, for the association between current BMI and HbA1c, the association in the full model was 0·0074 (95 % CI −0·025, 0·040) among those under the age of 75 years, but 0·053 (95 % CI 0·031, 0·076) among those over the age of 75 years. For the association between current BMI and TAG, the association was 5·7 (95 % CI 2·0, 9·3) among men and 2·4 (95 % CI 0·74, 4·2) among women. For the association between current BMI and HDL-cholesterol, the association was −1·1 (95 % CI −1·5, −0·66) among men and −0·19 (95 % CI −0·47, 0·093) among women.
In the USA, for the association between maximum BMI and HbA1c, it was 0·016 (95 % CI −0·0092, 0·042) for those aged 75 years or over, and 0·056 (95 % CI 0·030, 0·080) for those under age 75 years; while for HDL-cholesterol it was −0·36 (95 % CI −1·1, 0·35) and 0·24 (95 % CI −0·067, 0·55) for the corresponding age groups. For the association between systolic blood pressure and early BMI, it was −0·28 (95 % CI −0·68, 0·13) among men and 0·23 (95 % CI −0·16, 0·61) among women. For the association between HbA1c and maximum BMI, it was 0·07 (95 % CI 0·05, 0·10) among men and 0·032 (95 % CI 0·012, 0·053) among women. For the association between TAG and current BMI, it was 6·0 (95 % CI 2·6, 9·3) among men and 2·5 (95 % CI 1·3, 3·6) among women. Finally, for the the association of HDL-cholesterol with maximum BMI it was 0·32 (95 % CI 0·037, 0·60) among men and −0·11 (95 % CI −0·43, 0·22) among women, and with current BMI, it was −1·0 (95 % CI −1·3, −0·68) among men and −0·73 (95 % CI −1·1, −0·40) among women.
Discussion
In testing competing theories of the importance of life-course BMI impacts on contemporaneous levels of cardiovascular risk markers, we find support for the importance of maximum lifetime BMI in both Costa Rica and the USA, but these relationships differ depending on the CHD risk biomarker examined. The most important and consistent predictor of current levels of systolic blood pressure, TAG and HDL-cholesterol is current BMI. However, maximum BMI is the strongest predictor of HbA1c and is also related to HDL-cholesterol and to a lesser extent TAG. For HbA1c, this association is independent of current BMI. There were neither consistent nor strong associations with biomarkers and BMI at the age of 25 years. It is useful to note that the relationship between BMI and the four biomarkers examined did not differ substantially or consistently between age 60–74 years as compared with age 75 years or above, as can be assessed visually in the descriptive plots in Fig. 2 and by the magnitude of the interactions we report in the text.
The greatest limitation of our analysis is that we do not have measured weight across participant ages, but instead must rely on participant recall. It is unknown whether this recall is differential or non-differential, and it is not possible to test this empirically without a validation sample. If non-differential, we would expect that this would be a conservative bias of the association of age-25 BMI and maximum BMI on the examined biomarker outcomes. If differential, it is unknown in which direction the coefficients of association would be biased. Despite this limitation, we believe that this bias is not likely to be severe. First, prior work has found that recall of earlier-life weight is more accurate than one might expect( Reference Houston, Ding and Nicklas 18 ). In particular, one study determined that while the average self-reported weight of women at age 18 years was marginally lower than their measured weight at that age, women generally recalled their weight with a fair degree of accuracy, with a correlation greater than 0·8 between recalled and measured past weight and BMI( Reference van Dam, Willett and Manson 19 ). An additional validation study on recall of early-life weights showed that correlation between actual and recalled weight is 0·73 for men and 0·74 for women( Reference Perry, Byers and Mokdad 20 ). With respect to the potential differential nature of the bias, we control for a substantial number of demographic factors in all models that may be associated with any tendency to over- or under-report weight. Finally, we also fit models controlling for current weight, arguably the factor that may be most correlated with misreporting of prior weight. Thus, for our results that include age-25 BMI or maximum BMI to have a non-conservative bias, differential reporting must be conditional on a large number of demographic factors and current weight, which we believe to be unlikely. This is particularly a strong argument because the outcomes we examine are not self-reported but are the result of biological tests. While sensitivity analyses of differential and non-differential misclassification would offer additional support for this, the current state of development of these methods limits them to dichotomous exposures or models that do not control for covariates( Reference Fox, Lash and Greenland 21 – Reference Lash and Silliman 23 ). A further limitation is that we had a large number of missing observations of self-reported age-25 BMI and maximum lifetime BMI, so our findings may not be generalizable to the population. However, as shown in Table 1, the characteristics of the full population and the population examined here are very similar.
While our models statistically controlled for measures of socio-economic position in both contexts as potential confounding factors, future work should investigate the role that social exposures play in life-course determinants of obesity. This ideally should be investigated in studies with multiple measures of obesity and social measures over time given the potential for causality to run in both directions( Reference Kawachi, Adler and Dow 24 , Reference Rehkopf, Dow and Gruenwald 25 ).
We found unexpected inverse associations for age-25 BMI and TAG levels in the USA, and maximum BMI levels and TAG levels in Costa Rica, when controlling for current BMI. That is, only when conditional on current BMI, higher levels of BMI were associated with lower levels of TAG. This is unlikely to be explained by collinearity as levels of each of these covariates were not highly enough correlated (see online supplementary material, Tables S1 and S2). These findings should be interpreted cautiously, however, because they are from models controlling for current BMI, which is a strong correlate of TAG level, and on the causal pathway between the exposures and outcome. Analysis of these relationships in other data sets is required as we did not observe similar associations in Costa Rica and the USA, so it is unclear how generalizable these findings are.
Our findings using biomarkers support work that finds maximum lifetime BMI to be a key determinant of mortality( Reference Stokes and Preston 5 ), as well as work that shows BMI change in early to middle adulthood is associated with greater chronic disease risk later in life( Reference Zheng, Manson and Yuan 26 ). Although we did not test it in the present study, our findings are consistent with known cardiovascular risk markers underlying this relationship. Our conclusions are also consistent with prior work in the USA that showed most of the relationship between biomarkers and obesity was due to current BMI, with similar findings that there were some associations with HbA1c that were not explained by current BMI( Reference Dowd and Zajacova 27 ). Our comparative work builds to show similar findings in Costa Rica as well as also incorporating a consideration of maximum BMI. Our primarily null finding regarding age-25 BMI suggests that this factor is not important for later-life levels of biomarkers and may be less important to consider in future work as compared with the burden of maximum lifetime BMI. The population health implications of our findings support continued efforts to manage BMI across the life course given the longer-term health risks associated with maximum lifetime BMI. Future studies of the population impact of obesity should include measures of maximum lifetime BMI.
Acknowledgements
Financial support: The CRELES project (Costa Rican Study of Longevity and Healthy Aging) is a longitudinal study of the Universidad de Costa Rica, carried out by the Centro Centroamericano de Población in collaboration with the Instituto de Investigaciones en Salud, with the support of the Wellcome Trust Foundation (grant number 072406). D.H.R. is supported by the National Institute of Aging (grant number K01AG047280). The funding agencies had no rule in the design, analysis or writing of this article. Conflict of interest: The authors declared no conflicts of interest. Authorship: W.H.D. and L.R.-B. designed the CRELES study. W.H.D., L.R-B. and D.H.R. developed the study question and analysis approach. D.H.R. and A.D. analysed the data. D.H.R. drafted the manuscript. All authors were involved in interpreting results, editing the manuscript for content and approved the final version of the manuscript. Ethics of human subject participation: This study was conducted according to the guidelines laid down in the Declaration of Helsinki and all procedures involving human subjects were approved by the University of Costa Rica’s Committee on Ethics and Science (Comité Etico-Científico). Written informed consent was obtained from all subjects.
Supplementary material
To view supplementary material for this article, please visit https://doi.org/10.1017/S1368980018002276


