The relationship between gestational weight gain (GWG) and infant birth weight is well documented( Reference Rasmussen and Yaktine 1 – Reference Pugh, Albert and Kim 3 ). In underweight, normal-weight and overweight women, GWG below recommendations is associated with small-for-gestational-age birth weight while excess GWG is associated with large-for-gestational-age birth weight( Reference Rasmussen and Yaktine 1 , Reference Ludwig and Currie 4 ). However, both GWG and birth weight are non-specific measures of maternal nutritional status and fetal size. They provide little insight into the extent to which the composition of maternal gains is associated with neonatal size and body composition. For example, GWG does not distinguish gains in maternal lean mass from gains in fat mass, each of which may be differentially associated with fetal growth and body composition( Reference Catalano, Mele and Landon 5 ). Similarly, birth weight does not adequately distinguish between neonatal fat and lean mass. As small- and large-for-gestational-age infants are at increased risk for short- and long-term risks of obesity, metabolic disorders( Reference Sewell, Huston-Presley and Super 6 , Reference Catalano, Farrell and Thomas 7 ) and cognitive health( Reference Dewey and Begum 8 ), understanding whether specific parameters of maternal weight gain impact neonatal body composition is important to inform future clinical guidance to prevent adverse birth weight and longer-term outcomes.
Some investigators have studied relationships of the total change in maternal fat and lean mass with birth weight( Reference Villar, Cogswell and Kestler 9 – Reference Hediger, Scholl and Schall 11 ) or of GWG with neonatal lean and fat mass( Reference Catalano, Mele and Landon 5 , Reference Hediger, Scholl and Schall 11 , Reference Crozier, Inskip and Godfrey 12 ), but the association of readily assessable longitudinal changes in maternal body composition with neonatal body composition is unknown. Longitudinal changes may provide additional insight beyond total GWG alone based on the timing of maternal anthropometric changes. Maternal fat mass typically increases in mid-gestation with increased insulin sensitivity( Reference Catalano, Tyzbir and Wolfe 13 ), then decreases late in gestation with a slowing insulin response( Reference Butte 14 , Reference Pitkin 15 ). The decreased insulin sensitivity is hypothesized to occur to mobilize maternal fat stores to support rapid fetal growth towards the end of gestation, when maternal nutritional intake alone would be insufficient( Reference Hediger, Scholl and Schall 11 ). Diverging from this process may impact the appropriate accumulation of fetal fat and fat-free mass( Reference Catalano, Farrell and Thomas 7 ). Therefore, components of GWG may provide a more sensitive and specific marker of infants at risk for inadequate or excessive birth weight.
Our objectives were to estimate the association of longitudinal changes in maternal anthropometric measures with neonatal body composition and birth weight, and to assess to what extent late-gestational changes in maternal anthropometry are associated with neonatal body composition and size.
Methods
The Eunice Kennedy Shriver National Institute of Child Health and Human Development (NICHD) Fetal Growth Studies–Singletons was a prospective cohort study of 2334 non-obese pregnant women aged 18–40 years recruited from twelve US sites between July 2009 and January 2013. Low-risk, non-obese healthy women with spontaneously conceived pregnancies of <14 weeks’ gestation who were at no obvious risk for fetal growth restriction or overgrowth were selected for inclusion. Additional exclusion criteria included smoking, pre-gestational diabetes, chronic renal disease under medical supervision, autoimmune disease, psychiatric disorders, cancer and HIV/AIDS( Reference Buck Louis, Grewal and Albert 16 , Reference Grewal, Grantz and Zhang 17 ).
At enrolment between 8 weeks 0 d and 13 weeks 6 d, research nurses conducted in-person interviews to obtain detailed demographic and health characteristics. Women were randomized into one of four follow-up schedules starting at 15 weeks to capture weekly data without subjecting each woman to weekly follow-up visits( Reference Buck Louis, Grewal and Albert 16 ). Ultrasound examinations were performed to collect fetal biometric measurements, including head circumference, abdominal circumference and femur length, that were then used to calculate estimated fetal weight( Reference Hadlock, Harrist and Carpenter 18 ).
GWG was calculated as the difference between maternal weight and self-reported pre-pregnancy weight. Maternal weight was measured at each study visit without shoes or excessive clothing using a beam balance or digital scale. Antenatal weights from clinical visits were also abstracted from prenatal records. We included all weights (i.e. those measured at both routine prenatal and study visits) to increase the number of weight measurements per woman for improved precision of maternal weight gain estimates and trajectories. We plotted individual women’s weight change trajectory using all weights to ensure abstracted weights fell within plausible ranges when plotted with study-visit weights. If a chart-abstracted and study-visit measured weight occurred on the same day, we included only the measured weight (n 2169 duplicate weights out of 45 540, 4·7 %). Height was measured using a portable stadiometer (Seca Corporation, Hanover, MD, USA) and along with self-reported pre-pregnancy weight was used to calculate pre-pregnancy BMI (kg/m2).
Research staff also collected additional maternal anthropometric measures at each of the five study visits. Mid-upper arm circumference was measured using a non-stretchable linen tape to the nearest 0·1 cm. The triceps skinfold was measured at the point of the mid-upper arm circumference and subscapular skinfold was measured at a 45° incline at the site inferior to the inferior angle of the scapula using the Lange skinfold calliper (Beta Technology, Inc., Santa Cruz, CA, USA).
Neonatal measurements were collected after delivery. Length was measured using a Seca 416 infantometer and weight was measured using an infant beam-balance scale or an infant electronic (digital) scale. Neonatal abdominal flank skinfold was measured at midaxillary line just above the crest of the right ilium using a Lange skinfold calliper (Beta Technology, Inc.). We calculated neonatal lean and fat mass using the following validated equations( Reference Catalano, Thomas and Avallone 19 ):
 $$\eqalign{ {\rm Fat \,\,mass}{\equals}& {\rm 0\cdot}{\rm 39055}{\times}{\rm birth\,\, weight \;(kg)}\cr &{\plus}{\rm 0\cdot}{\rm 0453}{\times}{\rm abdominal\,\, flank \,\,(cm)} \, \amp \cr &\,{\minus}{\rm 0\cdot}{\rm 03237}{\times}{\rm length \,\,(cm)}{\plus}{\rm 0\cdot}{\rm 5465,} $$
 $${\rm Lean \,\,mass}{\equals}{\rm birth \,\,weight \,\,(kg)}{\minus}{\rm fat \,\,mass \,\,(kg)}$$
and
 $${\rm Fat \,\,percentage}{\equals}{{{\rm fat \,\,mass \,\,(kg)}} \over {{\rm birth \,\,weight \,\,(kg)}}}{\times}{\rm 100}{\rm .}$$
All maternal and neonatal anthropometric sites were measured in duplicate and average readings were used for analysis. If the second measure differed by a pre-specified value( Reference Johnson, Engstrom and Gelhar 20 , Reference Ulijaszek and Kerr 21 ), specific to each anthropometric measure, a third measure was performed and the average of the two closest measurements was used.
Statistical analysis
In our analytic sample of 2334 women, we excluded a total of 423 (18·1 %) observations due to the following reasons: loss to follow-up (n 157, 6·7 %), use of non-study approved callipers (n 160, 6·8 %; one site), miscarriage or termination (n 12, 0·51 %), stillbirth (n 11, 0·47 %), congenital malformations (n 63, 2·6 %), birth weight <2000 g (n 11, 0·47 %) and implausible neonatal length values (n 9, 0·39 %). The final sample included 1911 women. The relationships of longitudinal changes in maternal mid-upper arm circumference, subscapular skinfold, triceps skinfold, arm muscle and arm fat areas with neonatal lean mass, fat mass, fat percentage and birth weight were analysed in two steps. In the first step, longitudinal trajectories of maternal anthropometry were assessed by fitting separate linear mixed models to each measure. We included terms for fixed and random effects to allow for estimation of the overall mean and individual trajectories, respectively, across gestation. For both the fixed and random effects, all linear mixed models included a quadratic term for gestational age to allow for model flexibility, selected based on the lowest Bayesian information criterion indicating model fit. We estimated individual anthropometric measures at 15, 28 and 40 weeks, and calculated the rate of change in each measure for the second (15–28 weeks) and third (28–40 weeks) trimesters. The cut-off point of 15 weeks was selected since there were no study visits at 14 weeks. Also, we divided the third-trimester rates of gain into tertiles (<33rd and ≥66th percentiles) to assess to what extent rates of change in the lower or upper tertile were associated with neonatal size and body composition. In the second step, we used linear regression to assess the change in maternal anthropometry estimated at specific gestational ages based on the above model in relation to neonatal lean mass, fat mass, fat percentage and birth weight. We adjusted for maternal race, infant sex, parity, age, height, pre-pregnancy BMI, income, education, gestational age at delivery, baseline maternal anthropometry value and the number days after delivery neonates were measured.
Separate trajectories for GWG were calculated using linear mixed models, as described above, to provide a comparison for individual anthropometric measures. Estimated fetal weight trajectories were also calculated using linear mixed models. In a secondary analysis, we eliminated part of the inherent correlation between GWG and fetal size by subtracting estimated fetal weight from maternal weight for a measure of net GWG. In an effort to isolate the association between maternal anthropometry and neonatal fat mass, independent of birth weight, we conducted sensitivity analyses accounting for neonatal size (i.e. birth weight). Due to the high correlation between birth weight and neonatal fat mass (0·84), we performed the regression of birth weight v. fat mass to obtain the residuals and used the residuals as the outcome in analyses with maternal anthropometry. Analyses were repeated after removing births <39 weeks’ gestation to determine if the trajectories were biased by earlier deliveries. To ensure that the observed relationships were not a function of the equations used to calculate neonatal lean and fat mass, we repeated the analyses using individual neonatal measures (length and abdominal flank skinfold). We tested for differences in the association between the rate of change in maternal anthropometry and neonatal anthropometry by maternal pre-pregnancy BMI, race and the second-trimester rate of change (third-trimester models only). Analyses were conducted using the statistical software packages SAS version 9.4 and Stata version 13.0.
Results
The majority of women were married, had an income >$US 50 000, 49·5 % were nulliparous and 50·3 % were 20–29 years of age. The racial/ethnic distribution included 28·8 % non-Hispanic White, 29·8 % Hispanic, and 21·4 and 20·0 % of non-Hispanic Black and Asian women, respectively (Table 1).
Table 1 Demographic characteristics of study participants; non-obese women with singleton pregnancies (n 1911) from twelve US sites, Eunice Kennedy Shriver National Institute of Child Health and Human Development (NICHD) Fetal Growth Studies–Singletons cohort (2009–2013)
IQR, interquartile range.
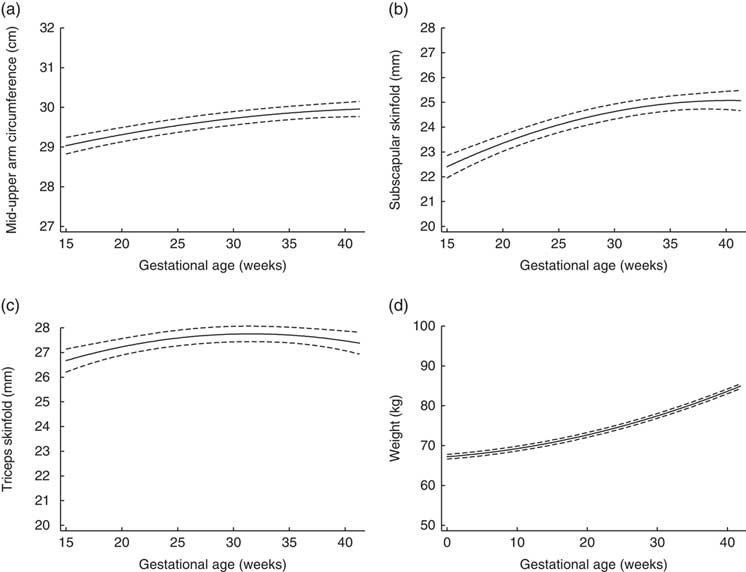
Figure 1 depicts the estimated trajectories for each maternal anthropometric measure. Mid-upper arm circumference, subscapular skinfold and triceps skinfold all increased from 15 to 28 weeks. From 28 to 40 weeks, the trajectory for mid-upper arm circumference increased slightly (median (interquartile range) total change=0·39 (0·12, 0·64) cm; Table 2), while triceps skinfold increased only until about 28 weeks (median (interquartile range) change=1·02 (0·21, 1·91) cm), then had a plateau that was followed by a slight decrease until 40 weeks (median (interquartile range) change=−0·003 (−0·08, 0·08) cm).

Fig. 1 Trajectories estimated using linear mixed models for maternal (a) mid-upper arm circumference, (b) subscapular skinfold, (c) triceps skinfold and (d) weight, from 15 to 40 weeks’ gestation, in non-obese women with singleton pregnancies (n 1911) from twelve US sites, Eunice Kennedy Shriver National Institute of Child Health and Human Development (NICHD) Fetal Growth Studies–Singletons cohort (2009–2013). ——— indicates the estimated average trajectory and – – – – – indicate the 95 % confidence interval
Table 2 Distribution of the total change in maternal anthropometry measures by the second trimester and late gestation, and of neonatal anthropometry measures at birth, in non-obese women with singleton pregnancies (n 1911) from twelve US sites, Eunice Kennedy Shriver National Institute of Child Health and Human Development (NICHD) Fetal Growth Studies–Singletons cohort (2009–2013)
† Fat mass=0·39055×birth weight (kg)+0·0453×abdominal flank (cm)−0·03237×length (cm)+0·5465.
‡ Lean mass=birth weight (kg)−fat mass (kg).
§ Fat percentage=fat mass (kg)/birth weight (kg)×100.
The rate of change of various maternal anthropometric measures in the second (15 to 28 weeks) and third trimesters (28 to 40 weeks) were differentially associated with neonatal body composition (Table 3). Changes in maternal mid-upper arm circumference and triceps skinfold, but not subscapular skinfold, were associated with neonatal anthropometry. Specifically, a faster rate of increase in triceps skinfold in both the second (β=−15·9, 95 % CI −27·1, −4·74 g) and third trimester (β=−13·1, 95 % CI −22·7, −3·37 g) was associated with decreased neonatal lean mass. In the third trimester, a faster rate of increase in mid-upper arm circumference (β=−28·1, 95 % CI −60·2, −4·13 g) was also associated with decreased neonatal lean mass. In comparison, an increase in the rate of change in maternal weight was consistently associated with an increase in all of the neonatal anthropometric measures including lean mass, fat mass and birth weight, although the magnitude of the association was slightly reduced after fetal size was subtracted from maternal weight (net GWG change).
Table 3 Association between the rate of change in maternal anthropometry and neonatal anthropometryFootnote † in non-obese women with singleton pregnancies (n 1911) recruited from twelve US sites, Eunice Kennedy Shriver National Institute of Child Health and Human Development (NICHD) Fetal Growth Studies–Singletons cohort (2009–2013)

*P<0·05.
† Values are beta coefficients and 95 % CI; adjusted for race, infant sex, parity, age, height, pre-pregnancy BMI, gestational age at delivery, neonatal measurement date and baseline anthropometry value; neonatal lean mass, fat mass and fat percentage (n 1698), birth weight (n 1759).
‡ Calculated as the difference between maternal weight and estimated fetal weight.
Since late-gestational changes in maternal anthropometric measures may indicate the mobilization of nutrient stores for fetal growth, we investigated the extent to which tertiles of change in the third trimester may be related to neonatal outcomes (Table 4). Women in the first tertile for triceps skinfold, with a rate of change between −0·57 and −0·06 mm per week, had neonates that had 35·8 g more lean mass than neonates of mothers in the middle tertile (rate of change=−0·05 to 0·06 mm per week), although there was no significant overall association with birth weight. The remaining individual components of maternal anthropometry were not significantly associated with neonatal anthropometry. In contrast, a rate of change in the first tertile (−0·37 to 0·52 kg/week) of third-trimester maternal weight gain compared with the middle tertile was associated with a −85·6 (95 % CI −128·1, −42·7) g decrease in birth weight.
Table 4 Association between the tertile of rate of change in maternal anthropometry in the third trimester (28–40 weeks) and neonatal anthropometryFootnote † in non-obese women with singleton pregnancies (n 1911) recruited from twelve US sites, Eunice Kennedy Shriver National Institute of Child Health and Human Development (NICHD) Fetal Growth Studies–Singletons cohort (2009–2013)

*P<0·05.
† Values are beta coefficients and 95 % CI; adjusted for race, infant sex, parity, age, height, pre-pregnancy BMI, gestational age at delivery and neonatal measurement date, and baseline anthropometry value; neonatal lean mass, fat mass and fat percentage (n 1698), birth weight (n 1759).
‡ Calculated as the difference between maternal weight and estimated fetal weight.
In sensitivity analyses accounting for birth weight, our results remained in a similar direction, but were now significant for mid-upper arm circumference and triceps skinfold. A faster rate of increase in maternal mid-upper arm circumference in both the second (β=14·4, 95 % CI 4·89, 23·9 g) and third trimester (β=17·1, 95 % CI 4·05, 30·1 g) and of triceps skinfold in the second trimester (β=4·65, 95 % CI 0·89, 8·42 g) was associated with increased neonatal fat mass independent of birth weight (see online supplementary material, Supplemental Table 1). When assessing tertiles of change using the residual method, the lowest tertile of change in maternal mid-upper arm circumference was associated with decreased neonatal fat mass independent of birth weight (β=−10·5, 95 % CI −20·8, −0·27 g; Supplemental Table 2).
Our results remained the same after limiting our analysis only to neonates born at gestational age ≥39 weeks (the mean gestational age at delivery), providing confidence that the modelled maternal anthropometric trajectories were not biased by the inclusion of earlier deliveries. Our findings were consistent in analyses that included only individual neonatal anthropometric measures (length and abdominal flank skinfold used to calculate neonatal lean and fat mass, confirming the application of equations for calculating neonatal lean and fat mass for this population; data available on request). The association of maternal anthropometry with neonatal anthropometry did not differ by the second-trimester rate of change (third-trimester models only).
Discussion
Our study has demonstrated that the rate of change in maternal anthropometry may be related to neonatal lean and fat mass yet has a negligible impact on infant birth weight, indicating that neonatal anthropometry provides additional information over birth weight alone. Increase in maternal triceps skinfold thickness across the second and third trimesters, an indicator of an increase in maternal fat, was associated with decreased neonatal lean mass. As evidence suggests decreased lean mass is associated with an increased risk of a poorer metabolic profile later in life( Reference Catalano, Mele and Landon 5 , Reference Dewey and Begum 8 ), our findings support the important insight into neonatal health provided by maternal anthropometric measures beyond total GWG alone.
The skinfold trajectories that we observed are similar to those documented in previous studies that described maternal skinfold changes in lean( Reference Taggart, Holliday and Billewicz 22 , Reference Ash, Fisher and Truswell 23 ), white( Reference Maple-Brown, Roman and Thomas 24 ) and homogeneous ethnic populations( Reference Villar, Cogswell and Kestler 9 ). Our study, which has documented an increase in neonatal lean and fat mass with an increased rate of GWG in the second and third trimester, is similar to studies that reported increased neonatal fat mass with excessive GWG in mid-late gestation( Reference Ruchat, Allard and Doyon 25 ) and at delivery( Reference Starling, Brinton and Glueck 26 ), but differs from other studies that reported increased neonatal fat and not lean mass with high maternal GWG only in the first half of pregnancy( Reference Crozier, Inskip and Godfrey 12 , Reference Davenport, Ruchat and Giroux 27 ).
The change in maternal fat skinfolds demonstrates the complex and dynamic state of pregnancy. Lipid metabolism is altered early in pregnancy to promote the storage of maternal fat, while later in pregnancy an increase in plasma fatty acid and glycerol concentrations corresponds to fat mobilization( Reference Butte 14 ). Deviating from this expected pattern may reflect disrupted lipid metabolism or placental insufficiency( Reference Butte 14 , Reference King, Parker and Howard 28 ), ultimately limiting fetal gains. While we hypothesize that the lack of mobilization of maternal fat stores limits fetal lean mass acquisition, the exact mechanism and clinical importance of this relationship remain unclear and should be investigated in future studies. Furthermore, it is unclear why decreases in neonatal lean mass at birth were not reflected in birth weight, as reported in previous studies( Reference Kent, O’Dwyer and Fattah 29 ), although previous studies have not been limited to normal and overweight women. One explanation may be the increase in birth weight due to neonatal fat mass, as indicated in our sensitivity analyses using the residual method, where an increased rate of maternal fat mass, particularly in the second trimester, was associated with increased neonatal fat mass independent of birth weight. The lack of significance may be also explained by potential error in neonatal anthropometric equations estimating body composition, although there was a trend in directionality towards decreasing birth weight associated with increasing maternal fat mass.
However, the existing evidence to support the biological link between decreasing maternal skinfolds and fetal size is conflicting. Some studies report lower birth weight with increased triceps skinfold at 14 weeks’ gestation( Reference Villar, Cogswell and Kestler 9 , Reference Lederman, Paxton and Heymsfield 30 ) and at delivery( Reference Briend 31 , Reference Toro-Ramos, Sichieri and Hoffman 32 ), while others report no difference in birth weight with increased maternal fat mass in the first half of pregnancy( Reference Forsum, Sadurskis and Wager 33 , Reference Thame, Trotman and Osmond 34 ). These variable findings may be explained by differences in techniques for measuring maternal fat mass or in the timing of skinfold measurements. Skinfolds measured at a single time point( Reference Villar, Cogswell and Kestler 9 , Reference Lederman, Paxton and Heymsfield 30 ) do not indicate the change in fat mass while measures of total pregnancy change( Reference Forsum, Sadurskis and Wager 33 , Reference Thame, Trotman and Osmond 34 ) will underestimate the associations seen with decreasing fat at the end of pregnancy.
Our findings should be considered within the context of limitations. The accuracy of skinfold measures may be affected by skin compressibility and maternal characteristics. To limit this type of measurement error in the NICHD Fetal Growth Study, study personnel underwent training and followed a standardized protocol. Neonatal body compositions were not measured, but instead were calculated using validated equations( Reference Catalano, Thomas and Avallone 19 ). Applying these equations to a study with different population characteristics may induce error. However, recent evidence on the validity of anthropometric equations suggests low precision and accuracy of equations at birth, other than the one used in the present study( Reference Catalano, Thomas and Avallone 19 ), due to rapid infant growth and individual variability( Reference Cauble, Dewi and Hull 35 ). Still, our findings should be interpreted with caution and replicated using more accurate body composition equipment. Due to the observational nature of the study, we cannot make causal assumptions about the association between the mobilization of fat stores in late gestation and fetal growth.
The present study was strengthened by the longitudinal design. Repeated skinfold measures enhanced the prediction of maternal anthropometric trajectories in a contemporary, diverse cohort. The multistage analytical approach enabled us to assess specific time periods of change in relation to fetal development. An additional strength was the neonatal skinfold measures at birth to assess the composition of birth weight.
Conclusion
In conclusion, our findings suggest that the maternal components of GWG may provide additional insight about fetal growth and composition at birth beyond that supplied by GWG alone. However, future studies should aim to validate these findings using more accurate measures of body composition to determine if changes in maternal anthropometric measures would provide a more sensitive and specific predictor of fetal growth composition.
Acknowledgements
Financial support: This project was supported by the intramural programme at the Eunice Kennedy Shriver National Institute of Child Health and Human Development and included American Recovery and Reinvestment Act funding (contract numbers HHSN275200800013C, HHSN275200800002I, HHSN27500006, HHSN275200800003IC, HHSN275200800014C, HHSN275200800012C, HHSN275200800028C and HHSN275201000009C). The funder had no role in the design, analysis or writing of this article. Conflicts of interest: The authors have declared that no conflicts of interest exist. Authorship: The authors’ contributions were as follows. All authors designed the study; S.J.P. wrote the manuscript; S.J.P., A.M.O.-V. and P.S.A. analysed the data; W.G., K.L.G., P.S.A., D.W., J.G., M.H. and R.B.N. were responsible for the data collection; all authors read and approved the final manuscript; and S.J.P. and K.L.G. had primary responsibility for the final content. Ethics of human subject participation: This study was conducted according to the guidelines laid down in the Declaration of Helsinki and all procedures involving human subjects were approved by the local institutional review board. Written informed consent was obtained from all subjects.
Supplementary material
To view supplementary material for this article, please visit https://doi.org/10.1017/S1368980018003749