


Inequities in health are unfair, systematic and avoidable disparities that diminish the opportunity of individuals to develop their full health potential. Socio-economic status (SES) is one of the major drivers of these health inequities(Reference Marmot1,2) .
The coexistence of undernutrition and excess weight (overweight and obesity), both known as malnutrition, is one of the main health problems that usually affects the most vulnerable population and has a negative impact on economic and social capital. A recent study estimated that undernutrition causes more economic losses as a result of a reduction in productivity, whereas overweight and obesity generate more costs in health due to co-morbidities associated to these conditions(3). For this reason, the prevention of malnutrition among vulnerable populations should be a priority; furthermore, reducing inequalities between and within countries, achieving gender equality, guaranteeing a healthy life and social inclusion are all included in the Sustainable Development Goals 2015–2030(Reference Arcaya, Arcaya and Subramanian4). In this context, Peru has shown important economic progress(5) along with improvements in maternal and child health and nutrition(Reference Huicho, Huayanay-Espinoza and Herrera-Perez6,Reference Huicho, Segura and Huayanay-Espinoza7) . Despite these improvements, previous studies have shown differences in the distribution of malnutrition within the country; anaemia and stunting rates have not decreased equally in all regions, and the prevalence of overweight and obesity has increased more in some regions(Reference Devaux, Sassi and Church8–Reference Loret De Mola, Quispe and Valle11).
Little is known about the underpinning determinants of these differences in Peru. One analysis of the risk factors for nutritional inequalities among Peruvian children (1991–2007) identified SES as the main factor explaining these inequalities(Reference Mesinas12); however, that study was restricted to children and undernutrition indicators. Similar analyses have not been conducted to assess socio-economic disparities associated with both undernutrition (e.g. wasting/underweight, stunting, anaemia) and excess weight in children and women of reproductive age (WRA). Information for WRA is important given the high rates of overweight/obesity and anaemia in this group(Reference Loret De Mola, Quispe and Valle11). Furthermore, the nutritional status of WRA is one of the early risk factors that can be modified to prevent malnutrition in their offspring(Reference Dewey and Begum13,Reference Black, Victora and Walker14) . This lack of information is consistent with a recent review made for the Latin American and Caribbean region, in which it is recognized that up-to-date available data are needed to identify vulnerable populations and design more specific actions to address inequalities in these populations(Reference Galicia, Grajeda and López de Romaña15). Therefore, the aim of the present study was to estimate and compare the distribution of malnutrition among children under 5 years and WRA according to selected socio-economic indicators (SEI), such as wealth index, education level and ethnicity, using the Peruvian National Demographic and Family Health Survey of 2015.
Methods
Previous consideration
The present study is part of a supplement that includes studies from Argentina, Bolivia, Brazil, Colombia, Chile, Ecuador, Guatemala, Mexico and Uruguay. The idea for this supplement originated at the VII Latin American Workshop on Leadership in Nutrition(16). The motivation was to generate evidence and to understand similarities and differences among countries in disparities in malnutrition due to socio-economic factors. To allow between-country comparability, a common methodology was used. In general, the analysis was based on representative survey data including the same age groups as well as malnutrition and SEI. The statistical analysis was based on a bivariate analysis that compares the distribution of malnutrition by categories of SEI. Some countries conducted additional analysis (e.g. multivariate analysis, prevalence ratios) according to their specific research interests and priorities.
Study design and setting
The present cross-sectional study is based on secondary analysis of the open access data set of the 2015 Peruvian National Demographic and Family Health Survey (ENDES)(17). ENDES is conducted by the National Institute of Statistics and Informatics, following standard methods, tools and procedures developed by the DHS Program, and provides information on the demographic dynamics, health and nutrition condition of WRA and children under 5 years since 1986. Since 2004, Peru has been conducting annual surveys and was the first country to undertake a continuous survey within the DHS Program. The survey has representativeness at national, urban/rural, regional and departmental levels. The sample of the ENDES 2015 is a sub-sample of the total selected for the period 2015–2017, that was a two-stage, stratified and independent self-weighting random sample at departmental and urban/rural area levels, as described in full elsewhere(18).
Participants
We analysed anthropometric and socio-economic data from children aged <5 years and WRA, divided into adolescent women aged 15–19 years and adult women aged 20–49 years. The eligible study population consisted of habitual resident and non-pregnant women. Moreover, participants with no anthropometric measurements or implausible values were excluded. Of the total eligible sample data set of 23 095 children and 36 119 WRA of ENDES, we excluded 262 children (189 without anthropometry and seventy-three with implausible data) and 2616 WRA (1246 without anthropometry and forty-one with implausible data). WRA without weighting factor were also excluded (n 1329). Therefore, 22 833 children and 33 503 WRA were included in the analytical sample. Children included in the analysis had lower SES and education level and were more likely to be indigenous than those excluded; while included WRA had higher education level than excluded ones.
Malnutrition indicators
ENDES provides information on anthropometry and Hb concentrations. Weight and height were measured using standardized procedures(19) and Hb concentrations were obtained using capillary blood samples as described in full elsewhere(Reference Jordan20). The children’s anthropometric Z-scores, which were obtained from the ENDES database, were calculated based on the 2006 WHO growth standards. For adolescents we calculated Z-scores for height-for-age (HAZ) and BMI-for-age (BMIZ) using the WHO AnthroPlus software (2007) and for adult women we calculated BMI by dividing weight in kilograms by the square of height in metres (kg/m2).
Overweight, obesity, wasting, underweight and stunting were defined based on WHO criteria. Different cut-offs were used for BMIZ for children and adolescents. For children, BMIZ > +2 and ≤+3 and BMIZ > +3 were used to define overweight and obesity, respectively; whereas for adolescents, BMIZ > +1 and ≤+2 and BMIZ > +2 were used to define overweight and obesity, respectively. Stunting was defined as HAZ < −2 in both children and adolescents. Underweight in adolescents was defined as BMIZ < −2 and wasting in children was defined as weight-for-height Z-score (WHZ) < −2(Reference De Onis and Frelut21). For adult WRA, BMI ≥ 25 and <30 kg/m2, BMI ≥ 30 kg/m2 and BMI < 18·5 kg/m2 were defined as overweight, obesity and underweight, respectively(Reference Jordan20). For each age group, we combined overweight and obesity into an overweight/obesity (OW) category using BMIZ > +2 for children, BMIZ > +1 for adolescents and BMI ≥ 25 kg/m2 for adults. For short stature in adult women, we used a cut-off of height < 1·49 m to keep comparability among countries included in this supplement.
Anaemia in children and WRA was defined as Hb < 11 mg/dl and Hb < 12 mg/dl, adjusted for altitude, respectively, according to WHO(22).
To assure the quality of the malnutrition variables, we excluded implausible values such as HAZ of <−6 or >+6, WHZ and BMIZ of <−5 or >+5 in children and adolescents(23), BMI of <10 kg/m2 or >58 kg/m2 in adult women(Reference Barquera, Campos-Nonato and Pedroza24), and Hb concentrations of <4 g/dl or >18·5 g/dl for children and WRA(Reference Pullum, Collison and Namaste25).
Socio-economic indicators
Wealth index, education level and ethnicity were used as SEI. Wealth index, considered a proxy of SES, was constructed by the National Institute of Statistics and Informatics using a factor analysis method based on data collected for household characteristics, goods and services(Reference Black, Victora and Walker14). We categorized the wealth index into tertiles according to the distribution of the wealth index factor score obtained from the ENDES 2015 database. We categorized the education level among mothers of children and WRA, expressed in ENDES as the number of education years attained, into low level (0–6 years), medium level (7–12 years) and high level (>12 years). For ethnicity we used the variable ‘language or mother tongue that the woman learned in her childhood’, which is collected by ENDES as a proxy for ethnicity(Reference Valdivia26). Indigenous was defined when the language was Quechua, Aymara or another indigenous language different from Spanish.
Statistical analysis
Characteristics of the participants and their households, both overall and by wealth tertile, as well as the prevalence of malnutrition indicators at the national level and by each category of SEI, were described using means and proportions with a confidence interval of 95 %. Differences in the prevalence of malnutrition among SEI categories were tested using the lincom function in the statistical software package Stata version 14. This post-estimation function performs Wald tests on linear combinations of independent estimators(Reference Rubin and Weisber27,28) . To show the relative disparity and association of malnutrition with each SEI, we estimated crude and adjusted prevalence ratios (PR) in a log-binomial regression model, using the lowest category of SES and education, and non-indigenous, as reference group. We chose this approach to avoid overestimation of the associations, since most of our outcomes have prevalences higher than 10 %(Reference Tamhane, Westfall and Burkholder29). Adjusted PR were estimated from multivariable models for each malnutrition indicator with each SEI by age group. Models for children and WRA included region (Lima, Other Coast, Highlands and Jungle) and place of residence (urban/rural) as potential confounders. Maternal BMI (kg/m2), grouped into four categories (<18·5, >18·5–<25, >25–<30 and ≥30), and number of children in the household were included in models for children. Age in years and parity were also included in models for WRA. All analyses were conducted with sampling weights that corrected the estimations for non-response and the complex sample design. Standard errors were adjusted for clustering at the geographical level (departments) using the svy module of Stata version 14 and P < 0·05 was used to assess statistical significance.
Results
Sample characteristics
Table 1 displays the characteristics of the study sample, overall and by tertile of wealth index. The mean age of children was 2·50 (95 % CI 2·48, 2·52) years and 51·3 (95 % CI 50·4, 52·1) % were male. The mean age of adolescents and adult women was 16·9 (95 % CI 16·8, 16·9) years and 34·1 (95 % CI 33·9, 34·2) years, respectively. Compared with their highest counterpart, households with low wealth index had a higher proportion of women with low education (53·4 v. 5·2 %, respectively) and a higher proportion of indigenous (20·8 v. 0·3 %, respectively). Likewise, low-wealth-index households were more likely to use firewood or carbon for cooking (65·7 v. 0·2 %) and have a bare-earth floor (74·8 v. 0·6 %). Furthermore, households with low wealth index were less likely to have access to a public sanitary sewer system (13·9 v. 96·7 %), television (61·9 v. 99·4 %), computer (1·1 v. 71·2 %), telephone (1·6 v. 52·6 %) and refrigerator (10·2 v. 88·9 %).
Table 1 Sample characteristics by tertile of wealth index among children under 5 years and women of reproductive age in Peru (data are from the Peruvian National Demographic and Family Health Survey (ENDES) 2015)
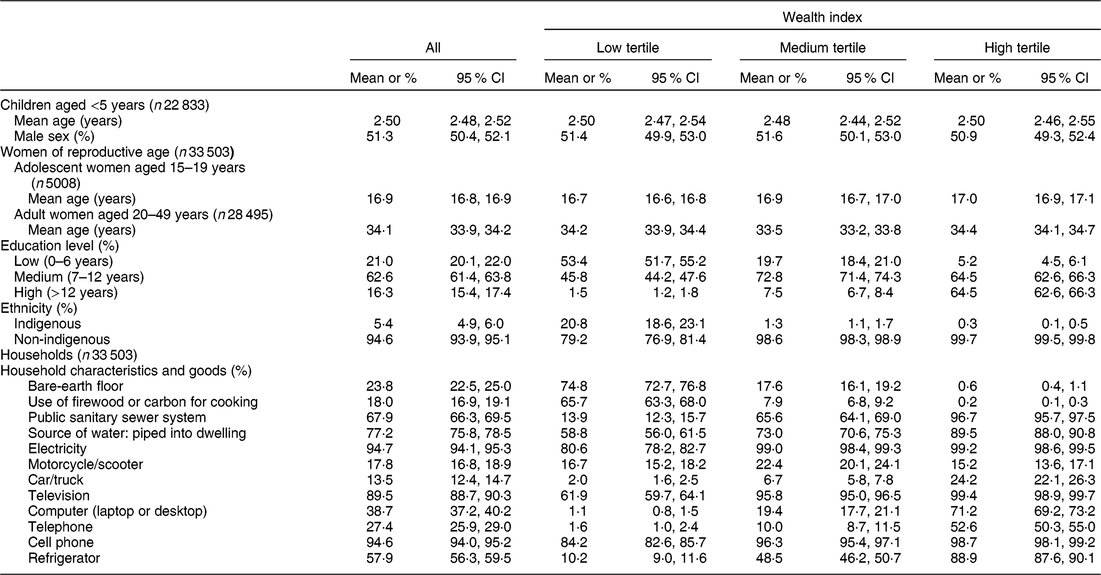
ENDES, Encuesta Demográfica y de Salud Familiar.
Malnutrition by age and socio-economic indicator
Table 2 presents the prevalence of malnutrition indicators by age group and SEI categories. In general, wasting/underweight was less prevalent either in children or WRA (<1 %), while the most prevalent problem was anaemia in children (32·0 %; 95 % CI 31·0, 32·8 %) and OW in adolescent (31·3 %; 95 % CI 29·0, 33·6 %) and adult WRA (65·1 %; 95 % CI 64·1, 66·1 %).
Table 2 Prevalence of malnutrition prevalence by wealth index, education level and ethnicity among children under 5 years and women of reproductive age in Peru (data are from the Peruvian National Demographic and Family Health Survey (ENDES) 2015)
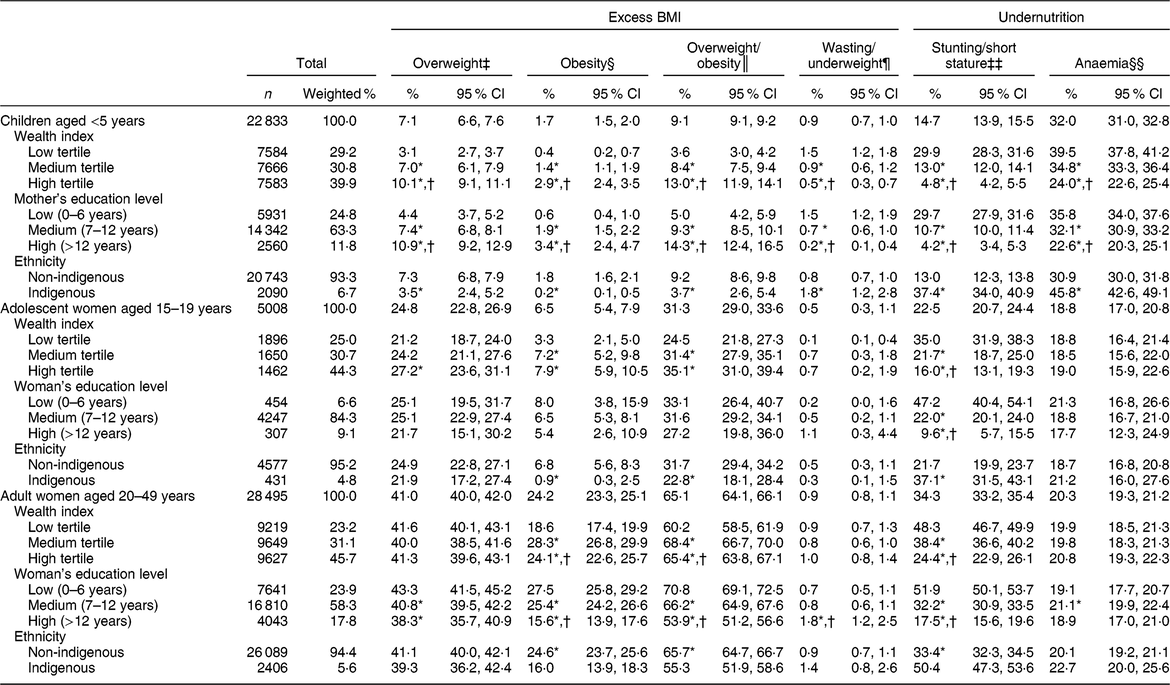
ENDES, Encuesta Demográfica y de Salud Familiar; BMIZ, BMI-for-age Z-score; WHZ, weight-for-height Z-score; HAZ, height-for-age Z-score.
* P < 0·05 v. low tertile/low education/indigenous.
† P < 0·05 v. medium tertiles/medium education.
‡ Overweight: BMIZ > +2 and ≤+3 for children aged <5 years; BMIZ > +1 and ≤+2 for adolescent women aged 15–19 years; and BMI ≥ 25 and <30 kg/m2 for adult women aged 20–49 years.
§ Obesity: BMIZ > +3 for children aged <5 years; BMIZ > +2 for adolescent women aged 15–19 years; and BMI ≥ 30 kg/m2 for adult women aged 20–49 years.
║ Overweight/obesity: BMIZ > +2 for children aged <5 years; BMIZ > +1 for adolescent women aged 15–19 years; and BMI ≥ 25 kg/m2 for adult women aged 20–49 years.
¶ Wasting: WHZ < −2 for children aged <5 years. Underweight: BMIZ < −2 for adolescent women aged 15–19 years; and BMI < 18·5 kg/m2 for adult women aged 20–49 years.
‡‡ Stunting: HAZ < −2 for children aged <5 years; HAZ < −2 for adolescent women aged 15–19 years. Short stature: height < 1·49 m for adult women aged 20–49 years.
§§ Anaemia: Hb, adjusted for altitude, of <11 mg/dl for children aged <5 years and <12 mg/dl for women aged 15–49 years. The sample size for anaemia was 20 707 for children aged <5 years; 4990 for adolescent women aged 15–19 years; and 28 303 for adult women aged 20–49 years.
In children we found significant disparities (P < 0·05) in the prevalence of all the undernutrition indicators by each category of SEI. Children of high SES had a lower prevalence of wasting (0·5 v. 1·5 %), stunting (4·8 v. 29·9 %) and anaemia (24·0 v. 39·5 %) compared with children of low SES. Disparities were also found by education level, where wasting (0·2 v. 1·5 %), stunting (4·2 v. 29·7 %) and anaemia (22·6 v. 35·8 %) were lower in children of high-educated mothers compared with their lowest counterparts. The prevalence of wasting (1·8 v. 0·8 %), stunting (37·4 v. 13·0 %) and anaemia (45·8 v. 30·9 %) was higher in indigenous children than in non-indigenous. Conversely, OW was higher in children of high SES (13·0 v. 3·6 %), those of high-educated mothers (14·3 v. 5·0 %) and in non-indigenous children (9·2 v. 3·7 %); the same results were found for overweight and obesity analysed separately (Table 2). After adjusting for potential confounders, the disparities between malnutrition and SEI remained significant, except for excess weight indicators by ethnicity (Table 3). The greatest disparity was observed for stunting by all SEI, and for obesity by SES and education. Adjusted PR showed that children of high SES were 75 and 74 % less likely to be stunted compared with their lowest counterparts, and indigenous children were 34 % more likely to be stunted (Table 4). Moreover, children of high SES and high-educated mothers were nearly three times more likely to be obese than their lowest counterparts (Table 3).
Table 3 Prevalence ratios (PR) of excess weight by categories of socio-economic indicators among children under 5 years and women of reproductive age in Peru (data are from the Peruvian National Demographic and Family Health Survey (ENDES) 2015)

ENDES, Encuesta Demográfica y de Salud Familiar; OW, overweight/obesity.
An independent model was estimated for each socio-economic indicator (wealth index, education and ethnicity).
* P < 0·05 v. low tertile/low education/non-indigenous.
‡ In children, the adjusted model included BMI of their mothers, number of children in household, region and type or place of residence.
§ In women of reproductive age, the adjusted model included their age in years, total number of children ever born, region and type or place of residence.
Table 4 Prevalence ratios (PR) of undernutrition by categories of socio-economic indicators among children under 5 years and women of reproductive age in Peru (data are from the Peruvian National Demographic and Family Health Survey (ENDES) 2015)

ENDES, Encuesta Demográfica y de Salud Familiar.
An independent model was estimated for each socio-economic indicator (wealth index, education and ethnicity).
* P < 0·05 v. low tertile/low education/non-indigenous.
‡ In children, the adjusted model included BMI of their mothers, number of children in household, region and type or place of residence.
§ In women of reproductive age, the adjusted model included their age in years, total number of children ever born, region and type or place of residence.
In adolescent women, we found significant differences in the prevalence of stunting for all SEI categories, whereas no significant differences were found for underweight and anaemia. Compared with their highest counterparts, stunting was higher in adolescents of low SES (35·0 v. 16·0 %) and low education (47·2 v. 9·6 %), and higher in indigenous than non-indigenous (37·1 v. 21·7 %). The prevalence of OW was higher in adolescents of high SES compared with those of low SES (35·1 v. 24·5 %) and lower in indigenous adolescents compared with non-indigenous ones (22·8 v. 31·7 %), whereas no significant differences were found in OW by education level. When we analysed overweight and obesity separately, the prevalence of overweight was significantly higher in adolescents of high SES than in those of low SES (27·2 v. 21·2 %). The prevalence of obesity was higher in adolescents of high SES compared with those of low SES (7·9 v. 3·3 %), and lower in indigenous adolescents (0·9 v. 6·8 %; Table 2). Adjusted PR confirmed the same disparities except for excess weight indicators by ethnicity. Adolescents of high SES, high education and non-indigenous were 52, 79 and 21 % less likely to be stunted than their lower counterparts, while high-SES adolescents were 38 % more likely to be OW. In addition, indigenous adolescents were 57 % more likely to have anaemia than non-indigenous ones (Tables 3 and 4).
In adult women, significant differences were found for short stature by all SEI categories, whereas underweight and anaemia were significantly different only by education level. The prevalence of short stature was higher in adult women of low SES (48·3 v. 24·4 %) and low education level (51·9 v. 17·5 %) compared with their highest counterparts, and higher in indigenous compared with non-indigenous (50·4 v. 33·4 %). The prevalence of underweight was higher among highly educated women compared with those of low education (1·8 v. 0·7 %) and anaemia was higher in adult women with medium education level compared with their lowest counterparts (21·1 v. 19·1 %). The prevalence of OW was higher in adult women of high SES (65·4 v. 60·2 %), low education level (70·8 v. 53·9 %) and non-indigenous (65·7 v. 55·3 %). Similar results were found for obesity alone, whereas overweight was different only by educational level, being higher in adult women of low education compared with those with high education (43·3 v. 38·3 %; Table 2). Adjusted PR confirmed the disparities for short stature, OW and obesity by all SEI. Indigenous women were 10 and 28 % more likely to be stunted and have anaemia than non-indigenous ones, respectively. Moreover, indigenous women were 2·8 times more likely to be underweight (Tables 3 and 4).
Discussion
Our findings confirm the coexistence of the double burden of malnutrition, with high levels of anaemia and OW, although low levels of wasting/underweight. In 2015, anaemia was the most prevalent condition in children (32·0 %), while OW was the most prevalent condition in adolescent (31·3 %) and adult WRA (65·1 %) in Peru. It is relevant to notice that the mean prevalence of OW in children (9·1 %) was higher in 2015 than the prevalence reported in 2005–2010 (8·2 %)(Reference Alvarez-Dongo, Sánchez-Abanto and Gómez-Guizado30), and also exceeds the mean prevalence for South America and the world in 2015 (7·7 and 5·6 %, respectively)(31), indicating that in 2015 OW already was a health problem in Peruvian children.
Our results highlight important differences in the distribution of malnutrition among children and WRA according to SES, education and ethnicity. We have addressed these differences as disparities because they are not fair and can be preventable(Reference Marmot1). PR allowed us to show these disparities. In general, we found a different relationship between malnutrition and SEI for each age group analysed, and greater disparities were observed for stunting compared with anaemia and OW (Fig. 1).

Fig. 1 Prevalence of overweight/obesity, stunting/short stature and anaemia by (a) wealth index (![]() , low tertile;
, low tertile; ![]() , medium tertile;
, medium tertile; ![]() , high tertile), (b) education (
, high tertile), (b) education (![]() , low, 0–6 years;
, low, 0–6 years; ![]() , medium, 6–12 years;
, medium, 6–12 years; ![]() , high, >12 years) and (c) ethnicity (
, high, >12 years) and (c) ethnicity (![]() , non-indigenous;
, non-indigenous; ![]() , indigenous) among children aged <5 years (n 22 833) and women of reproductive age, divided into adolescent women aged 15–19 years (n 5008) and adult women aged 20–49 years (n 28 495), in Peru. Education level is based on years of education and is based on the mother’s education level for children aged <5 years. Data are presented as means with their 95 % CI represented by vertical bars. *P < 0·05 v. low tertile/low education/indigenous; †P < 0·05 v. medium tertile/medium education. (Data are from the Peruvian National Demographic and Family Health Survey (ENDES) 2015)
, indigenous) among children aged <5 years (n 22 833) and women of reproductive age, divided into adolescent women aged 15–19 years (n 5008) and adult women aged 20–49 years (n 28 495), in Peru. Education level is based on years of education and is based on the mother’s education level for children aged <5 years. Data are presented as means with their 95 % CI represented by vertical bars. *P < 0·05 v. low tertile/low education/indigenous; †P < 0·05 v. medium tertile/medium education. (Data are from the Peruvian National Demographic and Family Health Survey (ENDES) 2015)
For children an inverse relationship was found between undernutrition indicators and SEI, with a lower prevalence of anaemia and stunting among children with high SES, non-indigenous and those with a high-educated mother. This result is consistent with those from previous studies in this population(Reference Seclén, Miranda and Sanchez10,Reference Sobrino, Gutiérrez and Cunha32,Reference Díaz, Arana and Vargas-Machuca33) , as well as an analysis of eighty countries that show that these undernutrition indicators decrease as wealth and caregiver’s education level increase(Reference Perez-Escamilla, Bermudez and Buccini34). In addition, two studies that analysed data from 1991 to 2007 show that SES is the main factor that explained nutritional disparities in Peruvian children, followed by the education level of caregivers. According to the conceptual framework of malnutrition developed by UNICEF, these SEI affect underlying causes of malnutrition at home level, such as inadequate access to food, sanitation and health services, as well as inadequate childcare practices(35). Ethnicity, on the other hand, has been recognized as a social determinant of important health disparities(36) and has been associated with poverty and inadequate access to public services, especially education and health(Reference Díaz, Arana and Vargas-Machuca33,Reference Castro, Savage and Kaufman37,Reference King, Smith and Gracey38) . These underlying conditions are important factors that help to explain why the prevalence of undernutrition is usually higher among indigenous populations. This is especially true in children, as the prevalences of stunting and anaemia are higher compared with the national means. The need for more profound analysis between health and ethnicity in Peru has been recognized(Reference Díaz, Arana and Vargas-Machuca33), which is necessary to implement short-term effective actions to eradicate disparities associated with ethnicity. In WRA, a significant inverse relationship was also found for stunting/short stature by all the SEI, and anaemia by ethnicity. Short stature can be the reflection of nutritional deficiencies and fewer opportunities for growth and development at earlier ages. Therefore women with lower SES, and lower education level, have a higher risk to have short stature(Reference Dewey and Begum13).
Contrary to what was observed for indicators of undernutrition, there was a direct association between children’s OW and SEI. Children of families with a higher SES have a higher prevalence of OW. Studies have shown that an increase in income or wealth is positively related to an increase in the prevalence of OW in children in developing countries(Reference Black, Victora and Walker14,Reference Peña and Bacallao39) . The positive relationship between wealth and OW could be explained by better access to food and a higher energy intake, as well as a better access to amenities that decrease physical activity, even at early ages(Reference Loret De Mola, Quispe and Valle11,40) . Furthermore, we also found that children of mothers with higher education levels also have higher OW rates. This finding is consistent with results from a recent multicentre study which showed that in lower-income countries the association between parent’s education level and OW in children is positive, whereas in countries of higher income the association is negative(Reference Muthuri, Onywera and Tremblay41). The authors speculate that in lower-income countries higher parental education could be associated with a higher risk of their children being overweight as a consequence of social norms, where an overweight child may be perceived as a ‘healthy child’. A second hypothesis suggested by Araneo(Reference Araneo42) is that educated mothers spend more time working outside the home and thus have less time to offer their children healthy foods and supervise their children’s activities. Further studies are needed to clarify the exact nature of the relationship between parent’s education level and OW in Peruvian children. In the case of ethnicity, we found that the prevalence of OW was higher among non-indigenous children, but this difference was smaller compared with those found for SES and education level. This could be an alert sign as it could show that environmental conditions are changing for groups previously considered at low risk for OW.
In the case of WRA, the patterns of the prevalence of OW showed a direct relationship with SES tertile, and an inverse relationship with education in adults. These results are consistent with Poterico et al. who reported that Peruvian women of high SES were 30–40 % more likely to be overweight and 80 % more likely to be obese, and that low-educated women were more likely to be OW(Reference Poterico, Stanojevic and Ruiz-Grosso43). Similar results were observed by Jacoby et al., who showed an inverse relationship between OW and education(Reference Jacoby, Goldstein and López44). Peña and Bacallao reported that the relationship between wealth and OW was different for developed countries, and it was observed in countries where undernutrition is still a prevalent problem(Reference Peña and Bacallao39). The reason for these differences between countries is related to the complex nature of OW. Individual factors, such as genetic factors, access to healthy food, westernization of the diet, opportunities and barriers to do physical activity, sociocultural norms and beliefs about body weight, awareness about nutrition(Reference Peña and Bacallao39), as well as the difference among countries’ stage with regard to the nutrition transition phenomenon and their socio-economic development, have been suggested to understand the social disparities observed for OW in WRA(Reference Dinsa, Goryakin and Fumagalli45). A different explanation could be in part associated with the definition of SES. A review of international studies that had explored the association between SEI and obesity observed an inverse relationship when SES was measured using education and occupation as the indicators, and a direct relationship when SES was evaluated with indicators of income or possession of assets, as we found in the present study(Reference Dinsa, Goryakin and Fumagalli45).
Policy implications
Peru is a middle-income country(5) that is going rapidly from the third to the fourth stage of nutritional transition, which is characterized by increased economic access, reduction of nutritional deficiencies, adoption of modern dietary patterns with high consumption of high-energy foods, adoption of more sedentary lifestyles and increase of obesity and related non-chronic diseases(Reference Seclén, Miranda and Sanchez10,Reference Torres, Ruiz and Avilez46,47) . This process of transition is not homogeneous within the country and therefore, as shown in the present study, nutritional deficiencies are still prevalent in some vulnerable groups and coexist with excess weight. In this context, our findings highlight the importance to implement comprehensive policies and interventions to address malnutrition, including a focus on their underlying causes, such as SES, education and ethnicity disparities. Our findings also highlight the need for further research to inform policy makers about nutritional disparities that arise due to differences in SEI, particularly for OW and anaemia, to design and implement more pertinent interventions.
In relation to interventions, in Peru the main policy on nutrition has focused on reducing childhood undernutrition. This policy has had successful results in the reduction of stunting especially in rural and urban areas; however, in indigenous children, the reduction has been lower and the prevalence is still high. Furthermore, there has not been a reduction in the prevalence of anaemia(Reference Rokx, Marini and Gallagher48). So, the current National Plan for the Reduction and Control of Maternal and Child Anaemia and Stunting (2017–2021) is being implemented. The aim of this plan is to reduce anaemia and stunting in 6·4 and 19 %, respectively(49). For OW, Peru has recently approved some policies: in 2018 the manual of advertising warnings was approved and it will become effective for 2019, this is part of the law for the promotion of healthy eating for children and adolescents (approved in 2013)(50). Another regulation is the increment of 8 % in taxes on beverages with sugar content of ≥6 g/100 ml (approved in 2018). Furthermore, the Ministry of Health has established a Committee of Experts in nutrition to provide support and recommendations to the decision-making process in health promotion(51). These actions could help to start a comprehensive strategy to simultaneously tackle malnutrition by common platforms as the WHO has suggested(Reference Dietz52), taking into account socio-economic disparities. Indicators of disparities reduction are also needed to monitor the advances in this area.
Strengths and limitations
The main strength of the present study is the use of data of a representative sub-sample of the ENDES 2015–2017, which uses standardized methods for the collection of the variables we analysed. We included in our analysis indicators for underweight and excess weight for different vulnerable population subgroups, and multivariable analysis was used to account for the role of potential confounders. On the other hand, one limitation is that we used proxies for wealth (self-reported SES) and ethnicity (language spoken). Although this could lead to misclassifications, our findings appear to be consistent with other national-level studies that used other analytical designs. Finally, we excluded 7·2 % of the total sample of WRA; while this is a low rate of exclusion, the women excluded had lower education level and were less likely to live in rural areas compared with the analytical sample. Thus, our results may not be representative of the excluded population.
Conclusions
Our results show that malnutrition is a prevalent problem in Peru. Anaemia remains prevalent in children, whereas OW is prevalent in adolescent and adult women. Furthermore, malnutrition has a heterogeneous distribution with significant disparities by SEI. In general, undernutrition is more prevalent in low-SES, low-education and indigenous subgroups, whereas OW is more prevalent in high-SES, high-education and non-indigenous subgroups, except for education in WRA for whom OW is high in low-educated ones. Implementation of comprehensive policies and interventions that integrate actions to overcome malnutrition and reduce these socio-economic disparities are urgently needed.
Acknowledgements
Acknowledgements: The authors would like to thank Luis Ulloa from the National Institute of Statistics and Informatics of Peru for assisting with the set-up of the databases for the present analysis; the civil Association ‘Kaussasunchis-Peru’ and the National Institute of Public Health of Mexico for providing the lead author the time to write this article; and the Latin American Nutrition Leadership Program (Programa LILANUT) for the guidance and coordination provided to complete this research article. This article is part of the special issue: ‘Malnutrition in all its forms by wealth, education and ethnicity in Latin America: who are more affected?’ Financial support: DSM Nutritional Products provided funds for the publication of this manuscript. DSM Nutritional Products had no role in the design, analysis or writing of this article. Conflict of interest: None. Authorship: K.C.-Q. formulated the research questions, conducted the data analysis and wrote the first draft of the paper. E.O.-P contributed with the statistical analysis, interpretation and critical revision of results. D.L.d.R contributed to the analysis of data, interpretation of the results and revised the first draft of the article critically. All authors reviewed and edited all subsequent drafts of the manuscript, and all authors read and approved the final manuscript. Ethics of human subject participation: Not applicable. This study is based on analysis of secondary data that are publicly available. All the data are anonymous as the Peruvian National Demographic and Family Health Survey maintains the confidentiality of the information collected, covered by Article 97 of Chapter IV of the statistical secrecy and confidentiality of information.


