


Undernutrition has substantially decreased in Latin America, but it is still a public health concern (~17 % of children <5 years are stunted); on the other hand, Latin America is one of the most obese low- and middle-income regions globally (7 % of children <5 years, 17–36 % of adolescents and >50 % of adult women are overweight or obese)(Reference Popkin and Reardon1,Reference Rivera, de Cossio and Pedraza2) . Malnutrition in all its forms has detrimental effects on health and social development throughout the life cycle. Stunted and/or anaemic children are at a higher risk of death from infectious diseases, and their motor and cognitive development is impaired; women with short stature and/or anaemia are more prone to adverse perinatal outcomes; anaemia is likewise associated with decreased work productivity; and overweight and obesity increase the risk of non-communicable diseases(Reference Black, Victora and Walker3–Reference Reinhardt and Fanzo5). Several studies in low- and-middle income countries have documented a higher prevalence of undernutrition and micronutrient deficiencies among low-income countries and, within countries, among disadvantaged subgroups(Reference Black, Victora and Walker3,Reference Yang, Liu and Zha6–Reference Restrepo-Mendez, Barros and Black9) . Also, there is evidence of differences in the magnitude of overweight and obesity across socioeconomic groups, but these uneven distributions vary among countries and age groups(Reference Monteiro, Moura and Conde10–Reference Kinge, Strand and Vollset13). Low education is a protective factor for obesity in low-income countries and a risk factor in upper-middle income countries among women(Reference Monteiro, Moura and Conde10), whereas education is not associated with obesity among children(Reference Van Hook, Altman and Balistreri14). Given the profound consequences of malnutrition in all its forms, it is important to assess socioeconomic disparities to better design and target preventive programmes. One of the Sustainable Development Goals is to reduce inequalities within and among countries. A critical step to move towards this goal, in relation to malnutrition, is to monitor its prevalence across different subgroups of the population(Reference Becerra-Posada15), because national or regional prevalence can mask inequalities(Reference Restrepo-Mendez, Barros and Black9).
Many multi-country analyses have been conducted to assess malnutrition inequalities; however, the majority of these have focused on either stunting among children <5 years by wealth(Reference Bredenkamp, Buisman and Van de Poel7,Reference Restrepo-Mendez, Barros and Black9,Reference Wagstaff and Watanabe16,Reference Van de Poel, Hosseinpoor and Speybroeck17) , or on overweight or obesity among adult women (≥15 years) by education(Reference Monteiro, Moura and Conde10,Reference Martorell, Khan and Hughes11,Reference Kinge, Strand and Vollset13) . Very few have included education or obesity in the first type of studies(Reference Black, Victora and Walker3,Reference Vollmer, Harttgen and Kupka8) , or children or wealth on the second type of studies(Reference Van Hook, Altman and Balistreri14,Reference Jones-Smith, Gordon-Larsen and Siddiqi18) , and none of these have analysed adolescents and inequalities by ethnicity indicators, perhaps due to the heterogeneity of ethnicities at the global level.
In this supplemental issue, we focused on ten Latin American countries and analyse inequalities in stunting/short stature, anaemia and overweight. In addition, by focusing on Latin America, we were able to analyse inequalities by indigenous ethnicity. The indigenous population of Latin America share a common background and history of unequal life conditions; therefore, it is an important contribution to systematically analyse malnutrition inequalities in Latin America. Moreover, in addition to children, we analysed women of reproductive age in two subgroups (11–20 and 20–49 years) to understand if the patterns differ. Finally, we included both wealth and education, as using different socioeconomic indicators can help us understand the role of each one more thoroughly. In order to contribute to the research capacity and collaboration in the region, we coordinated a supplemental issue that includes the participation of ten Latin American countries. The idea of this supplement originated at the VII Latin American Workshop on Leadership in Nutrition (Programa Lilanut)(19) organised by the Latin American Society of Nutrition (SLAN). In this introductory article, we summarise the within-countries findings presented in each article, and in addition, we conducted a between-countries analysis. The goal of both analyses was to establish the degree to which the distribution of malnutrition (undernutrition and excess weight) varies by socioeconomic indicators (wealth and education) and ethnicity in ten Latin American countries (Argentina, Bolivia, Brazil, Colombia, Chile, Ecuador, Guatemala, Mexico, Peru and Uruguay) using nationally representative surveys.
Methods
We retrieved the information presented in each article participating in this supplemental issue. Data come from nationally representative surveys of Argentina (National Survey of Nutrition and Health 2005), Bolivia (Demographic Health Survey 2008), Brazil (Household Budget Survey 2008–9), Colombia (National Nutrition Survey 2010), Chile (National Health Survey 2016–17 for anthropometry and National Health Survey 2003 for anaemia), Ecuador (National Health and Nutrition Survey 2012), Guatemala (National Child and Maternal Health Survey 2014–15), Mexico (National Health and Nutrition Survey 2012), Peru (National Demographic and Family Health Survey 2015) and Uruguay (National Survey of Child Health, Nutrition and Development 2013). Study variables were households’ characteristics and assets, nutritional indicators for undernutrition (stunting/short stature and anaemia) and excess of weight (overweight and obesity).
Age groups
All countries included the same age groups; these were selected because they are vulnerable population subgroups that are at a great risk of all forms of malnutrition due to biological and social factors. Moreover, information on these age groups was available in most participating countries. These groups are children aged <5 years and women of reproductive age (11–49 years). Furthermore, we divided women of reproductive age into two groups, adolescent women (11–19 years) and adult women (20–49 years), to understand if inequalities differed in these age groups. The only countries with slightly different age groups due to limited data were Chile (data were available for adult women only), Uruguay (children were <4 years, and data for adolescent women were not available), Guatemala, Bolivia and Peru (adolescents were 15–19 years).
Malnutrition indicators
All countries used the following indicators of malnutrition: overweight or obesity (excess weight) and stunting/short stature and anaemia when available (undernutrition). BMI was estimated as weight (kg) divided by height (m) squared (kg/m2). Definitions were based on the WHO growth reference for school-aged children and adolescents(Reference de Onis, Onyango and Borghi20). Overweight or obesity was defined as BMI-for-age z-score >2 for children <5 years; BMI-for-age z-score >1 for adolescent women 11–19 years; and BMI ≥25 for adult women 20–49 years. Stunting was defined as height-for-age <–2 for children <5 years; height-for-age z score <–2 for adolescent women 11–19 years; and short stature as height <1·49 m for women 20–49 years. Anaemia was defined as haemoglobin <110 g/l for children <5 years, and <120 g/l for adolescents and adult women 11–49 years. Haemoglobin was adjusted for altitude in Argentina, Bolivia, Colombia, Ecuador, Mexico and Peru with the Cohen and Haas equation(Reference Cohen and Haas21).
Socioeconomic indicators (wealth and education) and ethnicity
Bolivia, Guatemala, Mexico and Peru used a wealth index based on household assets and access to services. These countries used principal components analysis to determine the weights of items in the index. Whereas Argentina, Brazil, Colombia and Ecuador used another index that considered not only household assets and access to services but also employment status and medical insurance coverage of householder. Chile and Uruguay defined wealth by income in US dollars. All countries categorised their wealth (or income) index into tertiles (tertile 1: low wealth; tertile 2: middle wealth; and tertile 3: high wealth), except in Chile in which the cut-off points were below minimum salary, between one and three, and three or more minimum salaries.
Education, in all countries for children and adolescents, was defined by the mother’s years of schooling, except for Argentina in which it was based on the head of household (usually the father). For adult women, the level of education was defined by the women’s years of schooling. Years of schooling was categorised as low (0–6 years; primary school or less), medium (7–12 years; high school) and high (>12 years; more than high school).
Indigenous ethnicity was based on self-report in Bolivia, Brazil, Ecuador, Colombia, Chile and Guatemala, whereas in Mexico and Peru, on whether at least one woman in the household spoke an indigenous language. Brazil, Ecuador and Colombia included other races/ethnicities in their surveys in addition to indigenous ethnicity (e.g. Black, Asian). Argentina and Uruguay did not report ethnicity.
Statistical analysis
Within countries
We retrieved information of the sample’s characteristics reported by each country, including the percentage of adult women with high (>12 years) education, the percentage of household with indigenous or black ethnicity/race and the households’ characteristics and assets captured in all surveys (bare-earth floors, electricity and possession of a refrigerator). We present these sample characteristics for all and for the low and high wealth tertiles, and we estimated the percentage points (pp) difference between the low and high wealth tertiles.
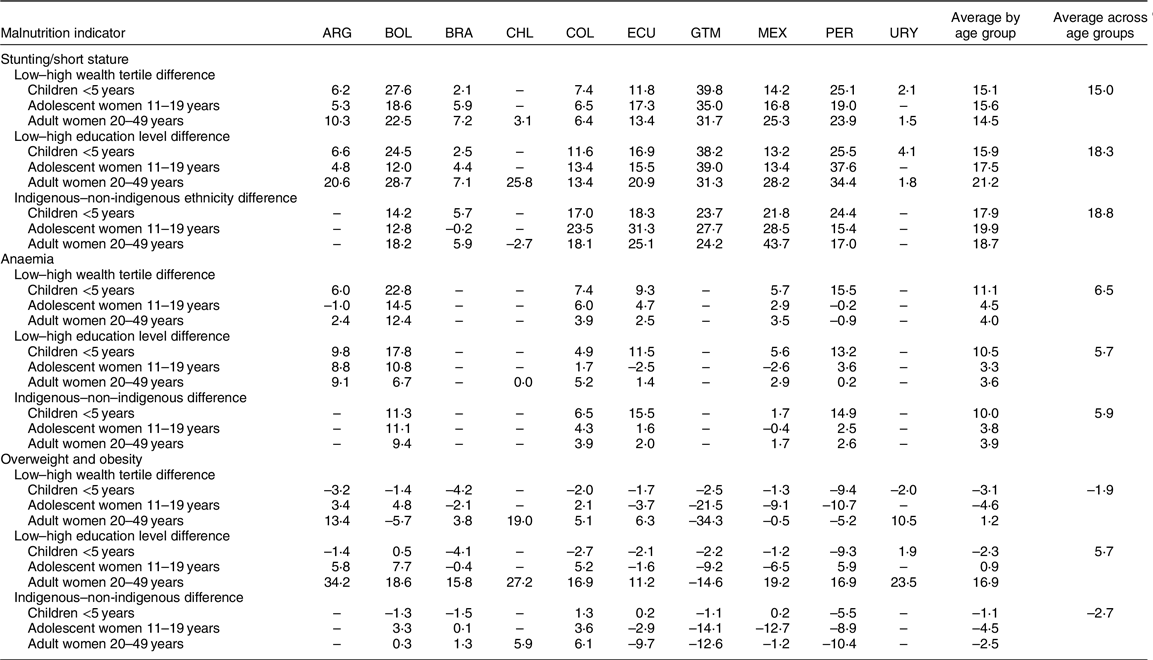
We present the prevalence of stunting/short stature, anaemia and overweight and obesity in each country and age group among the low and high wealth tertiles, the low and high education levels, and the indigenous and non-indigenous groups. In the case of Ecuador, Colombia and Brazil in the non-indigenous group, we did not include the black population. In the non-indigenous category, we included the groups termed ‘mestizo’ in Ecuador, ‘other’ in Colombia, and ‘white’, ‘mixed’ and ‘Asian’ in Brazil (we estimated a weighted average of malnutrition prevalence among these three ethnicities to group them into a single non-indigenous category). We compared absolute inequality among malnutrition prevalence across countries and age groups for each socioeconomic and ethnic indicator using inequality graphs (Equiplot)(Reference Barros and Victora22). Additionally, we estimated the pp difference in the prevalence of malnutrition between the wealth, education and ethnicity subgroups, and the average pp difference across countries and age groups.
Between countries
We performed a Pearson correlation between countries’ national malnutrition prevalence (stunting/short stature, and overweight and obesity) by age group and the following three countries’ indicators: (1) GDP per capita of the year of survey, (2) percentage of adult women with high education level and (3) percentage of non-indigenous households. GDP was obtained in current USD from the World Bank webpage(23); the latter two indicators were retrieved from the information reported in each country analysis. We considered a correlation coefficient <0·20 as very weak, 0·20–0·39 as weak, 0·40–0·59 as moderate, 0·60–0·79 as strong and ≥0·80 as very strong(Reference Evans24).
Results
In Table 1 we present the survey and sample characteristics of all participating countries. Surveys were conducted between 2005 (Argentina) and 2017 (Chile), and all surveys were nationally representative. The percentage of adult women with high education (>12 years) ranged from 11–18 % (Guatemala, Peru, Brazil and Mexico) to 44–58 % (Argentina and Ecuador). Countries with the largest difference in the percentage of high education between low and high wealth tertiles were Peru, Colombia and Argentina (percentage for low minus high tertile: –64, –63 and –59 pp, respectively). Percentages of indigenous population by country were Bolivia (60 %), Guatemala (44 %), Mexico, Chile, Ecuador, Peru and Colombia (4–8 %) and Brazil (0·4 %). The remaining countries did not report ethnicity in their surveys. The percentages of households with black persons were 5–10 % in Ecuador, Brazil and Colombia, and not reported in all the other countries. Guatemala, Peru and Bolivia had the highest percentage of households with bare-earth floor (23–47 %) and refrigerator (28–58 %). Moreover, Guatemala, Peru and Bolivia had the largest inequalities between low and high wealth tertiles in these households’ characteristics and assets.
Table 1 Survey characteristics: education, ethnicity and household characteristics and assets by high and low wealth tertiles and differences between high and low wealth tertiles in each survey

ARG, Argentina; BOL, Bolivia; BRA, Brazil; CHL, Chile; COL, Colombia; ECU, Ecuador; GTM, Guatemala; MEX, Mexico; PER, Peru; URY, Uruguay.
* Age group was 15–19 years.
† Among adult women.
‡ Proportion of indigenous ethnicity was 0.4 among all, and 0.3 among the high tertile.
Within countries
In Figs 1–3 we present equiplots showing the prevalence of stunting/short stature, anaemia and overweight and obesity in each country by age group among low and high wealth tertiles, low and high education levels, and indigenous and non-indigenous population. Lines denote the prevalence of absolute inequality or gap between socioeconomic and ethnic groups. In Table 2, we also present the prevalence difference by country and average difference across countries and age groups. Socially disadvantaged groups had a higher prevalence of stunting/short stature. On average, in all countries and age groups, those with low wealth, low education and indigenous ethnicity had a prevalence of 15, 18 and 19 pp higher, respectively, than those with high wealth, high education and non-indigenous ethnicity. These differences were very similar across age groups. Social inequalities in stunting/short stature were large (>3 pp difference) in all countries (except for Brazil and Uruguay) and age groups. The country with the largest social inequality in stunting/short stature was Mexico (range of differences across age groups and socioeconomic and ethnic indicators: 13–44 pp), followed by Guatemala (24–40 pp), Peru (15–38 pp), Ecuador (12–31 pp) and Bolivia (12–29 pp).

Fig. 1 Inequalities in stunting/short stature prevalence in Latin American countries. The longer the line between the two groups, the greater the absolute inequality (![]() , low/indigenous;
, low/indigenous; ![]() , high/non-indigenous). ARG, Argentina; BOL, Bolivia; BRA, Brazil; CHL, Chile; COL, Colombia; ECU, Ecuador; GTM, Guatemala; MEX, Mexico; PER, Peru; URY, Uruguay
, high/non-indigenous). ARG, Argentina; BOL, Bolivia; BRA, Brazil; CHL, Chile; COL, Colombia; ECU, Ecuador; GTM, Guatemala; MEX, Mexico; PER, Peru; URY, Uruguay

Fig. 2 Inequalities in anaemia prevalence in Latin American countries. The longer the line between the two groups, the greater the absolute inequality (![]() , low/indigenous;
, low/indigenous; ![]() , high/non-indigenous). ARG, Argentina; BOL, Bolivia; BRA, Brazil; CHL, Chile; COL, Colombia; ECU, Ecuador; GTM, Guatemala; MEX, Mexico; PER, Peru; URY, Uruguay
, high/non-indigenous). ARG, Argentina; BOL, Bolivia; BRA, Brazil; CHL, Chile; COL, Colombia; ECU, Ecuador; GTM, Guatemala; MEX, Mexico; PER, Peru; URY, Uruguay

Fig. 3 Inequalities in overweight and obesity prevalence in Latin American countries. The longer the line between the two groups, the greater the absolute inequality (![]() , low/indigenous;
, low/indigenous; ![]() , high/non-indigenous). ARG, Argentina; BOL, Bolivia; BRA, Brazil; CHL, Chile; COL, Colombia; ECU, Ecuador; GTM, Guatemala; MEX, Mexico; PER, Peru; URY, Uruguay
, high/non-indigenous). ARG, Argentina; BOL, Bolivia; BRA, Brazil; CHL, Chile; COL, Colombia; ECU, Ecuador; GTM, Guatemala; MEX, Mexico; PER, Peru; URY, Uruguay
Table 2 Malnutrition prevalence difference between wealth, education and ethnic subgroups
ARG, Argentina; BOL, Bolivia; BRA, Brazil; CHL, Chile; COL, Colombia; ECU, Ecuador; GTM, Guatemala; MEX, Mexico; PER, Peru; URY, Uruguay.
The prevalence of anaemia was also generally higher among socially disadvantaged groups, but the gap was smaller than the one we found for stunting/short stature. On average, in all countries and age groups, those with low wealth, low education and indigenous ethnicity had a prevalence of 6–7 pp higher than those with high wealth, education and non-indigenous ethnicity. The average gap was higher in children (range of difference across socioeconomic and ethnic indicators: 10–11 pp) than in adolescents and adults (3–5 pp). Countries with the largest social inequality in anaemia were Bolivia (range of difference across age groups and socioeconomic and ethnic indicators: 7–23 pp), Peru (0–16 pp) and Ecuador (–3 to 16 pp).
For overweight and obesity among children, the differences were very small (≤|3| pp) in most countries, and in cases where the difference was larger than this (Argentina, Brazil and Peru), the prevalence was predominantly lower among socially disadvantaged groups. Among adolescents and adult women by wealth and ethnicity, results were mixed; eleven cases were socially disadvantaged groups with a higher prevalence (>3 pp), fifteen cases were socially disadvantaged groups with a lower prevalence (<–3 pp) and seven cases with small differences (≤|3| pp). Results were also mixed by education among adolescent women. However, among adult women by education, except in Guatemala, those with low education had 11–34 pp higher prevalence of overweight and obesity compared to those with high education. The larger gaps among adult women were 27 and 34 pp in Chile and Argentina, respectively. Also noteworthy was the very large prevalence of overweight and obesity found in adult women with low education; it was ~80 % in Chile and Mexico and ~70 % in Argentina, Ecuador and Peru.
Between countries
In Fig. 4 we present the association between countries’ malnutrition (stunting and the sum of overweight and obesity) prevalence among children <5 years and countries’ socioeconomic and ethnic indicators. We found moderate and strong negative associations between stunting prevalence and countries’ GDP per capita and percentage of non-indigenous households (r = –0·58 and –0·71, respectively), whereas the association with the percentage of adult women with high education was weak (r = –0·29). With overweight and obesity prevalence, we found a weak positive association with countries’ GDP per capita and percentage of non-indigenous households (r = 0·22), and a very weak association with percentage of adult women with high education (r = 0·03). These results found in children were comparable to those found among adolescent and adult women (not presented).

Fig. 4 Association between country’s economic, education and ethnic characteristics and malnutrition (stunting and the sum of overweight and obesity) prevalence among children <5 years. ARG, Argentina; BOL, Bolivia; BRA, Brazil; COL, Colombia; ECU, Ecuador; GTM, Guatemala; MEX, Mexico; PER, Peru; URY, Uruguay
Discussion
In this introductory article, we summarised the results on within-countries malnutrition inequalities by wealth, education and ethnicity from the ten Latin American countries included in this supplemental issue. In addition, we performed an analysis to assess malnutrition inequalities between countries. We found that large inequalities remain for undernutrition among children <5 years and women of reproductive age in all countries, except for Uruguay and Brazil. These inequalities are very large in some countries; the highest was a 40 pp higher prevalence of stunting in low v. high wealth groups in Guatemala. Results were very different for overweight and obesity; among children <5 years, the prevalence was similar across subgroups in most countries. Among women of reproductive age, differences were heterogeneous by wealth and ethnicity (some countries have lower prevalence among the disadvantaged group; others have higher; and there was no difference in others), whereas lower education level was consistently a risk factor, and the association was stronger in adult women. Results in between-countries comparisons were consistent with those found within countries. Stunting/short stature prevalence at country level had a moderate and strong negative correlation with GDP and the proportion of non-indigenous population, whereas overweight and obesity prevalence had weak correlations with those indicators.
Among the countries analysed, those with the highest stunting/short stature and anaemia inequalities, such as Guatemala, Bolivia and Peru, were also the countries with the largest economic inequalities (as observed by the differences between low and high wealth tertiles in households’ characteristics and assets such as bare-earth floor, electricity and refrigerator). In a previous analysis that included 80 developing countries, it was also found that countries with a higher prevalence of child stunting tended to have larger socioeconomic inequalities(Reference Bredenkamp, Buisman and Van de Poel7). However, reductions over time in the prevalence of stunting have not been associated with reductions in inequalities, as this depends on how the reduction was achieved and the type of policies or programmes implemented for this purpose(Reference Restrepo-Mendez, Barros and Black9). With regard to economic inequalities, it is not surprising that countries with higher economic inequalities also tend to have higher undernutrition inequalities, given that the causes of undernutrition are deep-rooted in poverty(Reference Heltberg25). However, evidence suggests that income inequality is associated not only with health inequalities but also with worse health in the general population, including higher child stunting prevalence(Reference Pickett and Wilkinson26,Reference Larrea and Kawachi27) . This association has been reported even after adjusting for variables such as income, education and ethnicity, and it might be related to violence, mistrust, less social cohesion and development, and worse governance structures that arise in less egalitarian societies(Reference Larrea and Kawachi27).
On the other hand, there are countries such as Uruguay and Brazil with very low inequalities in stunting/short stature. Uruguay had the highest GDP per capita among the countries analysed and was also one of the countries with the smallest differences between low and high wealth tertiles in households’ characteristics and assets. However, Brazil was like Mexico in terms of GDP per capita and the distribution of education and households’ characteristics and assets across wealth tertiles, yet Brazil has successfully reduced stunting inequalities. An analysis in Brazil from 1974 to 2007 found that the steepest decline in child stunting inequalities was between 1996 and 2007. Related factors could be changes in economic growth in that decade, increases in the minimum wage and, therefore, improvements in the distribution of wealth, expansion of cash transfer programmes, improvements in maternal education by increasing access to, and the quality of, primary schools (which could be also related to a reduction in parity), and improvements in access to health care, including prenatal and postnatal care, water and sanitation(Reference Monteiro, Benicio and Conde28).
Inequalities in anaemia were lower in terms of absolute inequality compared to those documented for stunting/short stature. A recent analysis showed that although, in all the incoming groups (low, lower-middle, and upper-middle countries), children in households in the poorest quintile had the highest anaemia prevalence and those in households in the wealthiest quintile had the lowest anaemia prevalence, the gap between social groups was smaller than experienced by stunting(Reference Perez-Escamilla, Bermudez and Buccini29). One possibility is that because the prevalence of anaemia was generally lower in comparison to stunting/short stature, inequalities were also smaller.
The generalised trend of large inequalities for stunting that we observed in children <5 years, and no differences for overweight, is not unique to the Latin American region; the same pattern was seen in an analysis that included seventy-eight low- and middle-income countries from Africa, Asia and Latin America(Reference Black, Victora and Walker3). However, when it comes to adult women and overweight and obesity prevalence, the patterns were not uniform, most likely reflecting that Latin American countries are at different stages of epidemiological and nutrition transition. For instance, among adult women in Argentina, Chile and Uruguay, those from the low wealth tertile had a higher prevalence (>10 pp) than those in the high wealth tertile; in Brazil, Colombia, Ecuador and Mexico, the difference was smaller, whereas in Bolivia, Guatemala and Peru, the opposite was the case, and women from the low wealth tertile had a lower prevalence.
Noteworthy, in most of these countries, less-educated women showed a higher prevalence of overweight/obesity, except for Guatemala where more-educated women had a higher prevalence of overweight/obesity. Education has the potential to affect health and nutritional status by affecting a person’s receptivity to health education messages (health and nutrition literacy) and by influencing social standards of attractiveness(Reference McLaren and Kuh30), thereby underscoring recognition and the pursuit of attributes such as thinness and healthy lifestyles that are valued in developed societies(Reference McLaren and Kuh30,Reference McLaren31) . Therefore, given a higher prevalence of overweight and obesity in less-educated women, countries should give priority to the design of equity-based interventions that anticipate inequalities in obesity-related diseases. For example, countries should ensure education to women to improve information-based interventions (i.e. dietary guidelines and nutrition labelling systems should be provided in a single, easy-to-read format that could be used by everyone(Reference Mazariegos and Barnoya32–Reference Orozco, Ochoa and Muquinche34)), and implement structural interventions that change the environment (i.e. marketing regulation, reformulation, restrictions on unhealthy foods in schools) as these types of interventions are more likely to benefit all social groups equally(Reference Backholer, Beauchamp and Ball35). In addition, in countries with indigenous population, the pattern of overweight/obesity has been inconsistent. There were small gaps between indigenous and non-indigenous adolescent and adult women in Bolivia and Brazil. The non-indigenous women showed a higher prevalence of overweight/obesity in Ecuador, Guatemala, México and Peru, while the opposite was true for Colombia and Chile. It would be expected that non-indigenous populations have a higher prevalence of overweight because they usually live in peri-urban and urban areas where alarmingly rapid urbanisation and economic development force the population to shift from active to sedentary urban lifestyle and from traditional diets to non-traditional diets, including the consumption of ultra-processed foods and beverages and alcohol(Reference Montenegro and Stephens36). However, contrary to our expectation, we found that the association with ethnicity was inconsistent. A recent study has demonstrated that the urban–rural gap in mean BMI has closed; this along with an overexposure to obesogenic environments may explain this finding(37). Therefore, the maintenance of traditional culture and diets and the transformation of food systems are a priority for the prevention of nutrition-related chronic diseases in all social and ethnic groups(Reference Montenegro and Stephens36).
Between-countries analyses gave somewhat consistent results than within-country analyses. We found a strong and moderate negative association between stunting/short stature prevalence and higher GDP per capita (–0·58) and the proportion of non-indigenous population (–0·71), whereas there was a weak positive correlation (0·22) between overweight and obesity prevalence and GDP per capita and proportion of non-indigenous population among children. An important difference in the between-countries analyses was that the percentage of adult women with high education (>12 years) had a weak to very weak correlation with the prevalence of both forms of malnutrition. One reason might be that the quality of education is very different across countries, and hence its effect was diluted in between-countries comparisons. Moreover, we tested if basic education, instead of high education, was a more important determinant for stunting/short stature prevalence. We obtained a correlation with the group of adult women with high and medium education (>6 years); although we found a negative correlation with stunting/short stature prevalence, it was still weaker (~0·20; data not shown) than the GDP and ethnicity correlations.
Our results have policy implications. Our analysis showed that Latin American countries are in a situation of extreme vulnerability, facing a nutrition paradox that requires the implementation of effective and integrated multisectoral equity-based policies to reduce both inequities and all forms of malnutrition. In addition, our analysis demonstrates the urgent need of implementing double-duty actions with the potential to simultaneously address stunting, anaemia and/or obesity(Reference Hawkes, Demaio and Branca38). We must ensure that interventions designed to address one form of malnutrition do not raise the longer-term risks posed by other forms.
Our study is not without limitations. Although we attempted to use and analyse the data in the most comparable way, there are important differences between surveys such as the definitions of wealth and indigenous ethnicity. Additionally, surveys were implemented during different years (2005 and 2017); hence, differences in malnutrition prevalence and malnutrition inequalities between countries may not reflect their current state in epidemiological transition. Countries conduct health surveys at different intervals, and with varying frequencies; the implementation of regular health surveys should be encouraged in the region, as they are critical for monitoring inequalities in all forms of malnutrition and to promote inclusive health policies. Moreover, many countries were not included in this analysis, either because they do not have data available or because we did not find a research team that was willing to participate. Galicia et al. reported that from the forty-six countries/territories in Latin America and the Caribbean, twenty-two have information on anthropometry, and seventeen on anaemia, among children <5 years and women of reproductive age(Reference Galicia, Grajeda and de Romana39). Hence, our analysis is not meant to be a description of inequalities in the entire region, particularly considering that we did not have any Caribbean country included. Another limitation is that we only focused on sex and age groups, which were surveyed most frequently in all the countries included. The patterns of malnutrition inequalities might be different for other age and sex groups.
Despite these limitations, our study provides the most updated possible analysis of rates of malnutrition in all its forms in Latin America, highlighting social inequalities with three indicators (wealth/income, education and ethnicity). We included nationally representative surveys and conducted comparable analysis. Although not all age groups were considered, the inclusion of adolescent women was of great advance as this age group represents a critical period for growth and development. Our efforts could help to offer adolescent women more visibility in nutrition-related data and to target them in nutritional programmes because it has been recognised that 7000-d period and not only the 1000-d period is crucial to help youthreach their development potential(Reference Prentice, Ward and Goldberg40). Future efforts will be needed to include data on children during middle childhood (5–9 years) and adolescence (boys; 10–19 years) in population-based health surveys. Moreover, even though a large number of countries did not participate in this analysis, being able to include ten countries was an important effort considering that all research teams volunteered their time.
In conclusion, given the nutritional, socioeconomic and ethnic inequalities prevalent in Latin America, there is an urgent need to implement equity-based multisectoral nutritional programmes and policies over the long term to improve the nutritional status of the most socially disadvantaged population and to address political drivers of all forms of malnutrition. Stunting/short stature and anaemia were more prevalent among low-income, less-educated and indigenous population, and inequities were wider than that of their high-income, more-educated and non-indigenous counterparts. Therefore, programmes and policies to address undernutrition should focus on socially disadvantaged populations. In contrast, excess weight disproportionally affects all groups, and inequities are narrower and inconsistent. Thus, contrary to developed countries where excess weight consistently affects more low-income population, in Latin America, this is only the case for some countries and age groups. Actions should be taken to promote less obesogenic environments across all social groups. But these actions should be reinforced and emphasised among those who have inequitable access to health and other resources, as we already see indications that obesity could affect them more.
Acknowledgements
Acknowledgements: The authors thank the Latin American Nutrition Leadership Program (Programa Lilanut) for coordinating this supplement and all the authors who participated in this supplemental issue and their institutions for providing summarised data analysed in this article. Financial support: DSM Nutritional Products provided funds for the publication of this manuscript. They had no role in the design, analysis or writing of this article. Conflict of interest: There are no conflicts of interest. Authorship: C.B., M.M. and J.A.R. designed the study; C.B. and M.M. analysed the data and wrote the article; J.A.R., R.M. and A.G. made comments to the article. Ethics of human subject participation: Not applicable. This study was based on the information reported in each article included in the supplemental issue.


