


Hypertension is an important contributor to the burden of disease in South Africa. There is convincing evidence that a high Na intake contributes to the development of hypertension( Reference Kotchen, Cowley and Frohlich 1 , Reference O’Donnell, Mente and Rangarajan 2 ). Accurate estimation of population Na intake is crucial for monitoring trends in Na intake. Estimating Na intake by means of dietary questionnaires does not accurately reflect actual Na intake( Reference Espeland, Kumanyika and Wilson 3 – Reference Clark and Mossholder 5 ). The amount of Na excreted in the urine is, however, a more acceptable method.
Twenty-four hours is the minimum time required to characterise the pattern of urinary excretion for a given individual( Reference Elliot and Brown 6 ). The 24 h urine collection method (one or more) is considered the ‘gold standard’ in determining Na intake in individuals as well as in population groups( Reference Bingham 7 ). It should be noted that for estimation of individual Na excretion, a single measurement would not be sufficient as highlighted by Ji et al.( Reference Ji, Dary and Campbell 8 ). However, alternative methods have been proposed due to the high methodological burden of a 24 h urine collection in large population-based studies. As reported in a recent systematic review, initiatives for finding a replacement for 24 h urinary collection, that do not compromise data accuracy, are high on the agenda( Reference Ji, Sykes and Paul 9 ).
Mente et al. indicated in 2014 that spot urine samples from the Prospective Urban and Rural Epidemiological (PURE) study may be representative of the Na intake of the group despite the fluctuations in values for individuals( Reference Mente, O’Donnell and Dagenais 10 ). This was also shown earlier by Tanaka et al.( Reference Tanaka, Okamura and Miura 11 ) in 2002. However, this methodology was greatly criticised( Reference Cogswell, Mugavero and Bowman 12 – Reference Campbell 14 ) when the PURE study authors used spot urine samples to indicate the potentially harmful effects of very low salt intake on cardiovascular health and mortality( Reference O’Donnell, Mente and Rangarajan 2 , Reference Mente, O’Donnell and Rangarajan 15 ).
As spot urine samples are affordable and easy to obtain, they would be valuable in monitoring Na intake particularly in resource-poor settings or where 24 h urine collections are not deemed feasible. Validity is also needed in terms of estimating a population’s Na intake above a specific threshold, i.e. classifying what percentage of the population is above the recommended 2000 mg of Na or 5 g of salt per day( 16 ). However, the validity of spot urine samples is still inconclusive( Reference Elliot and Brown 6 , Reference Ji, Sykes and Paul 9 ) and specific ethnic subgroup analyses are also needed to determine whether certain equations are better suited for a specific population. Recently, South Africa developed a national strategy to reduce the Na intake of the population( 17 ) and has implemented a national Na reduction regulation (R.214) to regulate the Na content in certain processed foods( 18 ). Therefore, reliable, ongoing population-wide data on Na intake are necessary to monitor the progress and the effectiveness of public health efforts to curb the high hypertension rates.
For this reason, the first objective of the present study was to estimate the proportion of the population ‘below’ the 2000 mg Na/d threshold, using a single spot urine sample compared with a 24 h urine sample. The second objective was to provide some clarity on how to estimate the absolute difference in South Africans’ salt consumption (i.e. the effectiveness of the Na reduction regulation) in terms of using a single spot urine sample or not.
Methods
Participants
Participants were recruited from three ongoing studies, two in the North West Province and one in KwaZulu-Natal, and included individuals of different age categories, ethnicity and gender. All relevant data were collected between 2013 and 2015. In all studies, the data were cross-sectional in nature. Details concerning the studies are summarised elsewhere( Reference Swanepoel, Schutte and Cockeran 19 ).
First, we collected data from the African PRospective study on the Early Detection and Identification of Cardiovascular disease and hyperTension (African-PREDICT study). The participants included black and white men and women (aged between 20 and 30 years) who were apparently healthy and normotensive, and not using chronic medication. The Thusa-Bothle study included older black women (35–65 years), who were apparently healthy, from an urban community in the North West Province of South Africa. Lastly, data were collected in an urban area in the KwaZulu-Natal Province of South Africa. The latter study included apparently healthy Indian women between the ages of 18 and 50 years.
Urine collection
Participants from all three studies were given the same collection instructions by a trained field researcher. Each participant was provided with the necessary equipment (collection kit) to collect both a 24 h urine and a spot urine sample. On a day that was convenient for the participant, he/she was instructed to discard the ‘first pass urine’ on the morning of the start of his/her collection and collect all the urine passed thereafter, ending with the first urine of the following morning. This first urine collection of the following morning was collected and divided into a spot urine sample (collected in a separate container) and the rest of the urine, which was added to the larger container (with the rest of the 24 h urine). The start and end times were also recorded. After an aliquot was taken from the spot urine sample, the remaining urine in the spot urine sample was also added to the large container before aliquoting of the 24 h urine sample.
To check for completeness of the 24 h urine samples, the following cut-off points were used: volume of the 24 h urine collection >500 ml and urinary creatinine (Cr) >4·0 mmol/d for women or >6·0 mmol/d for men( Reference Stolarz-Skrzypek, Kuznetsova and Thijs 20 ).
Biochemical analysis, blood pressure and anthropometric measurements
After careful aliquoting of the 24 h and spot urine samples, the samples were stored at −20 °C until analysis. For 24 h and spot urine samples, Na, K and Cr were measured as described in Swanepoel et al.( Reference Swanepoel, Schutte and Cockeran 19 ).
The measurements of blood pressure, height and weight in the African-PREDICT study were performed using appropriate methods, and are described elsewhere( Reference Thompson, Smith and Ware 21 ). As described in Thompson et al.( Reference Thompson, Smith and Ware 21 ), with the participants seated, clinic blood pressure recordings were measured at the brachial artery, twice on each arm (DINAMAP; GE Healthcare, Buckinghamshire, UK)( Reference Reinders, Reggiori and Shennan 22 ), and a mean of the four readings was then used for all subsequent analyses. There was a rest period of 5 min between each measurement and appropriate-sized blood pressure cuffs were used. Blood pressure of the black and Indian women was measured on a semi-automatic blood pressure device (M3W-HEM7202; OMRON Healthcare, Kyoto, Japan)( Reference Swanepoel, Schutte and Cockeran 19 ) using the participants’ right arm after a 5 min rest in the sitting position with legs uncrossed. Readings were done in duplicate with a 3 min interval between the two readings.
BMI was calculated as [weight (kg)]/[height (m)]2. The participants’ weight was measured to the nearest 0·01 kg (in duplicate) with a digital scale (Seca 813, Hamburg, Germany) and height to the nearest 0·1 cm using a stadiometer (Seca 264, Hamburg, Germany). The waist circumference of both the black and Indian women was measured in triplicate to the nearest 0·1 cm at the midpoint between the lowest rib and the top of the iliac crest, using a steel tape (Lufkin, Apex, NC, USA).
Calculation formulas used
Na and K from the 24 h urine collections were converted from mmol/d to mg/d by multiplying by 23 and 39, respectively. Salt was calculated by multiplying the mmol Na by 58·9 (combined molecular weight of Na and Cl).
To estimate 24 h urinary Na from spot urine the following three formulas were used.
Kawasaki formula( Reference Kawasaki, Itoh and Uezono 23 ):
 $$\eqalignno{ & {\rm Estimated\,24\,h\,Na\,(mmol/d)} \cr &\quad{\equals}\,16\!\cdot \!3 {\times}\sqrt {{\rm spot\,Na (mmol/l)\,/\,(spot\,Cr\,(mg/dl)}{\times}{\rm 10)}} \cr & \qquad{\times}{\rm (predicted\,24\,h\,urinary\,Cr\,(mg/d)),} $$
where
 $$\hskip-25pt\eqalignno{ & {\rm Predicted\,Cr\,(mg/d)} \cr & \quad{\equals}\,{\minus}4\!\cdot\!{\rm 72}{\times}{\rm age\,(years)}{\plus}{\rm 8}\!\cdot\!{\rm 58}{\times}{\rm weight\,(kg)} \cr & \qquad{\plus}5\!\cdot\!{\rm 09}{\times}{\rm height\,(cm)}{\minus}{\rm 74}\!\cdot\!{\rm 5}\, ({\rm women)} $$
and
 $$\hskip-20pt\eqalignno{ & {\rm Predicted\,Cr\,(mg/d)} \cr & \quad{\equals}\,{\minus}12\!\cdot\!63{\times}{\rm age\,(years)}{\plus}15\!\cdot\!12{\times}{\rm weight\,(kg)} \cr & \qquad{\plus}7\!\cdot\!39{\times}{\rm height\,(cm)}{\minus}79\!\cdot\!9\, ({\rm men)}{\rm .} $$
INTERSALT formula( Reference Brown, Dyer and Chan 24 ):
 $$\eqalignno{ & \hskip6pt{\rm Estimated\,24\,h\,Na\,(mg/d)} \cr & \hskip-6pt\qquad{\equals}\,23{\times}[5\!\cdot\!07{\plus}(0\!\cdot\!34{\times}{\rm spot\,Na\,(mmol/l)]} \cr & \hskip6pt\qquad{\minus}(2\!\cdot\!16{\times}{\rm spot\,Cr\,(mmol/l))} \cr & \hskip6pt\qquad{\minus}(0\!\cdot\!09{\times}{\rm spot\,K\,(mmol/l))}{\plus}(2\!\cdot\!39{\times}{\rm BMI\,(kg/m}^{{\rm 2}} {\rm ))} \cr & \hskip6pt\qquad{\plus}(2\!\cdot\!35{\times}{\rm age\,(years))}{\minus}(0\!\cdot\!03{\times}{\rm age}^{2} {\rm (years))]}\, {\rm (women)} $$
and
 $$\eqalignno{ & \hskip2pt{\rm Estimated\,24\,h\,Na\,(mg/d)} \cr & \hskip2pt\quad{\equals}\,23{\times}[25\!\cdot\!46{\plus}(0\!\cdot\!46{\times}{\rm spot\,Na\,(mmol/l)]} \cr & \hskip1pt\qquad{\minus}(2\!\cdot\!75{\times}{\rm spot\,Cr\,(mmol/l))} \cr & \hskip1pt\qquad{\minus}(0\!\cdot\!13{\times}{\rm spot\,K (mmol/l))}{\plus}(4\!\cdot\!10{\times}{\rm BMI (kg/m}^{{\rm 2}} {\rm ))} \cr & \hskip1pt\qquad{\plus}(0\!\cdot\!26{\times}{\rm age\,(years))]}\, {\rm (men)}{\rm .} $$
Tanaka formula( Reference Tanaka, Okamura and Miura 11 ):
 $$\hskip-38pt{\rm Estimated\,24\,h\,Na\,(mmol/d)}{\equals}\,21\!\cdot\!98{\times}{\rm XNa}^{{{\rm 0}\,\!\cdot\!\,{\rm 392}}} {\rm ,}$$
where
 $$\hskip-10pt\eqalignno{ &{\rm XNa}\,{\equals}\,[{\rm spot\,Na\,(mmol/l)\,/\,(spot\,Cr\,(mg/dl)}\,{\times}\,{\rm 10)]} \cr & \quad\qquad{\times}{\rm (predicted\,24\,h\,urinary\,Cr\,(mg/d))}$$
and
 $$\hskip-10pt\eqalignno{ & {\rm Predicted\,Cr\,(mg/d)} \cr & \quad{\equals}\,({\minus}2\!\cdot\!04{\times}{\rm age\,(years))}{\plus}(14\!\cdot\!89{\times}{\rm weight\,(kg))} \cr & \qquad{\plus}(16\!\cdot\!14{\times}{\rm height\,(cm))}{\minus}2244\!\cdot\!45. $$
To estimate 24 h K excretion, the Kawasaki and Tanaka formulas were used. The INTERSALT formula is not designed to estimate K excretion and was therefore not used.
Kawasaki formula( Reference Kawasaki, Itoh and Uezono 23 ):
 $$\eqalignno{ & {\rm Estimated\,24\,h\,K\,(mmol/d)} \cr & \quad{\equals}\,7\!\cdot\!2{\times}\sqrt {{\rm spot\,K\,(mmol/l)\,/\,(spot\,Cr\,(mg/dl)}{\times}{\rm 10)}} \cr & \qquad{\times}{\rm (predicted\,24\,h\,urinary\,Cr\,(mg/d)),} $$
where
 $$\hskip-20pt\eqalignno{ & {\rm Predicted\,Cr\,(mg/d)} \cr & \quad{\equals}\,{\minus}4\!\cdot\!{\rm 72}{\times}{\rm age\,(years)}{\plus}{\rm 8}\!\cdot\!{\rm 58}{\times}{\rm weight\,(kg)} \cr & \qquad{\plus}5\!\cdot\!{\rm 09}{\times}{\rm height\,(cm)}{\minus}{\rm 74}\!\cdot\!{\rm 5}\, ({\rm women)} $$
and
 $$\hskip-15pt\eqalignno{ & {\rm Predicted\,Cr\,(mg/d)} \cr & \quad{\equals}\,{\minus}12\!\cdot\!63{\times}{\rm age\,(years)}{\plus}15\!\cdot\!12{\times}{\rm weight\,(kg)} \cr & \qquad{\plus}7\!\cdot\!39{\times}{\rm height\,(cm)}{\minus}79\!\cdot\!9\, ({\rm men)}{\rm .} $$
Tanaka formula( Reference Tanaka, Okamura and Miura 11 ):
 $$\hskip-45pt{\rm Estimated\,24\,h\,K\,(mmol/d)}\,{\equals}\,7\!\cdot\!59{\times}{\rm XK}^{{{\rm 0}\!\,\cdot\!\,4{\rm 31}}} {\rm ,}$$
where
 $$\eqalignno{ &{\rm XK}\,{\equals}\,[{\rm spot\,K\,(mmol/l)\,/\,(spot\,Cr\,(mg/dl)}{\times}{\rm 10)]} \cr & \qquad{\times}{\rm (predicted\,24\,h\,urinary\,Cr\,(mg/d))}$$
and
 $$\hskip-10pt\eqalignno{ & {\rm Predicted\,Cr\,(mg/d)} \cr & \quad{\equals}\,({\minus}2\!\cdot\!04{\times}{\rm age\,(years))}{\plus}(14\!\cdot\!89{\times}{\rm weight\,(kg))} \cr & \qquad{\plus}(16\!\cdot\!14{\times}{\rm height\,(cm))}{\minus}2244\!\cdot\!45. $$
Statistical analyses
The population was stratified according to the different studies, ethnicity and gender. To analyse agreement between the measured Na (and K) excretion (24 h urine sample) and the estimated Na (and K) excretion (spot urine samples, for all three (two) formulas), Bland–Altman plots were used( Reference Altman and Bland 25 ). The degree of bias was also calculated with the 95 % CI. The bias for each individual is the measured Na or K intake (24 h urine sample) minus the predicted (using Kawasaki, Tanaka and INTERSALT formulas) Na or K intake divided by the mean of the predicted and measured 24 h urinary Na or K excretion. We further calculated the possibility of proportional bias by conducting a linear regression with the difference (between the measured and predicted Na or K excretion) and the mean (between the predicted and measured Na or K intake). The β value of the regression should be as close to zero as possible with an insignificant P value to indicate no proportional bias. Correlations between estimated Na (and K) excretion from a spot urine sample (using the three (two) different formulas) and the measured 24 h urine sample were calculated using intraclass correlation coefficients.
Sensitivity and specificity of the estimated Na excretion (based on spot urine samples) to correctly classify the mean Na intake of this population as above or below the WHO’s recommended 2000 mg Na/d were also assessed by using the following equations:
 $${\rm Sensitivity}\,{\equals}\,{{{\rm Na}_{{{\rm spot}}} \,\gt\,{\rm 2000 \,mg/d}{\times}{\rm Na}_{{{\rm 24 h}}} \,\gt\,{\rm 2000 \,mg/d}} \over {{\rm Na}_{{{\rm 24 h}}} \,\gt\,{\rm 2000 \,mg/d}}}$$
and
 $${\rm Specificity}\,{\equals}\,{{{\rm Na}_{{{\rm spot}}} \,\lt\,{\rm 2000 \,mg/d}{\times}{\rm Na}_{{{\rm 24 h}}} \,\lt\,{\rm 2000 \,mg/d}} \over {{\rm Na}_{{{\rm 24 h}}} \,\lt\,{\rm 2000 \,mg/d}}}.$$
Results
We collected 24 h urine as well spot urine samples from 470, 104 and 107 participants from the African-PREDICT, Thusa-Bothle and KwaZulu-Natal study, respectively. The characteristics of the three populations studied are summarised in Table 1. The average age and BMI of this population was 35·5 years and 27·8 kg/m2, respectively. More women (n 476) than men (n 205) were included in the present study. Further details of the characteristics of this population and the differences between subgroups are described elsewhere( Reference Swanepoel, Schutte and Cockeran 19 ).
Table 1 Characteristics of the populations analysed in the present study
WC, waist circumference; SBP, systolic blood pressure; DBP, systolic blood pressure.
In Table 2 we compare Na excretion obtained from 24 h collections with estimated Na values from spot samples, based on the three formulas described. The Kawasaki and Tanaka formulas showed significantly higher (P≤0·001) estimated Na values than the measured 24 h excretion in the whole population (5677·79 and 4235·05 v. 3279·19 mg/d, respectively). In the younger white (3547·81 v. 3352·27 mg/d) and black individuals (3560·6 v. 3417·57 mg/d), the Tanaka formula did not differ from the 24 h measurement. The INTERSALT formula also did not differ from the measured 24 h excretion, for the whole population. In all population groups except for the Indian population (3523·12 v. 2683·08 mg/d), the INTERSALT formula underestimated the Na excretion. The Kawasaki formula seemed to overestimate Na excretion in all subgroups tested and also showed the highest degree of bias (−2242 mg/d, 95 % CI −10 659, 6175), whereas the INTERSALT formula had the lowest bias (161 mg/d, 95 % CI −4038, 4360).
Table 2 Summary of results: comparison between the different methods of estimating 24 h sodium excretion v. measured excretion in different population groups in South Africa
AP, African-PREDICT study; TB, Thusa-Bothle study; KNZ, KwaZulu-Natal study; ICC, intraclass correlation coefficient.
* Significantly higher than 24 h measured excretion.
† Greater bias than INTERSALT.
‡ Significantly lower than 24 h measured excretion.
§ Significant (P≤0·001), indicating proportional bias.
║ P value=0·005.
The β values of the linear regression were above zero and significant in the INTERSALT formula, but not in the Kawasaki and Tanaka formulas. There were no significant and strong correlations (interclass correlation coefficients) observed, except for the INTERSALT (0·2, 95 % CI−0·5, 0·3) formula in the whole population.
More importantly, analysis of sensitivity and specificity showed more or less the same pattern in all three formulas when estimating Na excretion, with a high sensitivity (>90 %) and a very low specificity (<10 %).
K excretion was estimated only by the Kawasaki and Tanaka formulas (Table 3). The Kawasaki formula overestimated K excretion in the young white (2355·28 v. 1722·71 mg/d) and black (2290·24 v. 1632·59 mg/d) populations. The Tanaka underestimated the K value in all population groups. The degree of bias was the lowest in the Kawasaki formula (−782 mg/d, 95 % CI −6930, 5366). There were also no significant correlations observed in either of the two formulas. Analysis of both sensitivity (8·11 %) and specificity (7·35 %) showed low values when estimating K excretion with the Kawasaki formula; corresponding values were 0·0 and 0·2 % with the Tanaka formula, respectively.
Table 3 Summary of results: comparison between the different methods of estimating 24 h potassium excretion v. measured excretion in different population groups in South Africa
AP, African-PREDICT study; TB, Thusa-Bothle study; KNZ, KwaZulu-Natal study; ICC, intraclass correlation coefficient.
* Significantly higher than 24 h measured excretion.
† Significant (P≤0·001), indicating proportional bias.
‡ Significantly lower than 24 h measured excretion.
§ Greater bias than Kawasaki.
Bland–Altman plots (Fig. 1) showed inconsistent Na estimations across low and high levels of 24 h Na excretion. The mean difference of the Kawasaki and Tanaka formula was −2221 and −836·8 mg/d, respectively, with a wide limit of agreement. The INTERSALT formula overestimated 24 h Na excretion between 0 and 5000 mg/d (0–12·5 g salt) and underestimated Na excretion above 5000 mg/d (>12·5 g of salt). For 24 h K excretion, the Kawasaki formula both overestimated and underestimated K intake and the Tanaka formula overestimated K intake at high levels.
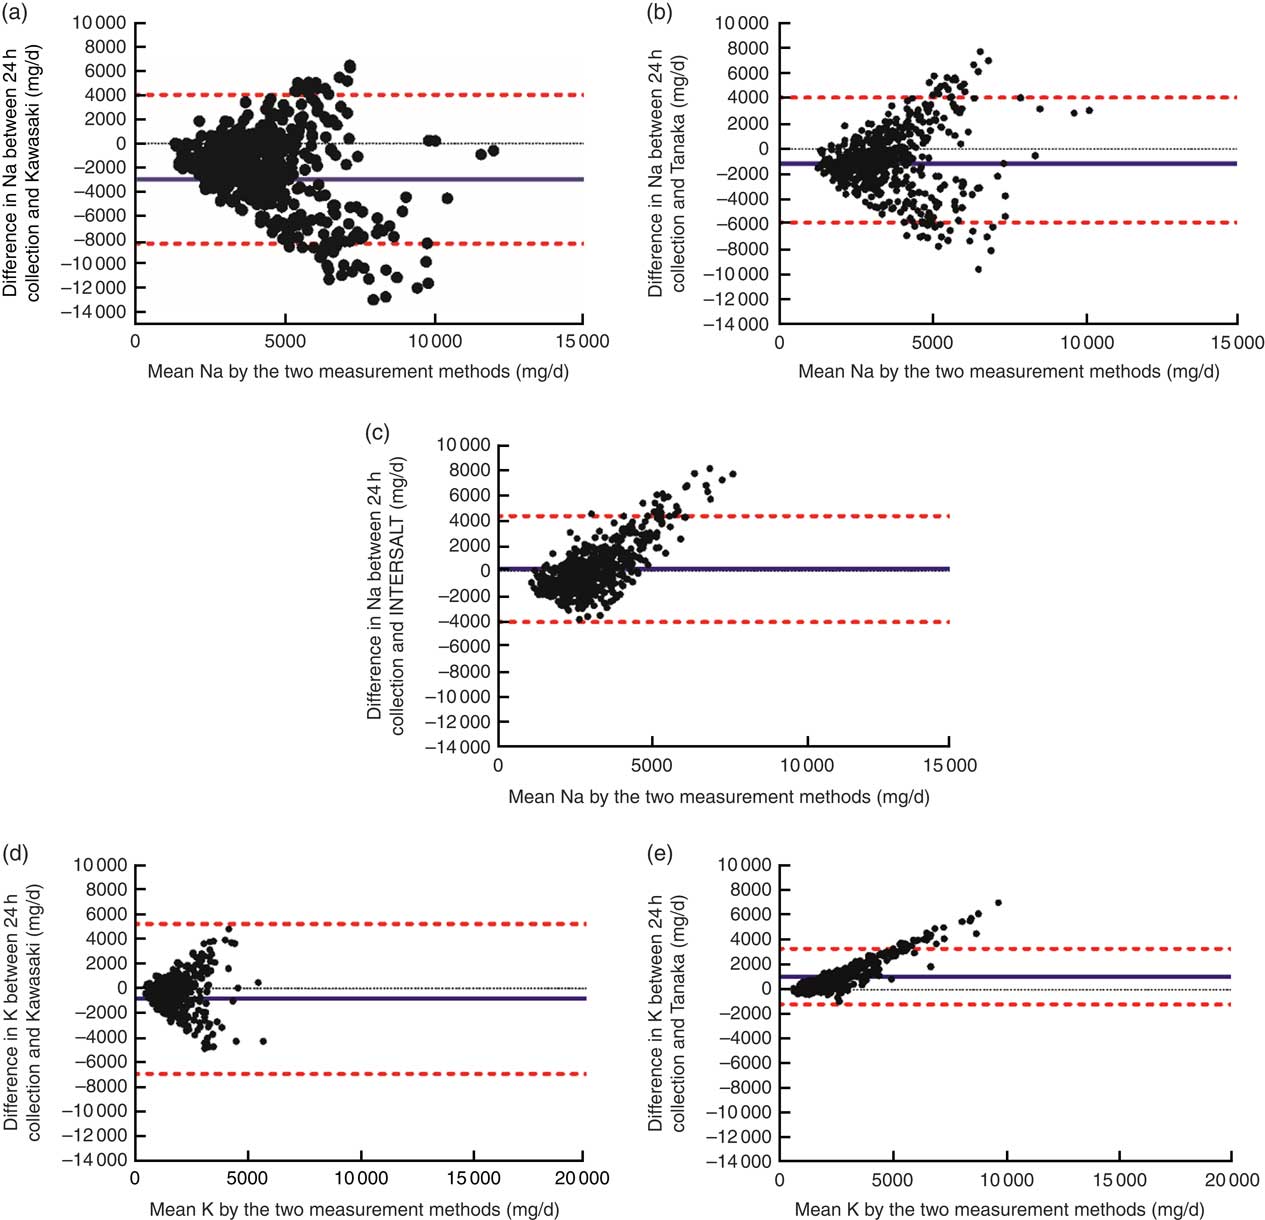
Fig. 1 (colour online) Bland–Altman plots comparing measured v. estimated 24 h sodium and potassium excretion using different formulas: (a) measured v. Kawasaki formula for sodium; (b) measured v. Tanaka formula for sodium; (c) measured v. INTERSALT formula for sodium; (d) measured v. Kawasaki formula for potassium; (e) measured v. Tanaka formula for potassium. ![]() , upper and lower limits of agreement calculated as the mean difference±1·96×sd;
, upper and lower limits of agreement calculated as the mean difference±1·96×sd;
![]() , mean difference between the measured and predicted intake
, mean difference between the measured and predicted intake
Discussion
The present study set out to estimate the proportion of the population ‘below’ the 2000 mg Na/d threshold, using a single spot urine sample compared with a 24 h urine sample, and to provide some evidence on how to estimate the absolute difference in South Africans’ salt consumption in terms of using a single spot urine sample.
From the results presented, one might be tempted to conclude that the INTERSALT formula can be used to estimate Na excretion in the South African population because of non-significant difference compared with the 24 h excretion. The same can be said for the Tanaka formula in young black and white populations. However, when we look at the totality of the results (i.e. degree of bias, sensitivity and specificity), this is not true. Even though the INTERSALT formula provided a non-significant difference with the 24 h excretion and showed the least biased information about the group mean 24 h Na excretion, it should be noted that a bias of approximately 0·4 g salt equivalent/d was still present. This suggests that the INTERSALT formula would be unable to detect an average change in salt consumption at two time points in the evaluation of the Na reduction regulation. This formula will therefore be unable to detect small changes in population salt consumption (~0·4 g/d) and unable to detect small increases in the proportion of the population below the stated threshold. The same can be seen in both the Kawasaki (bias of 5·6 g salt) and the Tanaka (bias of 2·1 g salt) formulas.
Our results are different from those reported by Mente et al.( Reference Mente, O’Donnell and Dagenais 10 ), who found that the Kawasaki formula showed the best agreement and the least bias when compared with the other two formulas. The INTERSALT had the highest degree of bias and the weakest correlation compared with the Kawasaki and Tanaka formulas( Reference Mente, O’Donnell and Dagenais 10 ). Cogswell et al.( Reference Cogswell, Wang and Chen 26 ) conducted a cross-sectional study to evaluate the validity of these three formulas with a 24 h urine sample in young Americans. They reported that the INTERSALT formula provided the least bias when compared with Kawasaki and Tanaka formulas and would be recommended in America for the monitoring of Na intake. As observed in our study, it must still be noted that even though the bias was smaller compared with the other formulas, a bias of 0·4 g salt/d was still present, which is the same as reported in the current study and is unable to detect differences.
In terms of the correlations of the three formulas, the INTERSALT had a weak but significant correlation in the whole group. Kawasaki et al.( Reference Kawasaki, Itoh and Uezono 23 ) reported a correlation of 0·53 and Tanaka et al.( Reference Tanaka, Okamura and Miura 11 ) a correlation of 0·54 between the predicted and actual 24 h excretion. Our study reported much weaker correlations (Kawasaki=0·03 and Tanaka=0·05). The hypothesis on which the Kawasaki and Tanaka formulas are based does not seem to relate to the South African population and could be a possible reason for not observing the same correlations. Cr values are highly influenced by weight (and BMI) and are used to form the hypothesis of these two formulas. The same issues of Cr and the variability thereof was raised by Campbell( Reference Campbell 14 ), who stated that Cr, among other parameters, is highly impacted by variation in assessment methods. The Kawasaki and Tanaka formulas were developed and tested in a Japanese population with a mean BMI (in women) of 21·4 and 22·1 kg/m2, respectively. The mean BMI of the women included in the present population was 28·6 kg/m2; therefore, a population that was overweight v. a population of normal weight. Both the Tanaka and INTERSALT formulas were developed and validated in young populations( Reference Tanaka, Okamura and Miura 11 , Reference Brown, Dyer and Chan 24 ), whereas the Kawasaki formula( Reference Kawasaki, Itoh and Uezono 23 ) was validated in a wider age group.
According to a systematic review done by Ji et al.( Reference Ji, Sykes and Paul 9 ), the INTERSALT study( 27 ) produced the most convincing evidence with regard to the feasibility and usefulness of the 24 h urine collection. The INTERSALT study was conducted in fifty-two different populations. As mentioned, the method of Tanaka( Reference Tanaka, Okamura and Miura 11 ) and Kawasaki( Reference Kawasaki, Itoh and Uezono 23 ) is population specific (Japanese individuals) and requires internal calibration with age, weight and Cr. It also has been reported to overestimate low intakes and underestimate high intakes( Reference Ji, Miller and Venezia 28 ).
Even though the INTERSALT formula showed the least bias and did not differ from the measured Na intake in a South African population, research on developing a formula based on the INTERSALT should be approached with caution. The INTERSALT was carried out in the 1980s in different low- and middle-income countries. The age, BMI and Cr distributions have changed substantially with the epidemiological transition, resulting in these parameters perhaps not being directly applicable today and in this population. As suggested by Cogswell et al., designing a study to standardise mean estimated Na intake from spot urine samples among a small group within the larger population may better inform monitoring at a population level and could be viable in South Africa( Reference Cogswell, Wang and Chen 26 ). Furthermore, research should investigate differences of the predictions of spot urine samples that were collected at different times in the day within this population. Kawasaki et al.( Reference Kawasaki, Itoh and Uezono 23 ) reported an even stronger correlation when participants collected three 24 h urine samples, and this should also be considered for future research.
Sensitivity is the proportion of true positives that are correctly identified by the estimation formulas( Reference Altman and Bland 29 ) and can be seen as not that important in this context. In other words, 99·30, 98·59 and 95·44 % of the estimations from the Kawasaki, Tanaka and INTERSALT formulas correctly classified individuals who had Na intake above 2000 mg/d. Specificity, on the other hand, is the proportion of true negatives that are correctly identified by the estimation formulas( Reference Altman and Bland 29 ) and can be seen as paramount in this context. Only 2·60, 3·90 and 11·39 % of the estimations by the Kawasaki, Tanaka and INTERSALT formulas correctly identified individuals having Na excretion below 2000 mg/d. Therefore, the different formulas are able to identify true positives (sensitivity), but fail to identify true negative individuals (specificity). This will translate into the formulas overestimating Na excretion and classifying individuals with low Na intake as having high Na intake (low specificity). In other words, all three formulas will be unable to detect successful outcome of the Na reduction strategy in the population, with immediate risk to the continuation of the programme. This is of extreme importance, not only for South Africa as a country in establishing the success of its Na regulation, but also globally to report and assess which interventions are more likely to be achievable. All these considerations should be kept in mind when using these formulas in estimating Na excretion in a population setting.
With regard to K intake estimations, the Kawasaki formula overestimated and the Tanaka formula underestimated the K intake compared with the 24 h excretion. No correlation was found for either of these formulas; however, the Kawasaki reported the lowest degree of bias. These formulas are also based on the same hypothesis as explained earlier and were developed for a population with a much lower BMI than the current population (which means the Cr values will differ significantly). A formula should be developed for estimating K accurately in the South African or similar population, as K is crucial in monitoring health in a country. The sensitivity and specificity of the formulas to correctly identify true positive and negatives were very low, and therefore it is not advised to use these two formulas in estimating K excretion.
Our study had some limitations. Our sample was not representative of the whole of South African population and we collected only one 24 h urine sample from each participant. Another limitation of the study is that the spot urine sample was collected as part of the 24 h urine sample and not as an independent sample. This makes it difficult to compare the results of our INTERSALT formula with the original INTERSALT results as these latter samples were collected as independent samples and poses a potential problem when comparing studies and formulas( Reference Ji, Dary and Campbell 8 , Reference Ji, Sykes and Paul 9 , Reference Ji, Miller and Venezia 28 ). Although the heterogeneity of the present study is a limitation on the one hand, it provides us with the opportunity to review our findings in different settings and populations and closely imitates a ‘real-world’ situation.
To conclude, in most countries of the world, programmes of population salt reduction will be likely to reduce salt consumption – although they may not be able to bring levels below thresholds in the short term. Therefore, it is important that the measure of salt intake used is able to detect absolute changes in salt consumption, irrespective of thresholds. Our findings suggest that not one of the formulas is suitable to use in a South African population and efforts need to be made to investigate modern internal validation within the population when developing a new formula. If inaccurate methods are used for estimating Na excretion and establishing changes over time, the continuation of an Na reduction programme could be wrongfully ended or misinterpreted.
We agree with other authors( Reference O’Donnell, Mente and Rangarajan 2 , Reference Brown, Dyer and Chan 24 , Reference Cogswell, Wang and Chen 26 ), in that estimated Na excretion from spot urine samples may possibly be used to monitor trends in the population, but the WHO’s statement of ‘until more studies are carried out to assess simpler but reliable methods of urine collection for the purpose of estimating daily excretions [of sodium], 24-hour urine collections are recommended’ is still supported until more conclusive evidence is produced with regard to the use of spot urine in Na intake monitoring.
Acknowledgements
Acknowledgements: The authors are grateful to all individuals participating voluntarily in the studies. The dedication of the research staff and students at the Hypertension Research and Training Clinic at the North-West University is also duly acknowledged. The authors would also like to acknowledge Mary Hoffman for her language editing skills. Financial support: The African-PREDICT study was financially supported by the South African Medical Research Council (SAMRC) with funds from National Treasury under its Economic Competitiveness and Support Package; the South African Research Chairs Initiative (SARChI) of the Department of Science and Technology and National Research Foundation of South Africa; as well as corporate social investment grants from Pfizer (South Africa), Boehringer Ingelheim (South Africa), Novartis (South Africa), the Medi-Clinic Hospital Group (South Africa) and in-kind contributions of Roche Diagnostics (SA). The project as a whole was supported by the Medical Research Council of South Africa (Self-Initiated Research grant). None of the funders, including the SAMRC, had any role in the design, analysis or writing of this article. The lead author was supported by the National Research Foundation’s (NRF) Innovation Doctoral Scholarships grant (grant number 89778). Any opinion, findings and conclusions or recommendations expressed in this material are those of the authors and, therefore, the NRF does not accept any liability in this regard. Conflict of interest: None. Authorship: B.S. formulated the research questions, collected and analysed all data used in this article, assisted with the statistical analysis of data and wrote the manuscript. A.E.S. designed the African-PREDICT study, assisted in formulating the research question as well as the statistical analysis and critically reviewed the manuscript. M.C. conducted all statistical analysis for the manuscript. K.S. critically reviewed the manuscript. E.W.-V. formulated the research question, conceptualised the article and critically reviewed the manuscript. Ethics of human subject participation: All the included studies were conducted according to the guidelines laid down in the Declaration of Helsinki and all the procedures involving human participants were approved by the various ethics committees (NWU-0001-12-A1, NWU-00060-14-A1 and IREC 035/14). Written informed consent was obtained from each of the participants. Additional approval from the Health Research Ethics Committee was obtained to perform analyses on Na and K intakes (NWU-00085-15-S1).


