Limited health literacy is associated with poorer health outcomes(Reference Neilson-Bowman1, Reference Berkman, Sheridan and Donahue2), disproportionately affecting minority populations, older adults and persons with lower educational attainment and/or lower incomes(Reference Kutner, Greenburg and Jin3, Reference Schillinger, Barton and Karter4). Health literacy skills required to ‘make appropriate health decisions’(Reference Neilson-Bowman1) are situation specific(Reference Paasche-Orlow and Wolf5), and this concept has driven nutrition researchers to translate the concept of health literacy into a nutrition context(Reference Carbone and Zoellner6–Reference Velardo8). Nutrition literacy is defined as ‘the degree to which individuals have the capacity to obtain, process, and understand nutrition information and skills needed in order to make appropriate nutrition decisions’(Reference Silk, Sherry and Winn9).
Health literacy appears to be associated with nutrition behaviours. Those with limited health literacy less often consult food labels(Reference Cha, Kim and Lerner10, Reference Miller and Cassady11) and have greater difficulty in interpreting food labels(Reference Rothman, Housam and Weiss12) as well as estimating appropriate food portions(Reference Huizinga, Carlisle and Cavanaugh13). Chari et al. reported that parents with limited health literacy more often report obesogenic feeding behaviours(Reference Chari, Warsh and Ketterer14). However, reported relationships between health literacy and dietary intake have been mixed. No relationship was found between health literacy and low-salt diet adherence in hypertensive patients(Reference Hutchison, Warren-Findlow and Dulin15) or with macronutrient-restricted diets in diabetes patients(Reference Bowen, Cavanaugh and Wolff16). Conversely, lower diet quality and higher sugar-sweetened beverage intake have been reported among adults with low health literacy(Reference Zoellner, You and Connell17).
Validated nutrition literacy tools are only recently available, so few data are available to consider the impact of poor nutrition literacy. However, our previous work has demonstrated nutrition literacy is positively related to diet quality(Reference Gibbs, Ellerbeck and Befort18–Reference Gibbs, Ellerbeck and Gajewski20), as measured by the Healthy Eating Index (HEI). The HEI is one method for quantifying diet quality, assigning up to a maximum score of 100 for diet alignment with the Dietary Guidelines for Americans(Reference Guenther, Kirkpatrick and Reedy21), but other indices are also available. Considering that nutrients are consumed within the context of foods and beverages and not as individual nutrients, use of these indices allows researchers to study the overall quality of diets as they relate to a disease or outcome risk. Applied in this way, diet quality indices identify dietary patterns of interest a priori, or using a hypothesis-driven approach.
Alternatively, statistical techniques can be employed to derive individual factors, interpreted as diet patterns, that can be associated with positive or negative dietary behaviours. Two commonly used approaches are reduced rank regression and principal components analysis (PCA). Reduced rank regression is an exploratory approach to identify dietary patterns that explain the largest variation in a dependent variable of interest(Reference Weikert and Schulze22, Reference Livingstone and McNaughton23). As such, reduced rank regression is an approach that is both a priori (i.e. includes the outcome of interest) and a posteriori (i.e. derives dietary patterns)(Reference Weikert and Schulze22). Moreover, PCA, a simply a posteriori approach, produces an investigator-defined number of dietary patterns that account for maximal variation within dietary data alone(Reference Newby and Tucker24). Principal covariates regression (PCovR) incorporates principles of both PCA and reduced rank regression to produce dietary patterns that maximize the explanation of variance in dietary intake and the dependent variable of interest(Reference Dejong and Kiers25). Thus, the purpose of the present study was to identify dietary patterns from the reported dietary intake of adults with varying levels of nutrition literacy via PCovR and PCA approaches and investigate the ability for nutrition literacy to predict adherence to those patterns.
Methods
Study design
We examined cross-sectional data collected at baseline from individuals involved in a study for the validation of the Nutrition Literacy Assessment Instrument (NLit)(Reference Gibbs, Ellerbeck and Gajewski20).
Participants
Baseline data were available on 402 participants recruited through an existing patient registry and primary care clinics as previously described(Reference Gibbs, Ellerbeck and Gajewski20). Eligible participants were ≥18 years of age, spoke and read English, and had self-report of at least one of four chronic diet-related diseases (diabetes, hyperlipidaemia, hypertension or overweight/obesity). Exclusion criteria for the present study included overt psychiatric illness, impaired vision that affected ability to read the nutrition literacy tool, cognitive impairment and weight of ≥227 kg (≥500 lb). The study protocol was approved by the Institutional Review Board at the University of Kansas Medical Center. Informed consent was obtained from all study participants according to institutional guidelines.
Nutrition literacy assessment
Nutrition literacy was measured at baseline using the NLit. Population-specific versions of the NLit were previously used in breast cancer survivors(Reference Gibbs, Ellerbeck and Befort18, Reference Parekh, Jiang and Buchan26), parents of young children(Reference Gibbs, Kennett and Kerling19), adults with chronic disease(Reference Gibbs, Ellerbeck and Gajewski20) and Spanish-speaking adults(Reference Gibbs, Kennett and Kerling19). The NLit is a sixty-four-item survey that includes six nutrition literacy domains: (i) Nutrition and Health; (ii) Energy Sources in Food; (iii) Household Food Measurement; (iv) Food Label and Numeracy; (v) Food Groups; and (vi) Consumer Skills. In previous analyses, the NLit demonstrated substantial factor validity and reliability (0·97, CI = 0·96, 0·98), test–retest reliability (0·88, CI = 0·85, 0·90) and convergent validity as a predictor of diet quality (β = 0·17, R 2 = 0·10, P < 0·0001)(Reference Gibbs, Ellerbeck and Gajewski20). Global nutrition literacy (gNLit) scores and nutrition literacy domain sub-scores were calculated by summing the quantity of correctly answered survey items. Global nutrition literacy scores were categorized into three nutrition literacy performance groups with previously defined cut-off points(Reference Gibbs, Ellerbeck and Gajewski20): poor (gNLit ≤ 44), possibly poor (gNLit =45–57) and good (gNLit ≥ 58).
Dietary intake assessment
At a return visit approximately one month after the baseline visit, participants reported usual dietary intake by completing the National Cancer Institute’s Diet History Questionnaire (DHQ) II(27). The DHQ has been validated and estimates dietary intake over the past year through 134 food and eight supplement intake questions(Reference Millen, Midthune and Thompson28). The National Cancer Institute’s Diet*Calc software(29) utilized DHQ II input to quantify nutrient intake and food group variables.
Empirical dietary patterns
Dietary patterns were identified through two distinct methods: PCovR and PCA. For both of these diet pattern development approaches, we included DHQ II output of twenty Food Pattern Equivalents Database 2013–14 (FPED)(Reference Bowman, Clemens and Friday30) variables and fifteen expansive/additional variables. FPED collapses dietary intake into thirty-seven food group variables. Because collapsing food intake into fewer variables inherently eliminates some nuance of food characterization, we identified fifteen additional foods to include in the analysis that were either expanded from FPED variables or foods neglected by FPED. Table 1 summarizes the thirty-five total variables included in these analyses.
Table 1 List of the thirty-five food variables included in derivation of dietary patterns by principal covariates regression and principal components analysis

FPED, Food Pyramid Equivalents Database.
† Designates FPED variable.
Because food group loadings in the resultant dietary patterns could be susceptible to extreme intake outliers, data were assessed for non-viable under- and over-report of dietary intake prior to derivation of dietary patterns. We calculated modified Z-scores(Reference Iglewicz and Hoaglin31) for energy intake and removed individuals with scores greater than an absolute value of 3·5. Sixteen individuals were identified as under- (n 12) or over-reporters (n 4) and were removed from the dietary pattern analysis. We were hesitant to exclude under- and over-reporters due to concerns that doing so would exclude more with poor nutrition literacy(Reference Bowen, Cavanaugh and Wolff16). Upon further analysis, however, we determined that nutrition literacy scores were evenly distributed among those excluded.
Principal covariates regression
We performed PCovR using the [PCovR](Reference Vervloet, Kiers and Van den Noortgate32) package for R (R Foundation, Vienna, Austria). Thirty-five food variables were centred and scaled to a mean of 0 and an sd of 1. The centred FPED variables were included as independent variables and the total score from the NLit was included as the dependent variable in the analysis. [PCovR], by default, utilizes the varimax rotation for maximal data interpretation and automatically retains relevant components based upon eigenvalues. We calculated individual PCovR diet pattern adherence scores by multiplying each individual’s standardized food group intake by that food variable’s factor loading score and summing the products for all thirty-five food variables(Reference Dejong and Kiers25).
Principal components analysis
PCA was performed using the [psych] package for R. Intake data for thirty-five food variables centred and standardized to a mean of 0 and an sd of 1 were included in the PCA and rotated with the varimax rotation method. Visualization of the component eigenvalues indicated retention of the first three components from the PCA for further analysis. For each rotated component, individual component adherence scores were calculated by multiplying individual standardized food group intake by that food variable’s factor loading score and summing the products for all thirty-five food variables(Reference Randall, Marshall and Graham33).
Statistical analyses
The primary aim of the present research was to investigate the relationships between nutrition literacy and empirically derived diet patterns. Continuous variables were expressed as mean and sd. All models were assessed for normality through visualization of residual Q–Q plots. Dependent data with non-normally distributed residuals were transformed using a Box–Cox transformation. Parametric analyses were performed on transformed dependent data with slightly non-normal distribution in lieu of non-parametric analyses due to ‘robustness to non-normality’ of the data based on the large sample size of the study. Linear regression models were used to investigate the continuous relationship between nutrition literacy scores and diet pattern adherence. Multiple linear regression models included seven predetermined covariates of interest: age, sex, household income, education level, BMI, race and diabetes status. Mean differences in dietary pattern adherence among nutrition literacy performance groups were tested by ANOVA. Post hoc pairwise comparisons of the ANOVA were adjusted using the Bonferroni–Holm adjustment. Statistical analyses were performed using R version 3.4.3. Statistical tests were two-tailed with significance set at P < 0·05. R statistical analysis script is included in the online supplementary material, Supplemental File 1.
Results
Participant characteristics
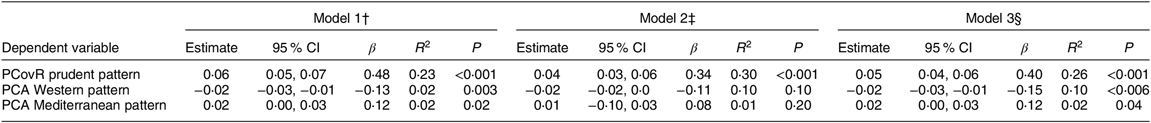
Data from 386 participants ranging in age from 18 to 82 years (mean age = 54·5 (sd 14·8) years) and reporting one or more chronic diseases were analysed. Demographic, anthropometric and dietary intake characteristics for these participants are included in Table 2. The poor nutrition literacy group was significantly older (P < 0·001), less educated (P < 0·001), reported less household income (P < 0·001) and had greater report of diabetes (P = 0·06) relative to the possibly poor and good nutrition literacy groups. In contrast, the poor nutrition literacy group also had a lower BMI (P = 0·05); however, all groups were obese.
Table 2 Characteristics of adult participants (n 386) with at least one of four diet-related diseases, metropolitan Kansas City, USA, January 2015–July 2016
GED, General Educational Development; PCovR, principal covariates regression; PCA, principal components analysis.
Continuous variables assessed by ANOVA. Categorical variables assessed by the χ 2 test. Significance set at P < 0·05.
† Measured by the Nutrition Literacy Assessment Instrument.
‡ Measured by the Diet History Questionnaire II.
§ Values of adherence are linear combination of diet pattern food loadings and standardized intake. Adherence scores are relative to the specific diet pattern and have no unit of measurement.
Dietary pattern identification by principal covariates regression and principal components analysis
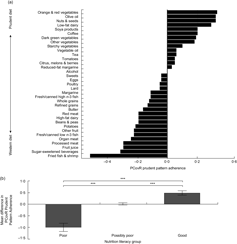
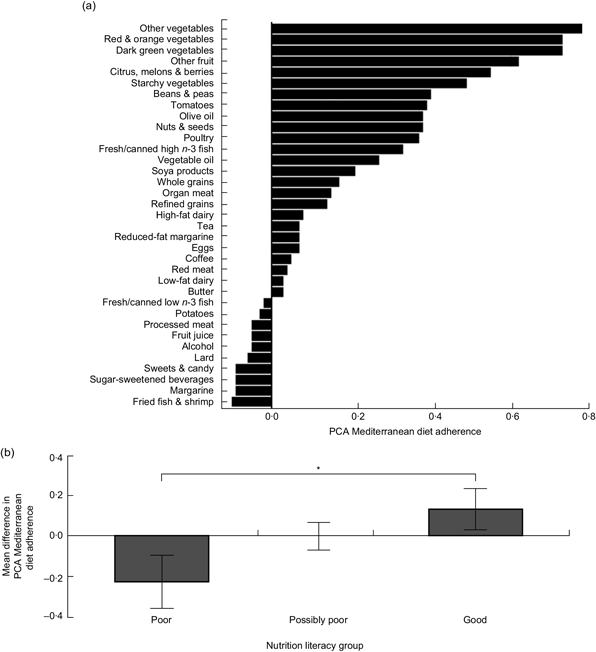
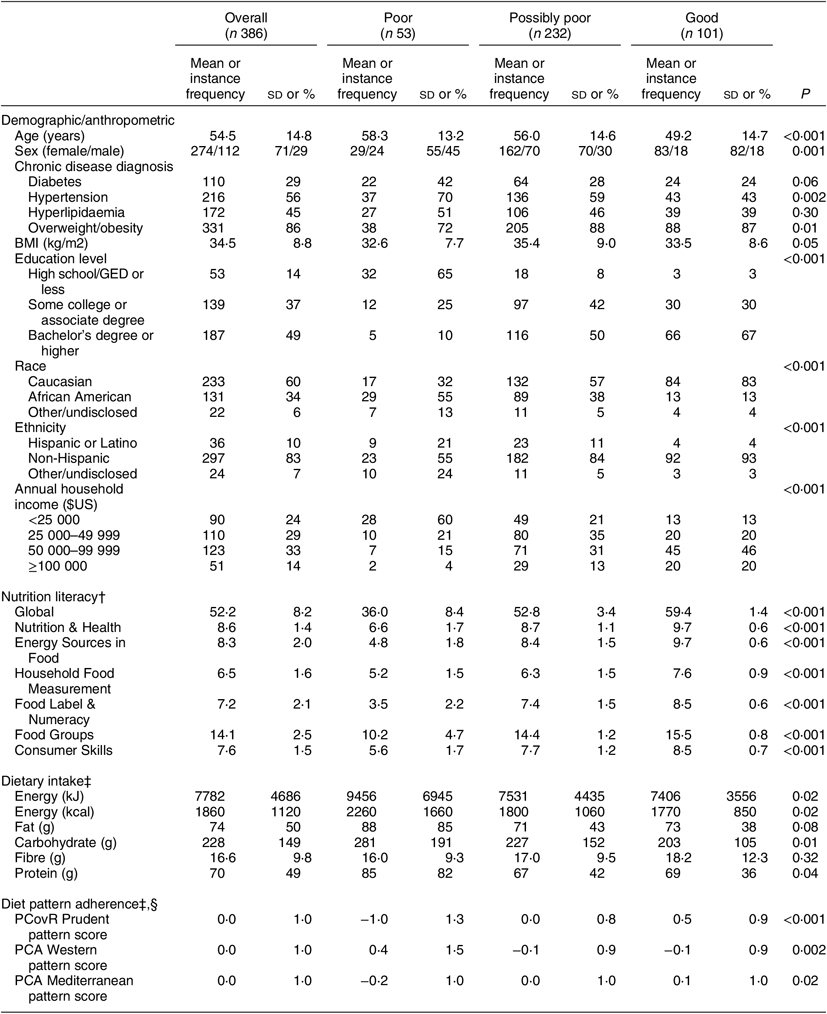
One component was automatically retained for further analysis from the PCovR describing 5 % of variance in the dietary intake data (independent variables) and 23 % of variance in gNLit scores (dependent variable). We named this component the ‘PCovR prudent pattern’ because it exhibited high positive loadings on food variables consistent with a prudent diet with inversely high negative loadings on food variables consistent with a Western diet (Fig. 1(a)). From the PCA, three diet components had eigenvalues >1 and also explained a large amount of dietary variance. The first rotated component (Fig. 2(a)) from the PCA explained 13 % of the total dietary intake variance and exhibited high loadings on food variables that contribute to a Western diet, thus we retained and named it the ‘PCA Western pattern’. We also retained the second rotated component (Fig. 3(a)) which explained 11 % of the total dietary intake variance, loaded highly on food components consistent with a Mediterranean diet, thus we named it the ‘PCA Mediterranean pattern’. We opted not to retain the third rotated component which presented no discernibly meaningful dietary pattern.

Fig. 1 Principal covariates regression (PCovR)-derived prudent pattern factor loadings and adherence by nutrition literacy performance classification (assessed using the Nutrition Literacy Assessment Instrument (NLit)) among adults with at least one of four diet-related diseases, metropolitan Kansas City, USA, January 2015–July 2016. The PCovR prudent pattern explains 5 % of dietary intake variation and 23 % of variation in global NLit scores. (a) Factor loadings are represented as the bars (n 386), January 2015–July 2016. Intake of foods that have high positive loadings resulted in higher prudent pattern adherence. Conversely, intake of foods with high negative loadings resulted in higher Western pattern adherence. (b) Mean differences in adherence to the PCovR prudent pattern among nutrition literacy performance classification groups. Mean differences are represented as bars and their standard deviations are represented by error bars. Positive scores indicate higher intake of foods associated with the prudent diet, while negative scores indicate higher intake of foods associated with the Western diet. *P < 0·05, **P < 0·01, ***P < 0·001

Fig. 2 Principal components analysis (PCA)-derived Western pattern factor loadings and adherence by nutrition literacy performance classification (assessed using the Nutrition Literacy Assessment Instrument) among adults with at least one of four diet-related diseases, metropolitan Kansas City, USA, January 2015–July 2016. The PCA Western pattern explains 13 % of dietary intake variation. (a) Factor loadings are represented as the bars (n 386). Intake of foods that have high positive loadings resulted in higher diet pattern adherence scores. Intake of foods with low or negative loading coefficients resulted in low/negative diet pattern adherence scores. (b) Mean differences in adherence to the PCA Western pattern among nutrition literacy performance classification groups. Mean differences are represented as bars and their standard errors are represented by error bars. Positive scores indicate higher intake of foods associated with the Western diet, while low/negative scores indicate lower intake of foods from the Western diet. *P < 0·05, **P < 0·01, ***P < 0·001

Fig. 3 Principal components analysis (PCA)-derived Mediterranean pattern factor loadings and adherence by nutrition literacy performance classification (assessed using the Nutrition Literacy Assessment Instrument) among adults with at least one of four diet-related diseases, metropolitan Kansas City, USA. The PCA Mediterranean pattern explains 11 % of dietary intake variation. (a) Factor loadings are represented as the bars (n 386), January 2015–July 2016. Intake of foods that have high positive loadings resulted in higher diet pattern adherence scores. Intake of foods with low or negative loading coefficients resulted in low/negative diet pattern adherence scores. (b) Mean differences in adherence to the PCA Mediterranean pattern among nutrition literacy performance classification groups. Mean differences are represented as bars and their standard errors are represented by error bars. Positive scores indicate higher intake of foods associated with the Mediterranean diet, while low/negative scores indicate lower intake of foods from the Mediterranean diet. *P < 0·05, **P < 0·01, ***P < 0·001
Prediction of diet pattern adherence by nutrition literacy score
We first investigated the level at which gNLit scores were predictive of adherence to the PCovR prudent pattern through linear regression with multiple adjustments. Because nutrition literacy scores were involved in derivation of the PCovR prudent pattern, there was a high likelihood that gNLit scores would be related to this pattern’s adherence. Diet adherence was positively related to gNLit score (P < 0·001, β = 0·48), indicating that improved nutrition literacy predicted higher intake of foods related to the prudent diet and lower intake of Western diet-related foods. Table 3 demonstrates this relationship along with multiple model adjustments for all seven variables of interest and a model that excludes education level since it was found to be moderately collinear with gNLit scores (R 2 = 0·55). The strong ability for nutrition literacy to predict PCovR prudent pattern adherence remained in all models assessed (Table 3).
Table 3 Multiple linear regression relationships between nutrition literacy scores and dietary pattern adherence among adults (n 386) with at least one of four diet-related diseases, metropolitan Kansas City, USA, January 2015–July 2016
PCovR, principal covariates regression; PCA, principal components analysis; gNLit, global nutrition literacy.
Continuous covariates: age, BMI, household income and education level.
Categorical covariates: sex, race and diabetes status.
† Model 1: Simple linear regression of diet pattern adherence predicted by gNLit scores.
‡ Model 2: Multiple linear regression of diet pattern adherence predicted by gNLit scores and all covariates of interest (age, sex, BMI, race, household income, education level and diabetes status).
§ Model 3: Multiple linear regression of diet pattern adherence predicted by gNLit scores and all covariates of interest, excluding education level.
We next investigated nutrition literacy’s predictability of diet adherence to the diet patterns derived by PCA. Similar to the results in PCovR, worse gNLit score predicted higher intake of foods associated with the Western pattern (P = 0·003, β = −0·15) while better nutrition literacy predicted higher intake of foods associated with a Mediterranean pattern (P = 0·02, β = 0·12). Both Western and Mediterranean pattern adherence lost significance with gNLit score when controlled for all seven covariates of interest (Western: P = 0·10, β = −0·11; Mediterranean: P = 0·2, β = 0·08) but regained significance in the model excluding education level (Western: P = 0·006, β = −0·15; Mediterranean: P = 0·04, β = 0·12).
We investigated differences in dietary pattern adherence by nutrition literacy performance classification. Mean PCovR prudent pattern adherence improved stepwise among each of the three categories (P < 0·001 for all), with the highest Western pattern adherence in the poor nutrition literacy group and the highest prudent diet adherence in the good nutrition literacy group (Fig. 1(b)). The poor nutrition literacy group also had significantly higher adherence to the PCA Western pattern than the possibly poor and good nutrition literacy groups (Fig. 2(b), P = 0·002). There were no differences in PCA Western pattern adherence between the possibly poor and good nutrition literacy groups. Adherence to the PCA Mediterranean pattern was significantly higher in the good nutrition literacy group relative to those with poor nutrition literacy (Fig. 3(b), P = 0·02). To extend this analysis, Fig. 4 illustrates the difference in specific food group intake between poor and good nutrition literacy for foods that contributed to the specific derived diet patterns. The good nutrition literacy group consumed significantly more olive oil, low-fat dairy, nuts and seeds, orange and red vegetables, and soya products; food contributors to the prudent and Mediterranean patterns. The poor nutrition literacy group consumed significantly more fried fish and shrimp, processed meat, red meat, sugar-sweetened beverages, fruit juice and margarine; food contributors to the Western pattern.
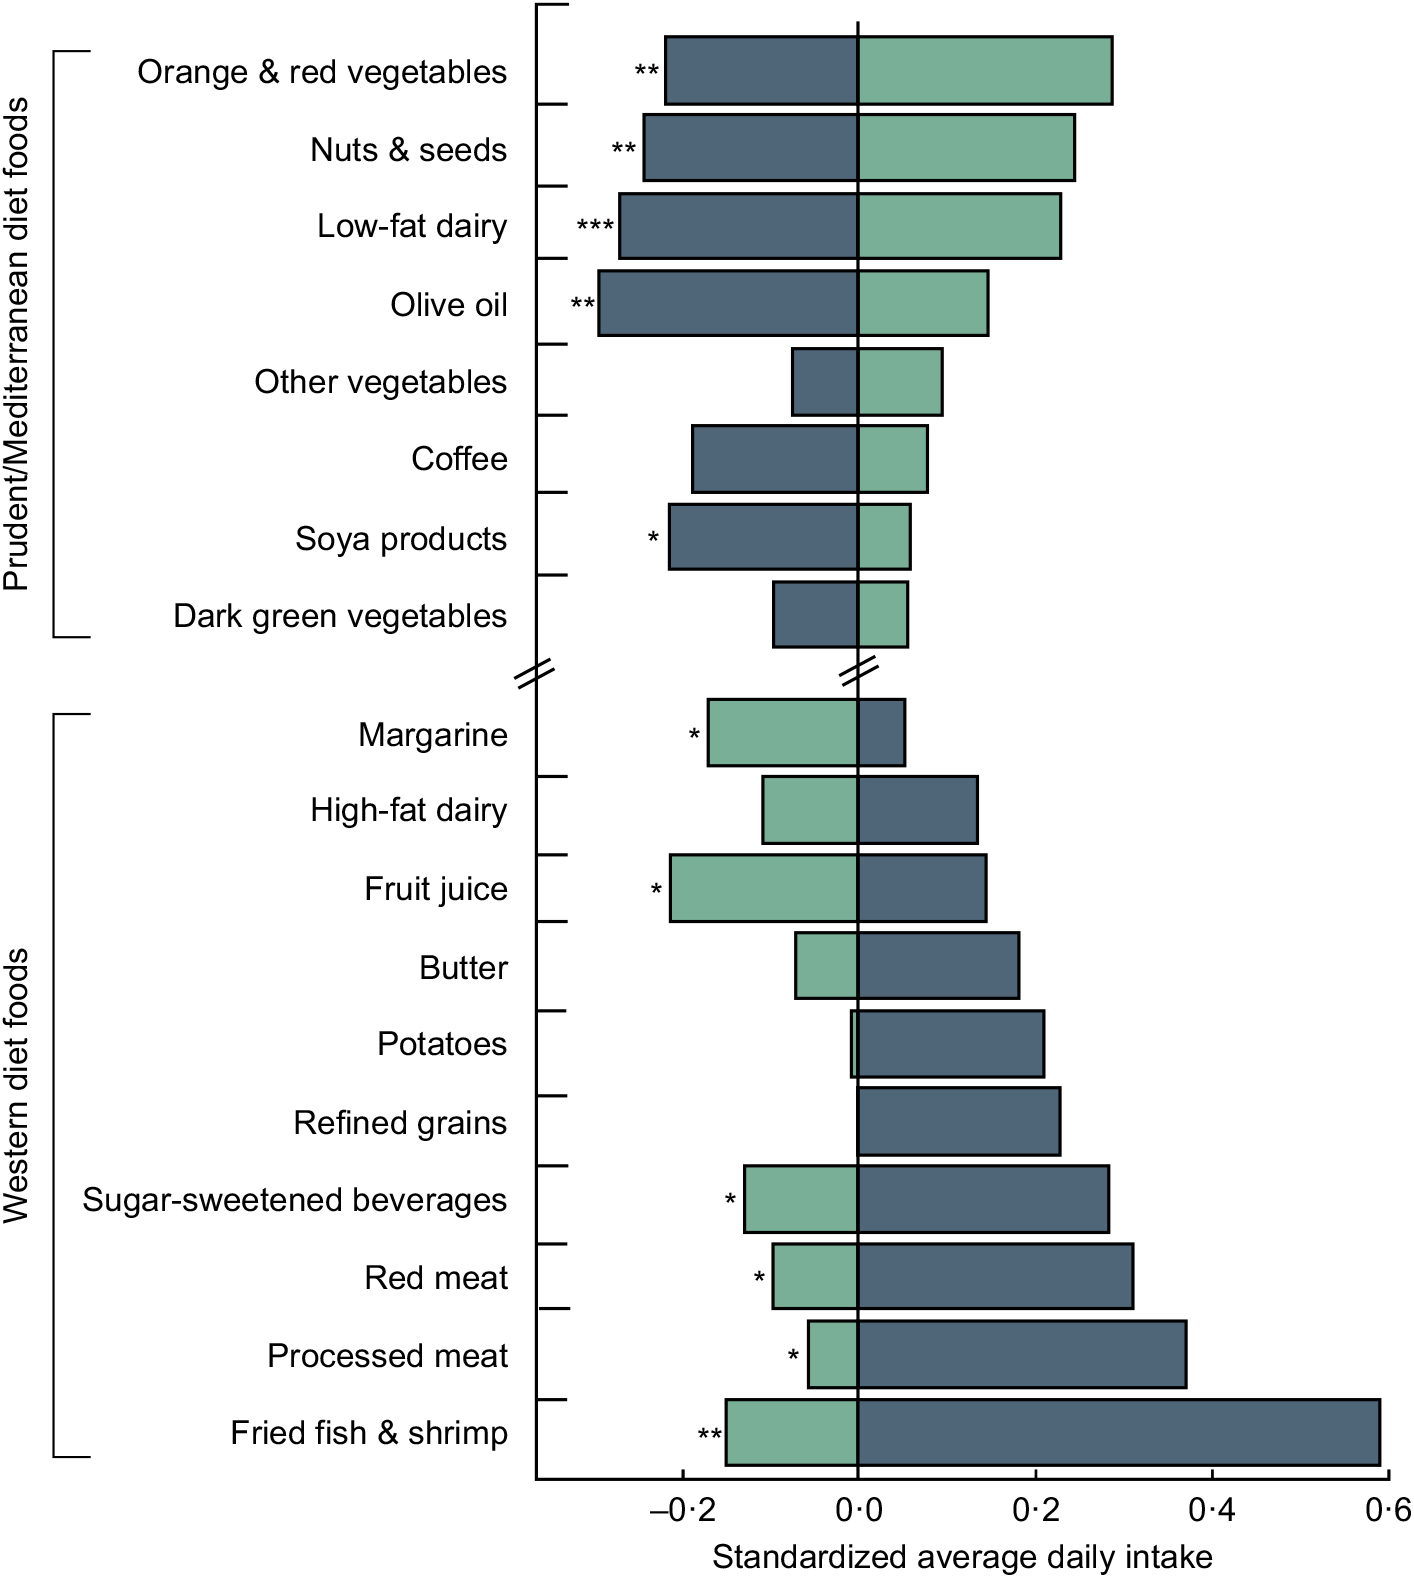
Fig. 4 The difference in standardized food intake between the poor (![]() ) and good (
) and good (![]() ) nutrition literacy groups of adults with at least one of four diet-related diseases, metropolitan Kansas City, USA, January 2015–July 2016. Values are group mean intake Z-scores. The plot contains eighteen of the thirty-five food groups utilized in the derivation of the dietary patterns. These eighteen food groups were selected for presentation due to their unique contribution to either the Western pattern or the prudent/Mediterranean pattern and large difference in intake between the poor and good nutrition literacy groups. Intake of these particular food groups explains the observed relative difference in dietary pattern adherence among nutrition literacy groups. *P < 0·05, **P < 0·01, ***P < 0·001
) nutrition literacy groups of adults with at least one of four diet-related diseases, metropolitan Kansas City, USA, January 2015–July 2016. Values are group mean intake Z-scores. The plot contains eighteen of the thirty-five food groups utilized in the derivation of the dietary patterns. These eighteen food groups were selected for presentation due to their unique contribution to either the Western pattern or the prudent/Mediterranean pattern and large difference in intake between the poor and good nutrition literacy groups. Intake of these particular food groups explains the observed relative difference in dietary pattern adherence among nutrition literacy groups. *P < 0·05, **P < 0·01, ***P < 0·001
We also examined whether nutrition literacy domain sub-scores related to dietary pattern adherence via linear regression. All six of the nutrition literacy sub-scores were positively related to intake of the PCovR prudent pattern (P < 0·001 for all). Increased scores in subdomains of Nutrition and Health (P = 0·05, β = −0·10), Energy Sources in Food (P = 0·03, β = −0·18), Household Food Measurement (P = 0·04, β = −0·11) and Food Label and Numeracy (P = 0·03, β = −0·11) were inversely related to PCA Western pattern adherence. PCA Mediterranean pattern adherence improved with increased scores for Energy Sources in Food (P = 0·03, β = 0·11), Household Food Measurement (P = 0·004, β = 0·15) and Consumer Skills (P = 0·02, β = 0·12) subdomains.
Discussion
The current study provides further evidence that nutrition literacy is a viable predictor of diet quality as evidenced by the diet patterns that emerged in the analysis. Using two different empirical diet pattern methods, poor nutrition literacy predicted high Western diet adherence while good nutrition literacy predicted higher adherence to a prudent and Mediterranean diet. These data reaffirm two crucial nutrition literacy-related points: (i) that nutrition literacy is an important element for the capability of making healthy dietary choices; and (ii) the applicability of our previously defined nutrition literacy performance cut-off points(Reference Gibbs, Ellerbeck and Gajewski20).
The findings of the present study build upon the previous publication tying nutrition literacy to HEI scores(Reference Gibbs, Ellerbeck and Gajewski20) by using empirical methods to identify dietary patterns characterized by intake of specific foods. By design, PCovR includes a priori outcome variables within the regression to identify factors (dietary patterns) and weights the components based on maximal variance within the diet data that render the largest influence on outcomes of interest(Reference Dejong and Kiers25, Reference Vervloet, Kiers and Van den Noortgate32). Yet, with this analysis, there was no guarantee that the diet pattern would present in a discernible manner. We assert the finding through PCovR that poor nutrition literacy best predicted high intake of fried foods, sugar-sweetened beverages, processed meat, potatoes, red meat, high-fat dairy, butter and refined grains, and that good nutrition literacy predicted high intake of vegetables, nuts and seeds, olive oil, low-fat dairy and soya products, is the strongest finding of the present study. This suggests an important role for nutrition literacy as knowledge and skill that are drawn upon when an individual makes food choices.
Since PCovR utilized NLit scores to derive the dietary pattern of interest, we acknowledge that there was a high likelihood of a relationship between nutrition literacy and adherence to this diet pattern; however, what is most significant was that nutrition literacy clearly defined a pattern with healthy/unhealthy polar ends by this method. Figure 1(b) and the regression analyses in Table 3 extend the relationship interpretation by demonstrating multiple model adjustment, directionality of the relationship and relative variation in adherence among three levels of nutrition literacy performance. Frequently PCA-derived dietary patterns fail to explain variation in outcomes(Reference Hoffmann, Schulze and Schienkiewitz34–Reference Nettleton, Steffen and Schulze36). Therefore, our findings through PCA that, among all covariates, poor nutrition literacy was the strongest predictor of a Western pattern and good nutrition literacy the strongest predictor of a Mediterranean pattern reiterate and validate the findings of the PCovR analysis.
Age, income and education were all associated with Western pattern adherence, consistent with previous findings demonstrating inverse relationships between socio-economic status and diet quality(Reference Darmon and Drewnowski37) and that higher diet quality is associated with higher food costs(Reference Rehm, Monsivais and Drewnowski38). While we found disparity between nutrition literacy groups in age, education and income, of these, nutrition literacy was the most significant predictor of diet pattern adherence. Thus, although it is difficult to disentangle their relationships, nutrition literacy may be a greater factor influencing food choice than demographic factors.
Implications and future directions
Findings of the present study suggest that nutrition literacy should be investigated as a mediator of demographic factors in the path to a healthy diet. This idea is consistent with the finding that nutrition knowledge was a mediator of socio-economic status in the diet quality of Australian mothers(Reference McLeod, Campbell and Hesketh39) and that health literacy is a mediator of disease disparity rather than race(Reference Berkman, Sheridan and Donahue2, Reference Osborn, Cavanaugh and Wallston40, Reference Sarkar, Fisher and Schillinger41) or education(Reference Schillinger, Barton and Karter4).
Taking a ‘social determinants of health’ perspective, it is intuitive that these social and environmental factors may powerfully influence acquisition of nutrition literacy, cooking skills, and availability of guidance on food and nutrition decisions as they relate to health(Reference Marmot42, 43). It has been argued that differences in diet between social classes reflect a difference in access to a healthy food supply and that healthy food access influences food choices more than health education(43). In the USA, food insecurity is more common in ‘food deserts’ and is associated with shopping at convenience stores, where healthy foods are less available and more expensive(Reference Ma, Liese and Hibbert44). Consequently, a growing body of literature has examined the role of healthy food access for improving food purchasing and diet behaviours in neighbourhoods and geographic regions with poor access. However, recent studies investigating changes in purchasing and diet behaviours after the introduction of ‘healthy’ store types (e.g. full-service supermarkets) have not shown that increasing access to healthy food alone improves the healthfulness of food items purchased or consumed(Reference Vaughan, Collins and Ghosh-Dastidar45– Reference Jilcott Pitts, Wu and McGuirt47).
Consistent with our findings that good nutrition literacy predicted a healthy diet pattern, recent results from the US Department of Agriculture’s National Household Food Acquisition and Purchase Survey indicate that consumers with greater attention to nutrition information purchase higher-quality foods and consume a higher-quality diet, even when controlling for socio-economic differences(Reference Zeballos and Anekwe48). Some have included nutrition education alone or within a multiple-method approach to change purchasing behaviour and found increases in purchases of fruits and vegetables(Reference Milliron, Woolf and Appelhans49–Reference Surkan, Tabrizi and Lee51). While some have identified price discounting as an intervention strategy with greater effect upon purchasing behaviour than nutrition education(Reference Waterlander, de Boer and Schuit50, Reference Ball, McNaughton and Le52, Reference Ni Mhurchu, Blakely and Jiang53), none of these studies reported measured baseline nutrition literacy (i.e. referred to as ‘nutrition knowledge’ in cited studies) nor the effects of the nutrition education interventions upon nutrition literacy. Unfortunately, in the absence of measured change in nutrition literacy, strong conclusions cannot be made regarding the effectiveness of nutrition education. Indeed, while mixed-approach supermarket-based intervention strategies have shown some success, using validated tools to evaluate improvements in nutrition literacy and behaviour in the analysis of outcomes is critical for identifying intervention methods that contribute to desired outcomes(Reference Nikolaus, Muzaffar and Nickols-Richardson54). Regardless, our data demonstrate that including nutrition literacy among factors targeted for improving diet patterns and diet quality is warranted in future interventions.
Unfortunately, improvements in the social determinants of health that associate with poor diet, such as education and income, require system and policy changes to improve nutrition and narrow the disparity in healthy diets for the most vulnerable populations. These are long-term solutions with slow, often stagnant progress. While system and policy changes related to nutrition literacy may be effective (e.g. changing design of nutrition labelling), nutrition literacy may also be an actionable construct that nutrition professionals can target at the individual level to improve diets. For example, if a patient requires a sodium restriction but demonstrates difficulty interpreting food labels, the health professional could encourage fresh produce (which is low in sodium and does not require food label interpretation) and/or simplify food label reading by focusing instruction on how to interpret sodium information specifically, using teach-back to check for understanding(Reference Schillinger, Piette and Grumbach55 ).
Limitations
Cross-sectional studies are designed to establish observational relationships between predictors and outcomes, yet their results should not be interpreted as causal. Dietary data collected in the current study reflect self-reported intake using an FFQ, which has known limitations reflecting actual intake. However, because we were interested in patterns of food intake, the FFQ method is the most cost-effective option for evaluating diet over time. Additionally, limited inferences can be made regarding relationships between BMI and other factors studied. Overweight and obesity are co-morbid conditions with the chronic diseases used as inclusion criteria for participation in the study and likely explains the sample’s obese mean BMI but limits generalizability. Our study is also limited by inclusion restricted to only English-speaking/reading participants.
Conclusion
Poor nutrition literacy may decrease capacity for making healthy diet choices and instead lead to choosing a poor-quality Western diet. Conversely, good nutrition literacy may enable individuals to make healthy diet choices, resulting in a high-quality prudent or Mediterranean diet. While more research is needed to uncover the role nutrition literacy plays in the pathway of behaviours leading to a healthy diet, nutrition literacy may be a construct that nutrition professionals can target to improve diet behaviour.
Acknowledgements
Financial support: This research was supported in part by the Eunice Kennedy Shriver National Institute of Child Health and Human Development (Principal Investigator H.D.G., award number R03HD081730); the National Institute of Nursing Research (Principal Investigator B.J.G., award number R03NR013236); and by a Clinical and Translational Science Awards Program grant from the National Center for Advancing Translational Sciences awarded to the University of Kansas Medical Center for Frontiers: The Heartland Institute for Clinical and Translational Research (grant number UL1TR000001). The content is solely the responsibility of the authors and does not necessarily represent the official views of the National Institutes of Health. The funders had no role in the design, analysis or writing of this article. Conflict of interest: The authors report no conflict of interest. Authorship: The authors’ responsibilities were as follows: M.K.T., involved in study design, responsible for data analysis, and primary contributor of manuscript content; D.K.S., involved in study design, oversaw data collection, and contributed content and edits to the manuscript; E.F.E., involved in study design, oversaw data collection, and contributed content and edits to the manuscript; B.J.G., involved in study design, supervised data analysis, and contributed content and edits to the manuscript; H.D.G., involved in study design, oversaw data collection, and primary contributor of manuscript content. All authors had full access to the data and read and approved the final manuscript. Ethics of human subject participation: This study was conducted according to the guidelines laid down in the Declaration of Helsinki and all procedures involving human subjects were approved by the Institutional Review Board at the University of Kansas Medical Center. Written informed consent was obtained from all subjects.
Supplementary material
To view supplementary material for this article, please visit https://doi.org/10.1017/S1368980019001289
Author ORCIDs
Matthew K Taylor, 0000-0002-4368-2705. Debra K Sullivan, 0000-0003-1694-5829. Edward F Ellerbeck, 0000-0002-7774-2729. Byron J Gajewski, 0000-0001-7589-8247. Heather D Gibbs, 0000-0001-7383-5496.