


Nutrition transition (NT) is a major determinant of public health changes worldwide(Reference Nazmi and Monteiro1). The NT concept focuses on trends in a population’s diet and physical activity patterns that result in body composition changes (from undernutrition to overweight as the main nutritional concern in the population), which are paralleled by major changes in demographic, socio-economic and health factors(Reference Popkin2, Reference Popkin3). In fact, there has been a widespread global increase in the burden of obesity over the last decades(Reference Ng, Fleming and Robinson4) and far more overweight and non-communicable diseases (NCD) related to diet than in the past(Reference Popkin5).
Popkin(Reference Popkin6) suggests five broad patterns of the NT: ‘collecting food’, ‘famine’, ‘receding famine’, ‘degenerative diseases’ and ‘behavioural change’. These describe the shift through which populations go from undernutrition to overweight and obesity as a main nutritional concern. Those nutritional changes are closely linked to demographic and epidemiological transitions(Reference Popkin6, Reference Subedi, Marais and Newlands7). Although NT can be thought of as a historical process, earlier patterns are not restricted to the periods in which they first arose. Instead, they continue to characterize certain geographic and socio-economic sub-populations(Reference Popkin3). Furthermore, NT trends and patterns are not uniform across different regions in the world(Reference Subedi, Marais and Newlands7). In this regard, it has been pointed out that these processes have a higher impact on the most socio-economically disadvantaged population, with differences among and within countries(Reference Nazmi and Monteiro1, Reference Popkin3, Reference Popkin, Lu and Zhai8).
Latin America has experienced major socio-economic and demographic shifts over the last decades with simultaneous changes in lifestyle, nutritional and epidemiological profiles(Reference Albala, Vio and Kain9, Reference Aballay, Eynard and Díaz10). As the population becomes more sedentary and increases its dietary energy density, obesity and related NCD emerge as a major public health issue(Reference Chaparro and Estrada11, Reference Monteiro, Moura and Conde12). Environmental factors have been suggested as a main determinant of health in Latin America(Reference Aballay, Eynard and Díaz10). In view of this and shifting from biomedical and lifestyles-based perspectives to the social determinants of health approach, it is reasonable to assume that distal factors (at the societal level) influence the individual-level factors (e.g. behavioural)(Reference Pou, Tumas and Soria13) and that they operate jointly in plausible ways to determine the obesity epidemic in developing regions.
On the other hand, the prevalence of undernutrition remains a public health concern(Reference Rivera, Pedraza and Martorell14). Although the double burden of malnutrition is a global health matter, most cases are arising in countries of low and middle incomes(Reference Walls, Johnston and Mazalale15), where economic development, poverty, urbanization and changes in population lifestyles are the most commonly suggested factors to explain it(Reference Kolcic16, Reference Min, Zhao and Slivka17).
Although it has been pointed out that some Latin American countries are going through the stage called ‘receding famine’ (high prevalence of stunting, underweight and micronutrient deficiencies as the main characteristics), while others are going through the ‘degenerative diseases’ stage (characterized mainly by a high burden of overweight and NCD related to the diet)(Reference Popkin6, Reference Rivera, Barquera and González‐Cossío18), no detailed study of the NT profile has been done in Argentina. As reported in previous studies, however, high obesity prevalence is a common concern: over 20 % of adults were obese in seventeen out of twenty Latin American countries(Reference Aballay, Eynard and Díaz10, Reference Filozof, Gonzalez and Sereday19).
Even though the scientific literature suggests that the region is undergoing different stages of the NT(Reference Albala, Vio and Kain9, Reference Chaparro and Estrada11, Reference Rivera, Barquera and González‐Cossío18, Reference Barria and Amigo20–Reference Albala, Vio and Kain24), this phenomenon has been scarcely explored in Argentina. To our knowledge, the limited evidence at the national level comes from official reports analysing some nutritional and health data and a few studies based on national surveys that include nutritional status(Reference Linetzky, De Maio and Ferrante25–Reference Fleischer, Diez Roux and Alazraqui27), but an integrative study from the NT perspective is yet to be published in Argentina. Understanding the differences in the overall NT process within the country would make it possible to identify the epidemiological scenarios needing priority action and thus to set up relevant public health policies.
Argentina has undergone a number of rapid demographic and socio-economic changes over the past decades(Reference Christine, Diez Roux and Wing28, 29). According to the last population census (2010), 91 % of the people live in urban areas and 12·5 % in poor living conditions. Concurrently, sedentary lifestyles and overweight have become more prevalent in Argentina with subsequent impact on the burden of NCD(Reference Ferrante, Linetzky and Konfino26, Reference Christine, Diez Roux and Wing28). In this regard, recent studies have evidenced inequities in the NCD mortality burden linked to geographical differences in urban and socio-economic backgrounds(Reference Pou, Tumas and Soria13). Furthermore, official reports from the National Health Ministry have indicated that a high prevalence of overnutrition in adults and children (57·9 and 10·4 %, respectively) coexists with undernutrition conditions, such as stunting (8 %) and anaemia (16 %) in children. It has been also pointed out that households with a dual burden of malnutrition tend to live in adverse socio-economic conditions and that individuals are more likely to have inadequate intakes of calcium and iron(Reference Bassett, Romaguera and Giménez30).
For the present study, considering demographic, epidemiological and NT-based approaches, we hypothesize that the coexistence of diverse sociodemographic and epidemiological circumstances in Argentina makes way for heterogeneous scenarios of NT. These, in turn, lead to different risks of obesity among the population. Thus, the present research aimed to identify NT profiles and assess their association with obesity occurrence in the Argentinian population over the last few years. We proposed a study that combined analyses of geographical clusters for the 2005–2013 period and data of individuals collected from the last available national surveys on health and nutrition carried out in Argentina in 2013.
Methods
Study design and data sources
Argentina has a population of 40 117 096 people (according to 2010 census data). The country is in the southern cone of Latin America, and its territory is organized into twenty-four geographical units (provinces).
A large cross-sectional study was performed, based on an analysis involving two steps. First, a primary data set was prepared by merging geographically aggregated data (at the provincial level) on malnutrition prevalence and contextual variables obtained from official sources (National Survey of Chronic Diseases Risk Factors (NSRF) for 2005, 2009 and 2013; National Survey of Nutrition and Health (NSNH) 2005; and National Population, Household and Housing Census 2010). Then, a multiple correspondence analysis (MCA) was used to detect preliminary, underlying structures (relational dimensions between variable categories) that summarized the main features of a ‘socionutritional space’ in Argentina from our multidimensional data set. The notion of space adopted here follows the notion of the relational model of social space pioneered by Bourdieu(Reference Flemmen, Jarness and Rosenlund31, Reference Bourdieu32). Subsequently, MCA was coupled with hierarchical clustering (HC) to detect differential groups or clusters of observation units (provinces) with specific response patterns, capturing cluster-level heterogeneity and then revealing distinctive profiles of NT between provinces on the basis of dimensions obtained by the MCA.
As a second step, the NSRF database for 2013 was analysed in order to test the role of NT profile membership of individuals (as a proxy variable of contextual order) on obesity occurrence. We used this data set because it is the latest national micro database available (with observable data at the individual level) that provides nutritional status information of individuals in Argentina.
The NSRF data set was compiled by the National Health Ministry using a multistage probabilistic sampling design. The final sample for NSRF 2013 included 32 365 individuals over 18 years old living in towns of at least 5000 people. Trained interviewers carried out a structured questionnaire, which inquired about weight and height (self-reported by respondents), chronic disease background, behaviour, and demographic and socio-economic information of the respondent.
The NSNH was designed by the National Health Ministry to ascertain the prevalence of malnutrition and several related factors, focusing on the mother and child population between 6 and 72 months of age. This survey was carried out in 2005 and it is the only one about child nutrition in Argentina having a national reach. A probabilistic sampling design stratified by clusters was conducted in three stages to reach representativeness at the national, regional and provincial levels, collecting data regarding sociodemographic and health conditions, including nutritional status (taken directly).
The last census in Argentina (2010), carried out by the National Institute of Statistics and Censuses (INDEC), fulfilled quality criteria and had an overall 1·99 % of omission. The census units included population (people), households, private houses and collective housing.
Nutrition transition and sociodemographic indicators
First, both sociodemographic and nutritional status indicators were selected as main domains of the socionutritional space constructed by the MCA. The nutritional status and sociodemographic factors (such as urbanization and poverty) were considered simultaneously because of the close relationship between these contextual variables and the NT process. Moreover, this notion is consistent with the recognized transitional approaches (nutritional, epidemiological and demographic)(Reference McKeown33) and the perspective of social and environmental determinants of health(34).
The sociodemographic variables included were poverty level (percentage of households with unsatisfied basic needs (UBN)) and urbanization degree (percentage of households living in urban areas), both estimated for each province with the REDATAM program (free software for processing data from the 2010 census by INDEC). Specifically, nutritional status data included information reported from the following national surveys: (i) NSNH about underweight prevalence in children (2 sd below the mean according to gender and age, WHO reference), childhood obesity (2 sd above the mean), stunting in children (2 sd below the mean) and childhood anaemia (Hb≤11 mg/dl); and (ii) NSRF referred to adult overweight (BMI=25·0–29·9 kg/m2) and adult obesity (BMI≥30·0 kg/m2).
For MCA, we averaged the provincial nutritional status prevalence data from NSFR for 2005, 2009 and 2013. All variables were coded as ordinal variables, as appropriate, and incorporated into the analysis considering three categories: ‘high’, ‘medium’ and ‘low’ according to the upper, middle and lower tertile of distribution. The only exception was underweight prevalence in children; given the low prevalence values and scarce variability observed in the exploratory analysis, we decided to consider only two excluding categories for this variable: prevalence with values above and below 3 %.
Additionally, we included as supplementary variables (categorized by tertiles) an indicator of higher education (proportion of the population with university studies) and health-care coverage (proportion of the population without health coverage) obtained from the last census data by INDEC, as well as infant mortality rate according to health statistics reported by the National Health Ministry of Argentina. Then, at the modelling stage, we used data available at the individual level from NSRF 2013 (30 290 individuals), such as obesity (yes/no, based on BMI≥30·0 kg/m2 as the criterion), gender (male/female) and age (as a continuous variable).
Statistical analyses
Multiple correspondence analysis and hierarchical clustering
MCA is a popular data reduction technique for exploring the associations among multiple categorical variables(Reference Kim, Choi and Hwang35), which allows for the use of ‘active’ and ‘illustrative’ variables. The active ones determine the structure of the factorial space produced by the MCA. The illustrative ones are supplementary and are given no mass in the analysis, but they are projected a posteriori in the space constructed by the active variables, contributing to result interpretation.
Our analysis included j = 8 active variables: prevalence of underweight, stunting, anaemia and obesity in children; prevalence of overweight and obesity in adults; percentage of households with UBN; and percentage of households living in urban areas. They were collected for the i=24 geographical units (twenty-three provinces and Autonomous City of Buenos Aires) that make up the Argentinian territory. Thus, based on the construction of a data matrix of j × i (columns × rows), the MCA represents the geometric spatial distribution of the responses by different ‘axes’ (factorial dimensions) based on these j variables. Categories of variables appearing close to each other in the low dimensional space produced by the MCA indicate that they often coappear as responses in the data set; the factorial dimensions, in turn, represent the main differences found in the data(Reference Flemmen, Jarness and Rosenlund31). The relative weight of different variables (and their categories) on each dimension was estimated by their relative contribution to total inertia, which constitutes a measure of data variability in the space determined by the dimensions(Reference Nascimento, Almeida and Castilho36). To describe the socionutritional space extracted by the MCA, first the dominant variables across dimensions were selected considering their relative contribution (%) and then the most representative categories, following the criterion of quality of representation based on the estimation of the squared cosine (normalized between 0 and 1, with lower values indicating poor representation of the variable or category in the computed dimensions)(Reference Rodriguez-Sabate, Morales and Sanchez37). In addition, university education, health coverage and infant mortality rate were considered in the MCA as illustrative variables to help characterize the social and health contexts at the provincial level.
Coupled with the MCA, HC analysis was performed. This classification method allows us to identify the NT profiles (response profiles for selected sociodemographic and NT indicators) associated with different groups of provinces on the basis of factorial dimensions obtained by the MCA (the first five MCA dimensions were used, which concentrate 67·55 % of explained variation). Thus, each province was classified into a cluster, based on Ward’s aggregation criterion as variance criterion. This method aggregates the elements in order to minimize the intraclass variance and to maximize the variance between classes (interclass variance). The choice of the optimal data set partition was made taking into account the highest numbers of clusters without significantly increasing the total inertia ratio as well as avoiding clusters with low frequency and/or low face validity (difficult to be interpreted). Additionally, the selection of three clusters was based on the resulting hierarchical dendrogram. Both MCA and HC were carried out using the software SPAD 5.5 of DECISIA.
Multilevel modelling
To broaden the NT profile description, we analysed the distribution of obesity in males and females across the NT profiles (30 290 participants of NSRF 2013) by means of cross-reference tables of frequencies (for obesity, gender and NT profile as variables) and the χ 2 test. Furthermore, we estimated the effect of NT profiles on obesity occurrence by applying a mixed-effect (two-level) logistic regression model(Reference Rabe Hesketh and Skrondal38). For model selection, we performed an analysis in sequential steps, considering obesity as a binary outcome and accounting for the spatial clustering of data (30 290 participants nested into twenty-four provinces, as group variable). Thus, a random intercept (across provinces) was used to account for the spatial variability of obesity distribution. First, a variance component model (‘empty’ model) was used, to identify significant contextual components. Subsequently, a two-level random-intercept model was performed, including NT profile membership of individuals (i.e. NT profile that characterizes their province of residence: ‘Socionutritional lag’; ‘Double burden of malnutrition’; ‘Incipient socionutritional improvement’) as a contextual covariate. A third model included these contextual covariates well as age (continuous) and gender (male or female) as confounding variables. Finally, extending the previous model, a two-level random-coefficient model was fixed to allow age effect to vary across provinces. To select the final model, the Akaike information criterion and Bayesian information criterion were used as well as the likelihood-ratio test(Reference Rabe Hesketh and Skrondal38). According to that result, the third random-intercept model was preferred. OR and 95 % CI were estimated as association measures between the obesity risk and covariates of interest. All these statistical analyses were performed using the statistical software package Stata version 14.
The conceptual framework supporting the methodological strategy, hypothesis and relationships between variables in the present study is summarized in Fig. 1.

Fig. 1 (colour online) Conceptual model supporting the methodological strategy, hypothesis and relationships between variables
Results
The MCA allowed us to obtain factors or dimensions as synthetic measures that express the relationships between the so-called ‘active’ and ‘illustrative’ variables. Taking into account the theoretical and methodological framework adopted, this was interpreted in terms of a socionutritional space in which these variables interact.
The socionutritional space extracted by the MCA showed three dimensions that accumulated 49·79 % of the total explained variance. The first dimension accounted for 19·88 % of the total variability. As shown in Table 1, it was characterized mainly by contributions of high (upper tertile) levels of urbanization (9·7 %) and UBN (11·5 %), high prevalence of stunting (14·1 %, upper tertile) and underweight (10·5 %, prevalence above 3 %) in children, and low prevalence of childhood obesity (9·1 %, lower tertile). On the other hand, the second dimension (15·95 % of explained variance) was made up mainly by the low modality (lower tertile) of households with low UBN (13·0 %), low prevalence of anaemia (13·6 %) and stunting (13·9 %) in children. Finally, the third dimension explained 13·95 % of the total variance and was mostly composed by the contributions of a low urbanization (7·5 %, lower tertile), high prevalence of adult obesity (9·5 %, upper tertile), intermediate level of overweight in adults and anaemia in children (8·1 and 12·6 %, respectively; Table 1).
Table 1 Contributions of selected nutrition transition and sociodemographic indicators to the dimensions (factors) identified by multiple correspondence analysis. Argentina, 2005–2013

UBN, unsatisfied basic needs.
Then we applied the HC method, based on the first five factors of the multidimensional space obtained by the MCA (cumulative variance of 67·55 %). Thus, based on the socionutritional dimension extracted by the MCA, the subsequent HC analysis allowed us to identify specific NT profiles that differentiate the Argentinian provinces into three groups according to the nutritional status and sociodemographic characteristics of their populations.
Table 2 shows the response modalities for the variables considered in the MCA that presented a significant association (test value >2) with clusters. Taking into account our results and the NT theory(Reference Popkin6), we decided to call the NT profiles identified for Argentina as follows: ‘Socionutritional lag’, ‘Double burden of malnutrition’ and ‘Incipient socionutritional improvement’. Table 2 summarizes the main characteristics of these NT profiles. The most dominant features of the ‘Socionutritional lag’ profile were a high prevalence of stunting in children (upper tertile), low prevalence of childhood obesity (lower tertile), high proportion of households with UBN (upper tertile), as well as a high proportion of people without health coverage, low proportion of population with higher education studies and high (relative) infant mortality rates. On the other hand, the profile ‘Double burden of malnutrition’ was characterized by a predominance of intermediate values of stunting in children (middle tertile), high values of childhood and adult obesity (upper tertile) and a large proportion of households in urban areas (upper tertile). Lastly, the ‘Incipient socionutritional improvement’ profile was made up mainly of a low prevalence of stunting in children and obesity in adults and a low proportion of households with UBN (lower tertile).
Table 2 Nutrition transition (NT) profiles revealed by the multiple correspondence analysis and hierarchical clustering. Argentina, 2005–2013

UBN, unsatisfied basic needs.
An optimal partition of the database (twenty-four provinces) was thus constructed for the composition of the three types of NT profile. Clusters of Argentinian provinces are illustrated in Fig. 2: one cluster was made up of some provinces of the central eastern, north-western and southern zones; another cluster included the Autonomous City of Buenos Aires, provinces of the central area, the eastern central region and the Cuyo region; and the last comprised the rest of the provinces, with a greater representation in the northern area.
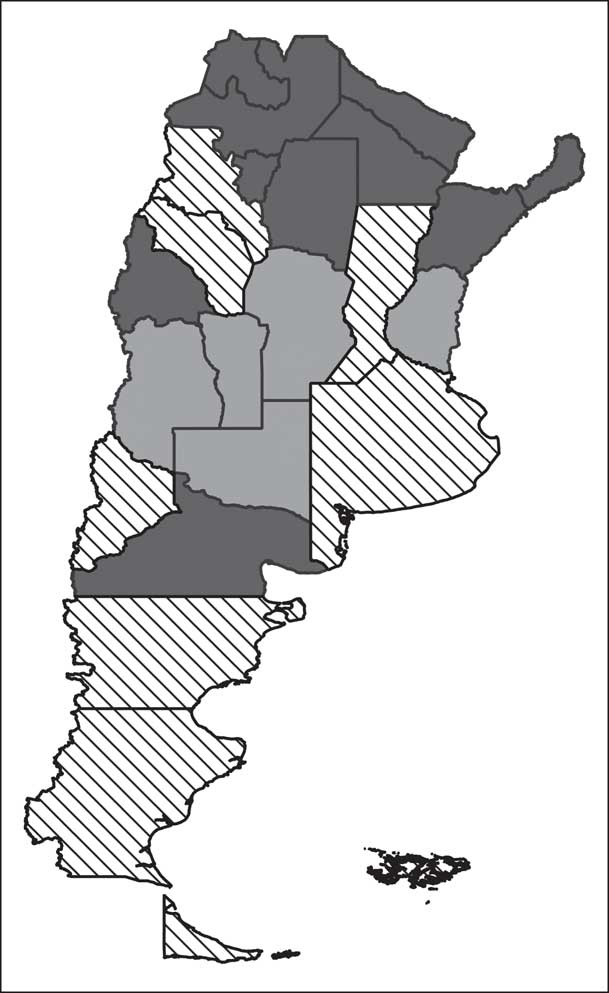
Fig. 2 Mapping of provinces of Argentina clustered by nutrition transition profiles (![]() , ‘Socionutritional lag’;
, ‘Socionutritional lag’; ![]() , ‘Incipient socionutritional improvement’;
, ‘Incipient socionutritional improvement’; ![]() , ‘Double burden of malnutrition’). Argentina, 2005–2013
, ‘Double burden of malnutrition’). Argentina, 2005–2013
It is worth pointing out that the ‘Socionutritional lag’ profile combines the greater number of Argentinian provinces (42 %), followed by the ‘Double burden of malnutrition’ profile (which accounts for 33 % of the Argentinian provinces). Thus, a smaller number of provinces (25 %) would be in the most favourable transitional scenario, the ‘Incipient socionutritional improvement’ profile.
In a second phase of our study, we analysed the distribution of obesity in 30 290 individuals (2075 were excluded because weight or height values were missing) taking into account the latest available micro database of the national health survey: the NSRF carried out in 2013. About 55 % of the respondents were women, and most individuals belonged to the ‘Socionutritional lag’ and ‘Double burden of malnutrition’ profiles (34·49 and 41·56 %, respectively). Overall, 21·48 % (n 6505) of the respondents were obese. Additionally, obesity was more prevalent in men than in women (23·41 v. 19·89 %, P<0·001).
Regarding the distribution of obesity in terms of gender and NT profile, the so-called ‘Double burden of malnutrition’ showed the highest obesity burden (23·44 %), followed by the ‘Socionutritional lag’ and ‘Incipient socionutritional improvement’ profiles (20·70 and 19·19 %, respectively). Obesity was more frequent in men than in women in all NT clusters; however, the largest differences were observed in the ‘Incipient socionutritional improvement’ profile (21·71 v. 17·23 % in men and women, respectively). Additionally, results from χ 2 tests showed significant associations between NT profiles and obesity condition, in men and women (P<0·001).
As shown in Table 3, there was a significant higher risk of obesity associated with ‘Socionutritional lag’ (OR=1·16; 95 % CI 1·02, 1·32) and with ‘Double burden of malnutrition’ (OR=1·44; 95 % CI 1·26, 1·65) profiles, compared with the ‘Incipient socionutritional improvement’ profile as the reference. In addition, the risk of obesity was lower in women (OR=0·79; 95 % CI 0·75, 0·84) than in men, and there was a significant higher risk of obesity associated with increasing age (OR=1·01; 95 % CI 1·01, 1·02). The estimated variance of the clustering variable intercept was significant; thus, the fitted multilevel logistic regression model could quantify unobserved heterogeneity attributable to variability in the provinces (Table 3).
Table 3 Association measures between obesity and nutrition transition (NT) profiles, estimated by multilevel logistic regression models. Argentina, 2013

Discussion
The present study identified three NT profiles in Argentina, which were based on the nutritional status and sociodemographic characteristics of the populations at province level over the last few years. The first NT profile, ‘Socionutritional lag’, was characterized mainly by undernutrition and socio-economically disadvantaged conditions, whereas the ‘Double burden of malnutrition’ profile showed a dual burden of malnutrition (under- and overnutrition) in highly urbanized scenarios. The ‘Incipient socionutritional improvement’ profile exhibited the most favourable conditions regarding nutritional status (low prevalence of under- and overnutrition) and socio-economic indicators. Moreover, we found that living in a context of ‘Socionutritional lag’ or ‘Double burden of malnutrition’ was significantly associated with a higher risk of obesity occurrence in adults, compared with people living in provinces with an ‘Incipient socionutritional improvement’ profile.
Overall, this synchronic and heterogeneous national scenario could be understood within the NT framework, because it has been pointed out that, in some countries, different stages of NT could coexist(Reference Popkin6). Furthermore, each NT profile identified in our work could be related to some of the broad patterns proposed by Popkin(Reference Popkin6) in the original formulation of the NT theory. Popkin’s proposal is a recognized heuristic and useful framework that integrates the complex dynamics of nutrition, socio-economic and demographic factors in five broad nutrition patterns or stages which are not restricted to periods in which they first arose but continue to describe some geographical and socio-economic sub-populations(Reference Popkin6, Reference Popkin and Gordon-Larsen39).
Briefly, in the first pattern described in the NT theory, ‘collecting food’, the population is robust, lean, with few nutritional deficiencies and high activity patterns, and the diet is high in carbohydrates and fibre and low in fat (especially saturated fat). In the second pattern, ‘famine’, nutritional deficiency diseases emerge and height declines; while in the third pattern, ‘receding famine’, many deficiencies disappear and stature grows. Then, in the ‘degenerative diseases’ pattern, an increased prevalence of obesity leads to NCD as a result of a diet high in fat and refined carbohydrates, accompanied by an increasingly sedentary lifestyle. Lastly, in the ‘behavioural change’ pattern the prevalence of obesity decreases, leisure exercise increases, and the diet is lower in fat and processed foods and higher in carbohydrates, fruits and vegetables(Reference Popkin6).
Specifically, the ‘Socionutritional lag’ profile identified in Argentina could be linked to the so-called ‘receding famine’ pattern proposed in the NT theory, given that child undernutrition problems are distinctive characteristics in both scenarios. In this respect, previous studies in Latin America have found that undernutrition, particularly stunting, is still a public health problem in the context of NT(Reference Rivera, Barquera and González‐Cossío18).
Even though the identified ‘Double burden of malnutrition’ profile could be considered as similar to the so-called ‘degenerative diseases’ pattern of the fourth stage in the NT framework, some characteristics of the prior phase of ‘receding famine’ persist. Given the coexistence of a high burden of adult and infant obesity as well as a moderate prevalence of undernutrition in children (stunting), we suggest that this profile could reflect a transitional situation between the third and fourth NT stage reported originally by Popkin(Reference Popkin6) (‘receding famine’ and ‘degenerative diseases’, respectively). In this regard, it is relevant to note that heterogeneity in epidemiological transition was previously reported as a common feature of Latin American countries, a phenomenon labelled as ‘epidemiologic polarization’(Reference Frenk, Frejka and Bobadilla40). Due to the close relationship between epidemiological transition and NT processes, it is possible to understand the dual burden of malnutrition as a nutritional expression of polarization. In addition, nutritional polarization is likely to be more evident in Latin American countries, given the region’s history of pronounced social inequalities. On the other hand, it is important to note that the double burden of malnutrition takes place in highly urbanized provinces, which becomes relevant if we consider that urbanization has been widely recognized as a driver of social inequalities(Reference Liddle41). Therefore, a complex net of large-scale societal factors may underlie and explain the nutritional scenario mentioned above.
Lastly, the ‘Incipient socionutritional improvement’ profile could be related to the last reported NT stage, the so-called ‘behavioural change’ pattern(Reference Popkin6, Reference Popkin, Horton and Kim42), because the low prevalence of both under- and overnutrition, together with favourable socio-economic conditions, are the most dominant features. The ‘behavioural change’ stage is the last phase of the NT and reflects an ideal situation of people making behavioural changes in eating habits and overall lifestyle which result in lower body fatness, NCD related to the diet and healthy ageing(Reference Popkin6). Since practices related to health are associated with social position, with higher socio-economic groups generally being the first to adopt healthy recommendations, a social gradient in this process might exist. In fact, our results showed a concurrence of low prevalence of malnutrition (over- and undernutrition) and favourable social conditions, which has also been reported in others works(Reference Cockerham43, Reference Bojorquez, Unikel, Cortez and Cerecero44).
In agreement with our results, previous studies in developing countries have reported a great heterogeneity in the timing, patterns and trends of the NT process(Reference Popkin and Gordon-Larsen39). Barria and Amigo(Reference Barria and Amigo20) have reviewed the Latin American NT profile and concluded that countries have evolved through different transition stages. An increase in overweight and a tendency to decrease underweight and stunting prevalence were seen in most countries. Also coinciding with our results, a heterogeneous spatial distribution of NT stages was reported in Peru, with different rates of over- and undernutrition within the country(Reference Chaparro and Estrada11). As shown in our study, the poorest Peruvian departments were still facing a high prevalence of stunting, while more socio-economically advantaged areas showed a high overweight prevalence. Moreover, a specific stage characterized by a dual burden of malnutrition, which involved most Peruvian departments, was also identified(Reference Chaparro and Estrada11). Specifically, in Argentina, prior studies have reported a double burden of malnutrition in the northern area, attributable to the NT process(Reference Bassett, Romaguera and Giménez30).
It has been broadly recognized that obesity prevalence has been increasing at a fast rate in developing countries, mainly because of changes in dietary patterns and physical activity described as the NT process(Reference Popkin, Horton and Kim42). Our results have shown an association between some NT profiles (‘Socionutritional lag’ and ‘Double burden of malnutrition’) and obesity prevalence in the Argentinian population.
Interestingly, unfavourable socio-economic conditions are a distinctive feature of the ‘Socionutritional lag’ profile. While in developed countries, obesity is widely considered a condition that primarily affects people of lower socio-economic status compared with those of higher socio-economic status, in developing countries the debate continues(Reference Dinsa, Goryakin and Fumagalli45). Moreover, as countries develop economically, rates of obesity among socially disadvantaged groups increase(Reference Pérez-Ferrer, McMunn and Zaninotto21). This could be related to the fact that after a certain level of economic growth, lower socio-economic groups have more access to high-energy dietary patterns. Higher unemployment, lower educational level, lower physical activity level and irregular meals among poorer people are considered as other related factors in this regard(Reference Żukiewicz-Sobczak, Wróblewska and Zwoliński46). Furthermore, it has been pointed out that lower socio-economic groups may be more susceptible to an ‘obesogenic environment’, given that their eating and activity habits are more probably the ‘default choices’ on the environmental offer(Reference Monteiro, Conde and Lu47). On the other hand, the high level of urbanization is a main characteristic of the ‘Double burden of malnutrition’ profile. This is consistent with the whole NT framework, since growing tendencies of overweight and obesity are fuelled mainly by changes in the population’s eating and physical activity patterns, which are inexorably linked to large-scale societal transformations, such as urbanization(Reference Meisel, Sarmiento and Olaya23, Reference Popkin, Adair and Ng48).
Around 20·8 % of the Argentinian population was obese in 2013, with differences by gender: obesity prevalence was 18·8 % in women and 22·9 % in men. Previous studies have analysed temporal trends in BMI in Argentina and reported that BMI was rapidly increasing over time. Some authors found that a higher BMI was more frequent in women of lower socio-economic position, as well as positively associated with age for women under 60 years of age(Reference Christine, Diez Roux and Wing28). In our study, an overall direct relationship between age and nutritional status, and gender differences in obesity risk were found. Specifically, our results showed a higher risk of obesity for males. Previous researchers have pointed out that males give a higher priority to taste and convenience and feel more ambivalent about healthy dietary choices(Reference Arganini, Saba and Comitato49). This population group presents a complex pattern of socio-economic inequalities in obesity, especially in middle-income countries(Reference Dinsa, Goryakin and Fumagalli45). It has also been shown that obese men are less likely to have accurate weight perception, weight dissatisfaction and attempted weight loss than obese women(Reference Tsai, Lv and Xiao50).
Regarding methodological concerns, the MCA has been proposed as a convenient technique to explore relationships among multiple categorical variables, which presents the key advantage of being versatile because no distributional assumptions are required(Reference Sourial, Wolfson and Zhu51). Coupled with the HC, it is a useful data reduction method that helps to recognize patterns of associations (as synthetic dimensions) underlying categorical data sets, as well as to capture derived heterogeneity at cluster level. A recent review study highlights the usefulness of Bourdieu’s theoretical and methodological framework in exploring how the environment interacts with eating habits(Reference De Morais Sato, Gittelsohn and Unsain52). In our case, Bourdieu’s notion of social space allowed us to build a simplified model of the socionutritional field as a whole. This framework made it possible to conceptualize or ‘objectify’, for each province of Argentina, its position in the space of NT nowadays. In accordance with Bourdieu’s propositions, that position seemed to be related to the distribution of economic or cultural capital(Reference Bourdieu53), which would be represented by the urbanization, poverty and educational level proxy variables considered here.
In our opinion, our work makes an original contribution since this integrated approach is not commonly applied in nutritional epidemiology research, even though its potential application in this field has been recognized(Reference Sourial, Wolfson and Zhu51). This important issue also shows consistency with the theoretical postulations that reinforce the close relationship between the nutritional and the demographic transition phenomena(Reference Nicolau and Pujol54). In this sense, our socionutritional space expressed nutritional status patterns (commonly a reflection of populations’ lifestyles) which tend to occur together in provinces with sociodemographic similarities, as reported for ‘obesogenicity’ of the environments(Reference Swinburn, Egger and Raza55). In agreement with Cockerham(Reference Cockerham43), beyond the individualistic paradigm of health lifestyles, we considered the structural influences on nutritional status.
Before concluding, some limitations of our study need to be considered. First, the missing weight and height data in the study sample are considerable (6·4 %) and may be related to socio-economic status. Although this lack of response could affect the generalizability of results and introduce bias in the magnitude of association, previous studies have shown that missing BMI data do not seem likely to have impacted conclusions(Reference Razzaghi, Tinker and Herring56).
Regarding the MCA, it should be noted that this analysis is an exploratory technique. Therefore, the results from the MCA must be interpreted for essentially descriptive purposes. However, some authors highlight MCA’s complementary role for inference in epidemiology(Reference Sourial, Wolfson and Zhu51). The strong aspect of our work is that it represents an example of how the MCA and HC can be used as complementary techniques of multilevel modelling to reveal the effects of socionutritional characteristics in geographical contexts (reflecting NT profiles as contextual influences) on the individual occurrence of obesity. On the other hand, a central point in studies that consider population as observation units (like provinces in the first step of the present study) is the risk of committing an ecological ‘fallacy’ (i.e. to make biased inferences at the individual level on the basis of associations observed on attributes from aggregated levels)(Reference Pou, Tumas and Soria13). Thus, NT profile effects must be interpreted carefully as an influence of contextual order. However, we underline the fact that our study considered the spatial correlation and variability coming from two hierarchical levels in data sets: individuals nested in provinces.
Finally, data quality and temporal coherence of secondary data sources (used simultaneously) may be a major issue in ecological designs. Although our data sources are very heterogeneous in terms of their years of implementation and target population, we consider they are suitable options (i.e. based on available data on a large scale from official Argentinian sources) to identify overall NT profiles from multiple socionutritional domains over the last few years. In particular, while criticism can be made for using the NSNH 2005 as a source of data on child nutritional status over the period of study, it is in fact the only survey conducted in this field in the history of our country with national coverage and based on a probabilistic sample. What is more, taking into account that information on stunting is relevant for studying the NT phenomenon and that these data are the only ones available for the child population in Argentina, we consider that the inclusion of NSNH as a source of data is justified in our study. Additionally, consideration of nutritional data on the child population is valuable since this age group is considered particularly vulnerable to social inequalities, probably reflecting their early impact on the population. On the other hand, NSRF presents the weakness of using weight and height data reported by respondents to assess the nutritional status of adults. However, there are studies supporting that self-reported anthropometric measures are cost-effective and that the misestimations are minimal(Reference Costa-Font and Gil57, Reference Tang, Aggarwal and Moudon58). Moreover, we highlight that the consistency of all the data set used in our study has been rigorously controlled by trained specialists in demography and data source management. Additionally, it is important to note that the challenges in studying nutrition in a developing country were recognized, including the lack of individual measurement of dietary intake(Reference Popkin, Lu and Zhai8).
In summary, we identified a complex and heterogeneous socionutritional scenario in Argentina, represented in three groups of provinces with concurrent nutritional and sociodemographic characteristics, which were considered NT profiles. In turn, some NT profiles showed associations with obesity burden. Our results also highlight the role of sociodemographic factors in shaping the NT profiles.
The current study provides new insights into NT and obesity burden drivers within the South American context. Understanding these processes is vital for formulating policies. Therefore, our work could help determine targeted and equitable public policies in Argentina. These should be oriented to the obesity epidemic through the prioritization of contexts with socionutritional lag and plan strategies to address those challenging scenarios with concomitant undernutrition. Furthermore, given the complex and related social and health inequalities involved in the NT process, our results highlight the importance of adopting an intersectionality approach in the definition of public policies for Argentina and similar settings as well.
Acknowledgements
Acknowledgements: The authors are especially grateful to the National Ministry of Health for providing the databases. They would also like to thank Gabriela Díaz Cortez for her language assistance. Financial support: This work was supported by the Science and Technical Department of the University of Córdoba (grant number 30820150100344CB). N.T. was funded by a fellowship (grant number 004552/16) from the National Scientific and Technical Research Council (CONICET). The Science and Technical Department of the University of Córdoba and CONICET had no role in the design, analysis or writing of this article. Conflict of interest: None. Authorship: N.T. and S.A.P. formulated the research questions, designed the study and wrote the article. N.T., C.R.J., L.R.A., G.F.S. and S.A.P. analysed the data, interpreted the findings and critically revised the manuscript. Ethics of human subject participation: Since this study involved anonymized records and data sets existing in the public domain, no ethical review was required.


