


The quantitative 24 h dietary recall method, during which a participant recalls the types and quantities of food consumed on the previous day, is commonly used for collecting dietary data, particularly in low-resource settings(Reference Gibson, Charrondiere and Bell1). Inaccurate estimation of portion sizes eaten is the main source of error in 24 h recalls(Reference Gibson, Charrondiere and Bell1–Reference Lazarte, Encinas and Alegre3), because participants may find it difficult to remember accurately the size of the portion consumed. To address this issue, researchers have developed non-photographic, photographic and pictorial (i.e. line drawings, shapes) portion-size estimation aids (PSEA). Photographic and pictorial PSEA can be printed or digital and are often shown next to a standard size object or on gridlines (i.e. fiduciary markers) to help participants estimate the scale.
The use of photographic or pictorial PSEA during a dietary recall engages the psychological constructs of perception, conceptualization and memory(Reference Nelson and Haraldsdottir4). Perception refers to a person’s ability to perceive food in a photograph and compare it with food in reality. Conceptualization refers to the ability to translate a mental image of a portion size eaten into an amount shown in a photograph. Memory refers to a person’s ability to recall an amount of food previously eaten. Each of these constructs may be affected by characteristics of both the food in question and the individual. Portion-size image characteristics, including the image format, pictorial depiction, number of portion-size options shown and angle at which the photograph was taken, can be sources of error in portion-size estimation(Reference Nelson and Haraldsdottir4–Reference Naska, Valanou and Peppa7).
Although validation studies of photographic PSEA have been conducted and published(Reference Lazarte, Encinas and Alegre3,Reference Ovaskainen, Paturi and Reinivuo6,Reference Amougou, Cohen and Mbala8–Reference Venter, MacIntyre and Vorster14) , there is little evidence concerning the optimal display of images in photographic PSEA. For example, food photographs have been developed according to selected criteria, but we identified only five studies that tested visual characteristics formally to determine the optimal display for photographs before validating a PSEA(Reference Subar, Crafts and Zimmerman15–Reference Liu, Chiu and Lin19). Two of these studies involved children and/or adolescents(Reference Baranowski, Baranowski and Watson16,Reference Vereecken, Dohogne and Covents17) , while the others involved adults(Reference Subar, Crafts and Zimmerman15,Reference Choplin and Motyka Joss18,Reference Liu, Chiu and Lin19) . All were conducted in high-income countries. However, results may not be generalizable to populations in low-income countries, in part because of potential differences in exposure to media and images and differences in educational backgrounds.
The primary objective of the present study was to engage respondent conceptualization to investigate the preferences for and ease of use of different visual characteristics in a low-resource setting. The secondary objectives were to document the accuracy of portion-size selections using PSEA with these different visual characteristics against a measured quantity of food consumed and to explore the feasibility of showing portion-size images to participants on a tablet. We evaluated each visual characteristic in isolation to better understand its specific impact on portion-size selection.
Methods
Study setting and participants
The study took place in Blantyre and Chikwawa Districts in the southern region of Malawi from August to October 2017. We chose these districts for their concentration of urban and rural populations, their variability in levels of education and their proximity to one another. At the time the study was designed, 25 % of females in Chikwawa had no education compared with 9 % in Blantyre(20). We recruited participants in each of the districts to include individuals with varying levels of education, which could affect their ability to choose accurate portion sizes(Reference Kuehneman, Stanek and Eskridge21). We selected two communities in each district for each set of study groups and identified centrally located data collection sites within the communities in consultation with community leaders. Communities were selected based on similar population size and sociodemographic characteristics, and different communities were selected for each set of study groups (Fig. 1) to ensure women did not participate in more than one group.
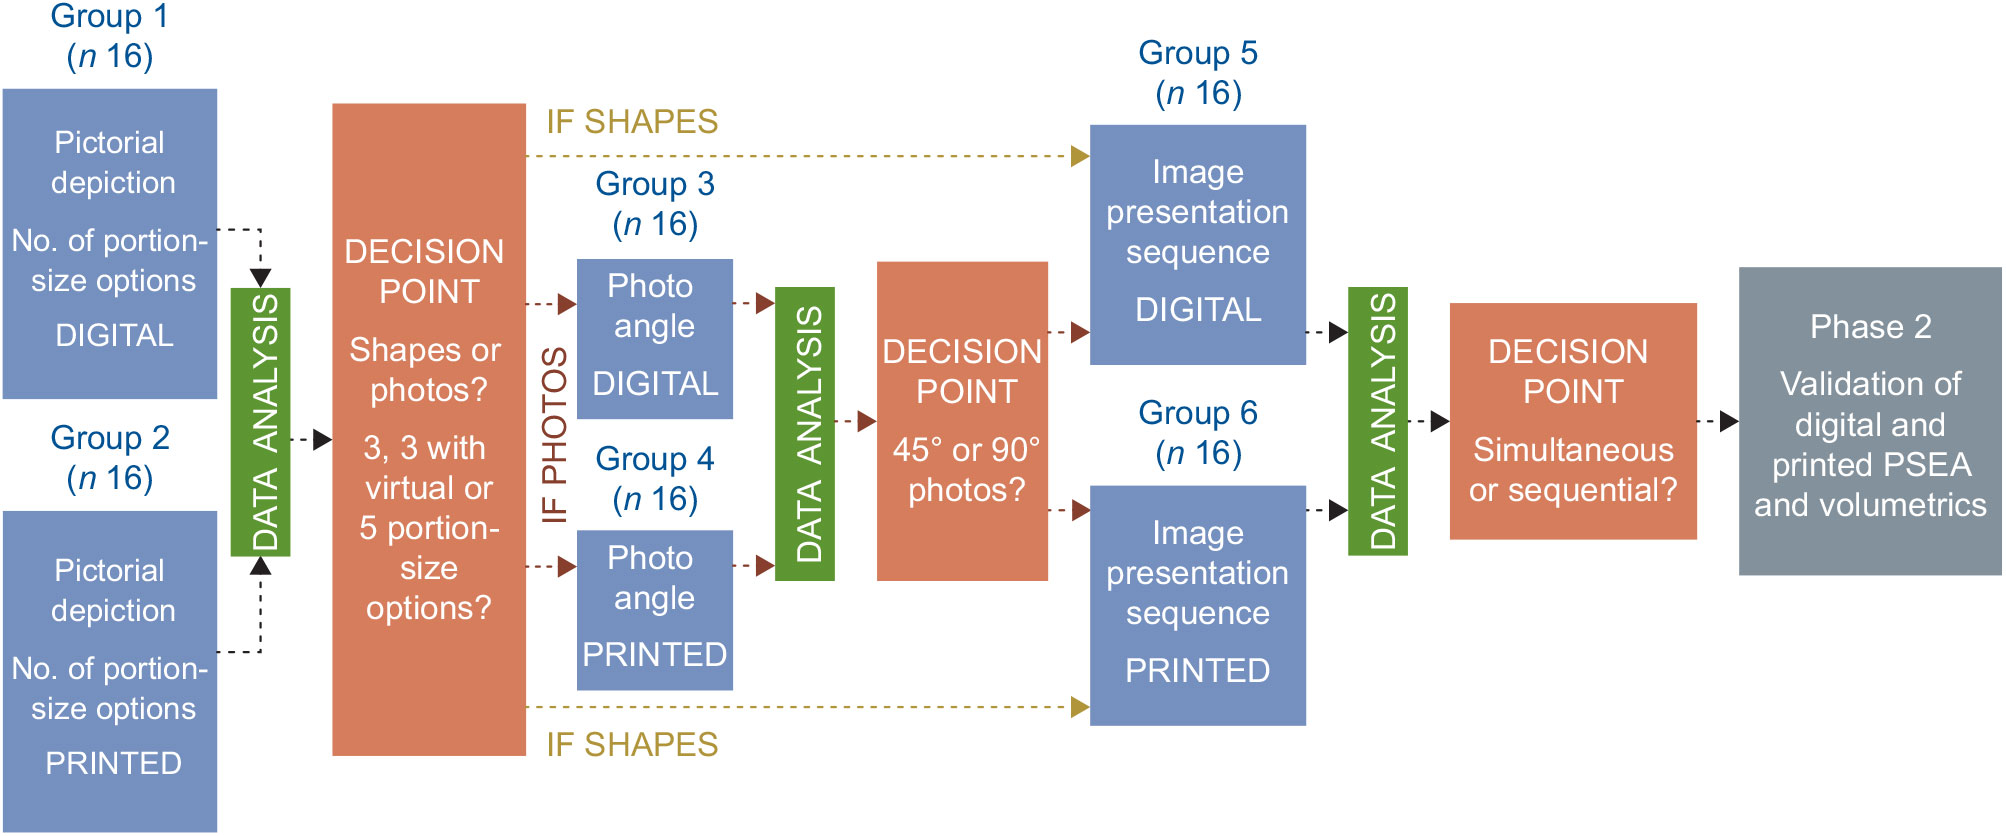
Fig. 1 Phase 1 design flow and decision points (PSEA, portion-size estimation aid)
We recruited, screened and enrolled women aged 18–45 years who lived within 2 km of the data collection sites until sixteen women were enrolled in each study group (total, n 96). We enrolled women in equal numbers by rural/urban location and study site in each study group. We intended to select women in equal numbers by level of education (≤4 years or >4 years). The sample size was predetermined as sufficient to achieve qualitative saturation, the point at which additional interviews provide no new information(Reference Guest, Bunce and Johnson22), not for the purposes of statistical inference. Women of reproductive age were selected as the target population because they are typically the focus of research studies assessing dietary intake; thus, their input into the development of PSEA is critical. Four years of education was selected as the cut-off because having more than four years of education in Malawi is correlated with literacy.
Study design
We designed a two-phase study to investigate the optimal characteristics of a photographic PSEA. This paper is concerned with Phase 1, the formative phase.
Phase 1 used a convergent mixed-methods design(Reference Creswell23) and stepwise approach, informed by Subar et al. (Reference Subar, Crafts and Zimmerman15), to assess multiple visual characteristics of interest. We tested four characteristics: (i) pictorial depiction (photographs v. drawings of food shapes); (ii) photograph angle (45° v. 90°); (iii) number of portion-size options (three portions; three portion sizes with four virtual options, which included three portion sizes with the option to select a virtual portion size that was (a) between small and medium, (b) between medium and large, (c) smaller than the smallest or (d) larger than the largest portion size shown, for a total of seven options; and five portions); and (iv) order of image presentation (simultaneous v. sequential). We collected data from six separate groups (Fig. 1). Women participated in one study group only and thus evaluated the designated visual characteristics for their study group only (Table 1). We randomized the order of the visual characteristics that we presented to equal numbers of participants with the exception of number of portion sizes, which were tested in the same order by all participants in Groups 1 and 2. Data from each group were analysed to determine which of the specific visual characteristics were optimal according to participants’ preferences and ease-of-use perceptions and the degree of accuracy of their portion-size estimates in relation to a weighed food record. We then used the results to determine the focus of the next groups so that subsequent visual characteristics could be tested in isolation. The goal of this design was to evaluate visual characteristics separately and avoid cognitively overburdening participants.
Table 1 Visual characteristics and combinations tested for each food and water by each study group
Data collection procedures
Each group followed the same data collection procedures. We informed community leaders about our study and the desired participant eligibility criteria. They then invited potentially eligible participants to come to a designated community gathering place, where data collectors screened women for eligibility and conducted an informed consent process for those who were eligible and interested in participating. Other community members were recruited to prepare the foods according to typical preparation methods using ingredients the study team provided. Participants then served themselves portions of each food on a separate plate and water in a tumbler. We used the same utensils, plates and cups with all participants. All portions were weighed and recorded before and after consumption using a Salter Aquatronic digital kitchen scale, model 1020BKSS. Data collectors administered a demographic and socio-economic questionnaire to each participant after she finished eating. At least 30 min after the end of the meal, data collectors administered a meal recall and exit interview (see online supplementary material, Supplemental File 1). Two to six sets of digitally displayed (digital) or printed PSEA were administered to participants, according to their group (Fig. 1). Participants in Groups 1 and 2 made six portion-size selections, and participants in Groups 3, 4, 5 and 6 made two portion-size selections for each food and water they consumed (Table 1). Participants selected portion sizes using images with different visual characteristics consecutively without a pause in between portion-size selections for each visual characteristic, following the meal recall and exit interview guide. The data collector then asked open- and closed-ended questions about participants’ preferences, ease of use and overall experience using the PSEA.
Development of food images
We developed images of foods and water for the study based on guidelines for developing food photographs(Reference Nelson and Haraldsdottir5). The photographs were taken by a Malawian photographer and edited and finalized by a US-based photographer and graphic designer. Groundnuts, bananas, mgaiwa nsima (wholegrain thick maize porridge, the staple food in Malawi), kidney bean stew, dark green leafy vegetable stew and water were selected because they are widely consumed in Malawi. These foods also represent various forms of food: amorphous (stews), single-unit food (bananas), small pieces (roasted groundnuts) and shaped foods (pieces of nsima)(Reference Nelson and Haraldsdottir5).
The food portion sizes were based on dietary intake data from a study of 203 pregnant women in rural Malawi collected through 24 h dietary recalls(Reference Hjertholm, Iversen and Holmboe-Ottesen24) (see online supplementary material, Supplemental Table S1). We calculated percentiles of grams consumed to determine the portion-size options for each food. For example, for three portion sizes, we used the 25th, 50th and 75th percentiles of intakes in grams. The portion sizes for water were based on a standard size plastic tumbler in Malawi filled to varying levels (e.g. one-quarter, half, three-quarters). Bananas only had three portion sizes and three with virtual portion sizes, because there was not enough variation in sizes available in the markets to include five.
Photographs
The photographer took individual photographs of each portion size of each food with a Nikon D5100 camera (16 mega pixels, exposure manual, focal length 29 mm, shutter speed 0·10 s and aperture set to f/20) in natural light. Each photograph included a numerical identifier to ensure the correct gram weight was associated with it. Foods and water were weighed to the nearest whole gram. Using a tripod, the photographer took photographs of each portion size of each food at both a 45° and a 90° (i.e. directly above the plate) angle. All foods were photographed on a solid-colour plastic plate, and water was photographed in a clear plastic tumbler. The plate and tumbler were the standard size used in Malawi. A tablespoon served as a fiduciary marker in all photographs and was placed to the right of the plate or tumbler. The plate and spoon took up most of the screen, and the background was a wooden tabletop. The foods were prepared according to typical local preparation methods. Bananas were weighed and photographed without a peel, and nsima was formed into oblong patties – the way it is typically eaten. We used Adobe Photoshop (version 16) to adjust the colour balance of the photographs to be consistent across all images and to crop them to approximately 62 mm × 50 mm so that the five portion-size photographs could fit onto the tablet screen simultaneously. The tablets used for digital display of photographs were Samsung Galaxy Tab A SM-T580NZKAXAR with 10·1-inch display size and 1920 pixel × 1200 pixel resolution. The portion sizes appeared in order from smallest to largest (Fig. 2).
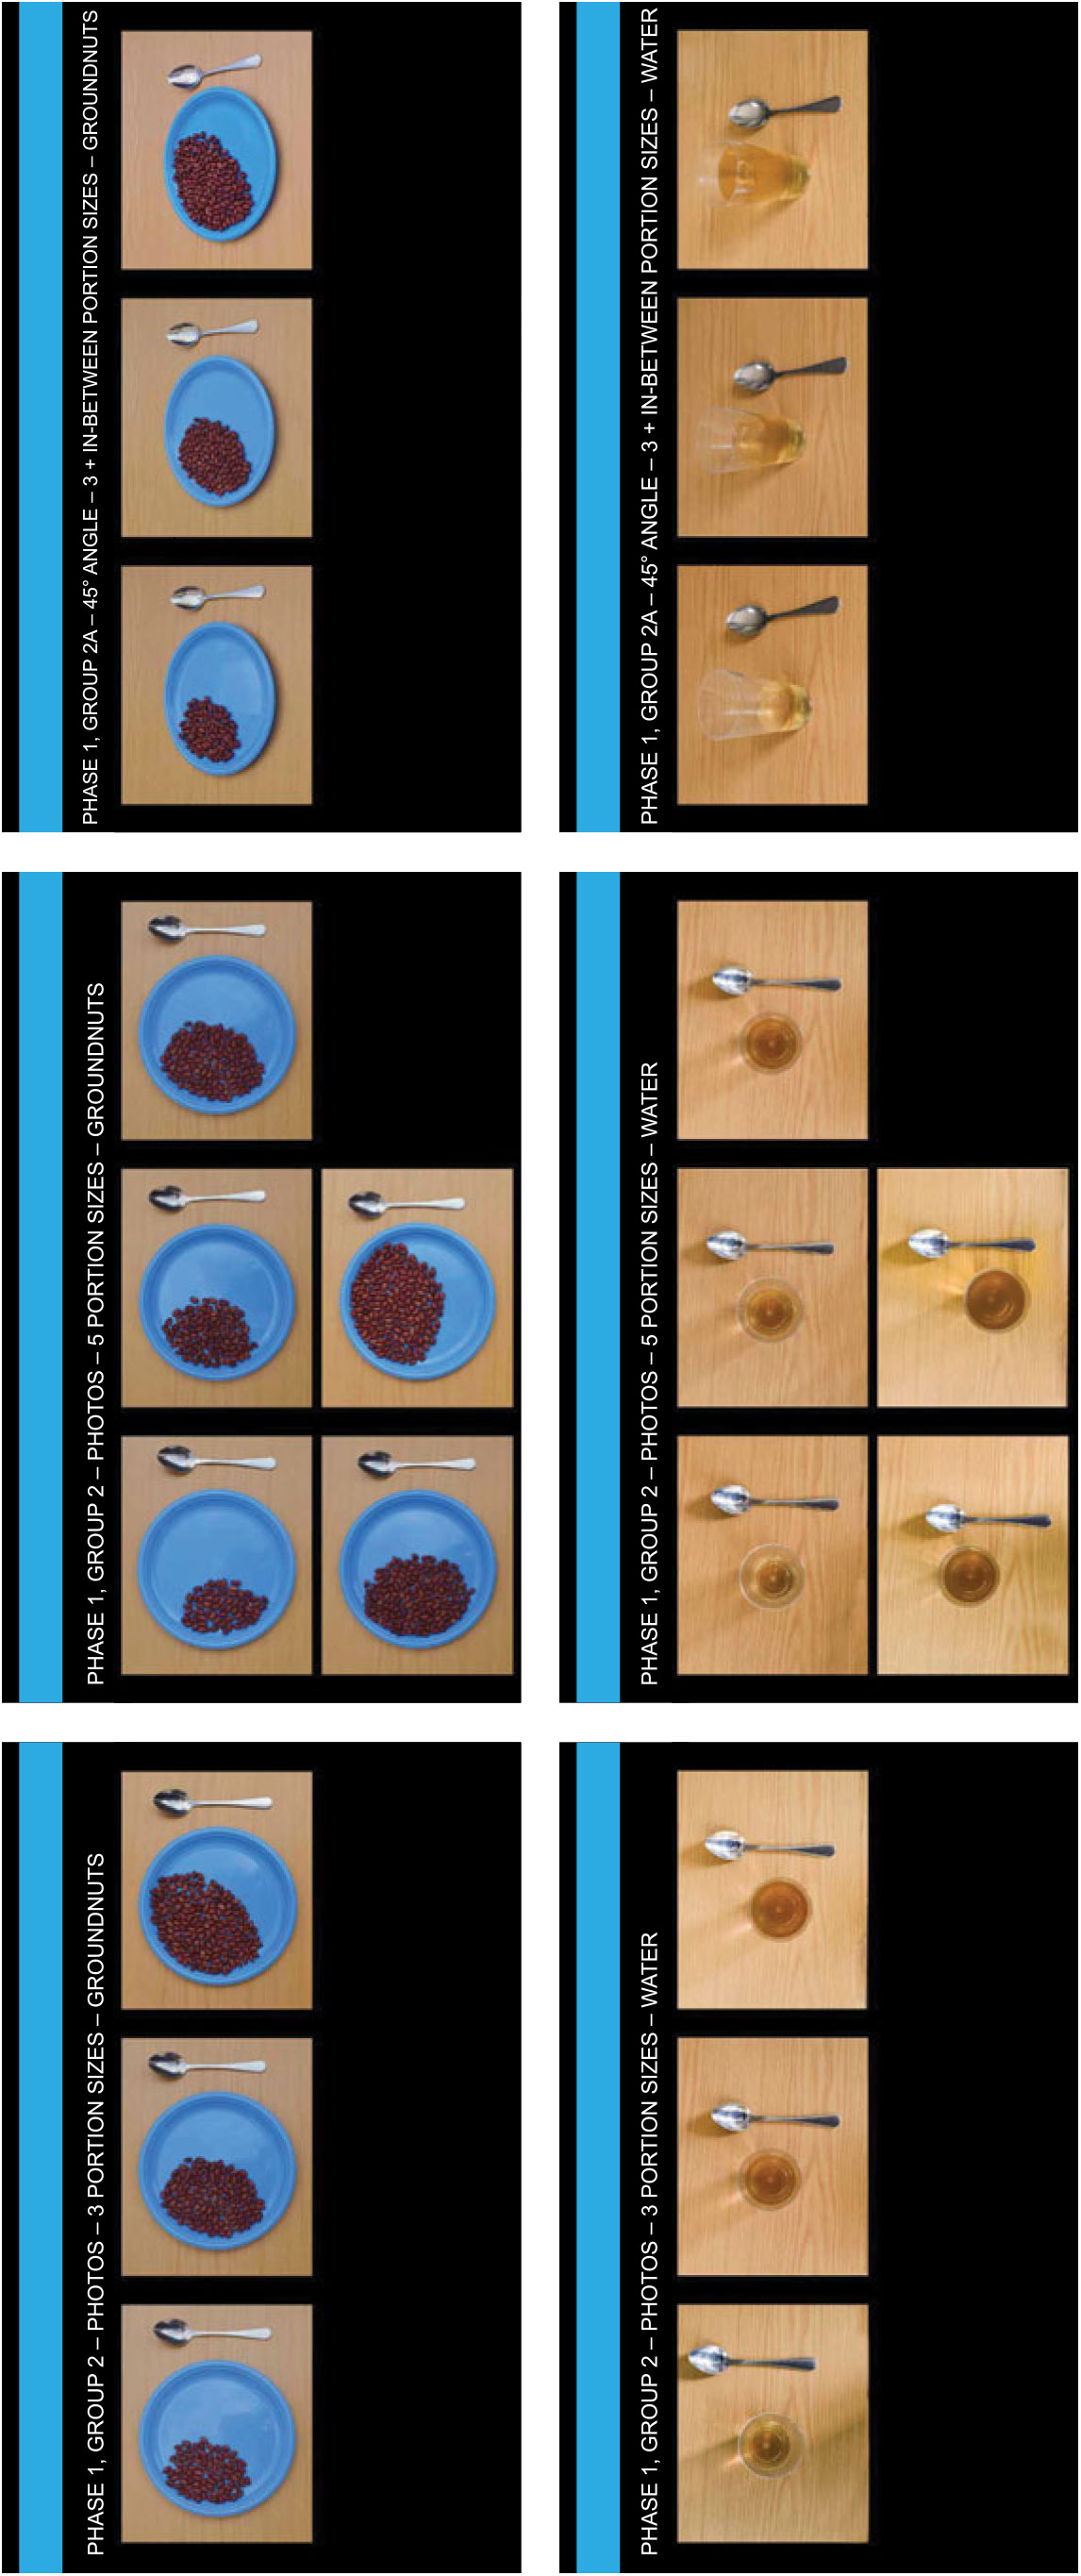
Fig. 2 Photographs of groundnuts and water portion sizes
Shapes
The photographs were used to create the food shapes so that appropriate gram weights were associated with the food and water shape images. The graphic designer opened each photograph in Adobe Photoshop and used the pen tool to trace around the spoon and the shape of the food and the ellipse tool to make a circle the same size as the plate. The shapes were filled in with different colours. The final shape images were the same size as the photographs to ensure image size was consistent throughout the PSEA evaluation (Fig. 3).
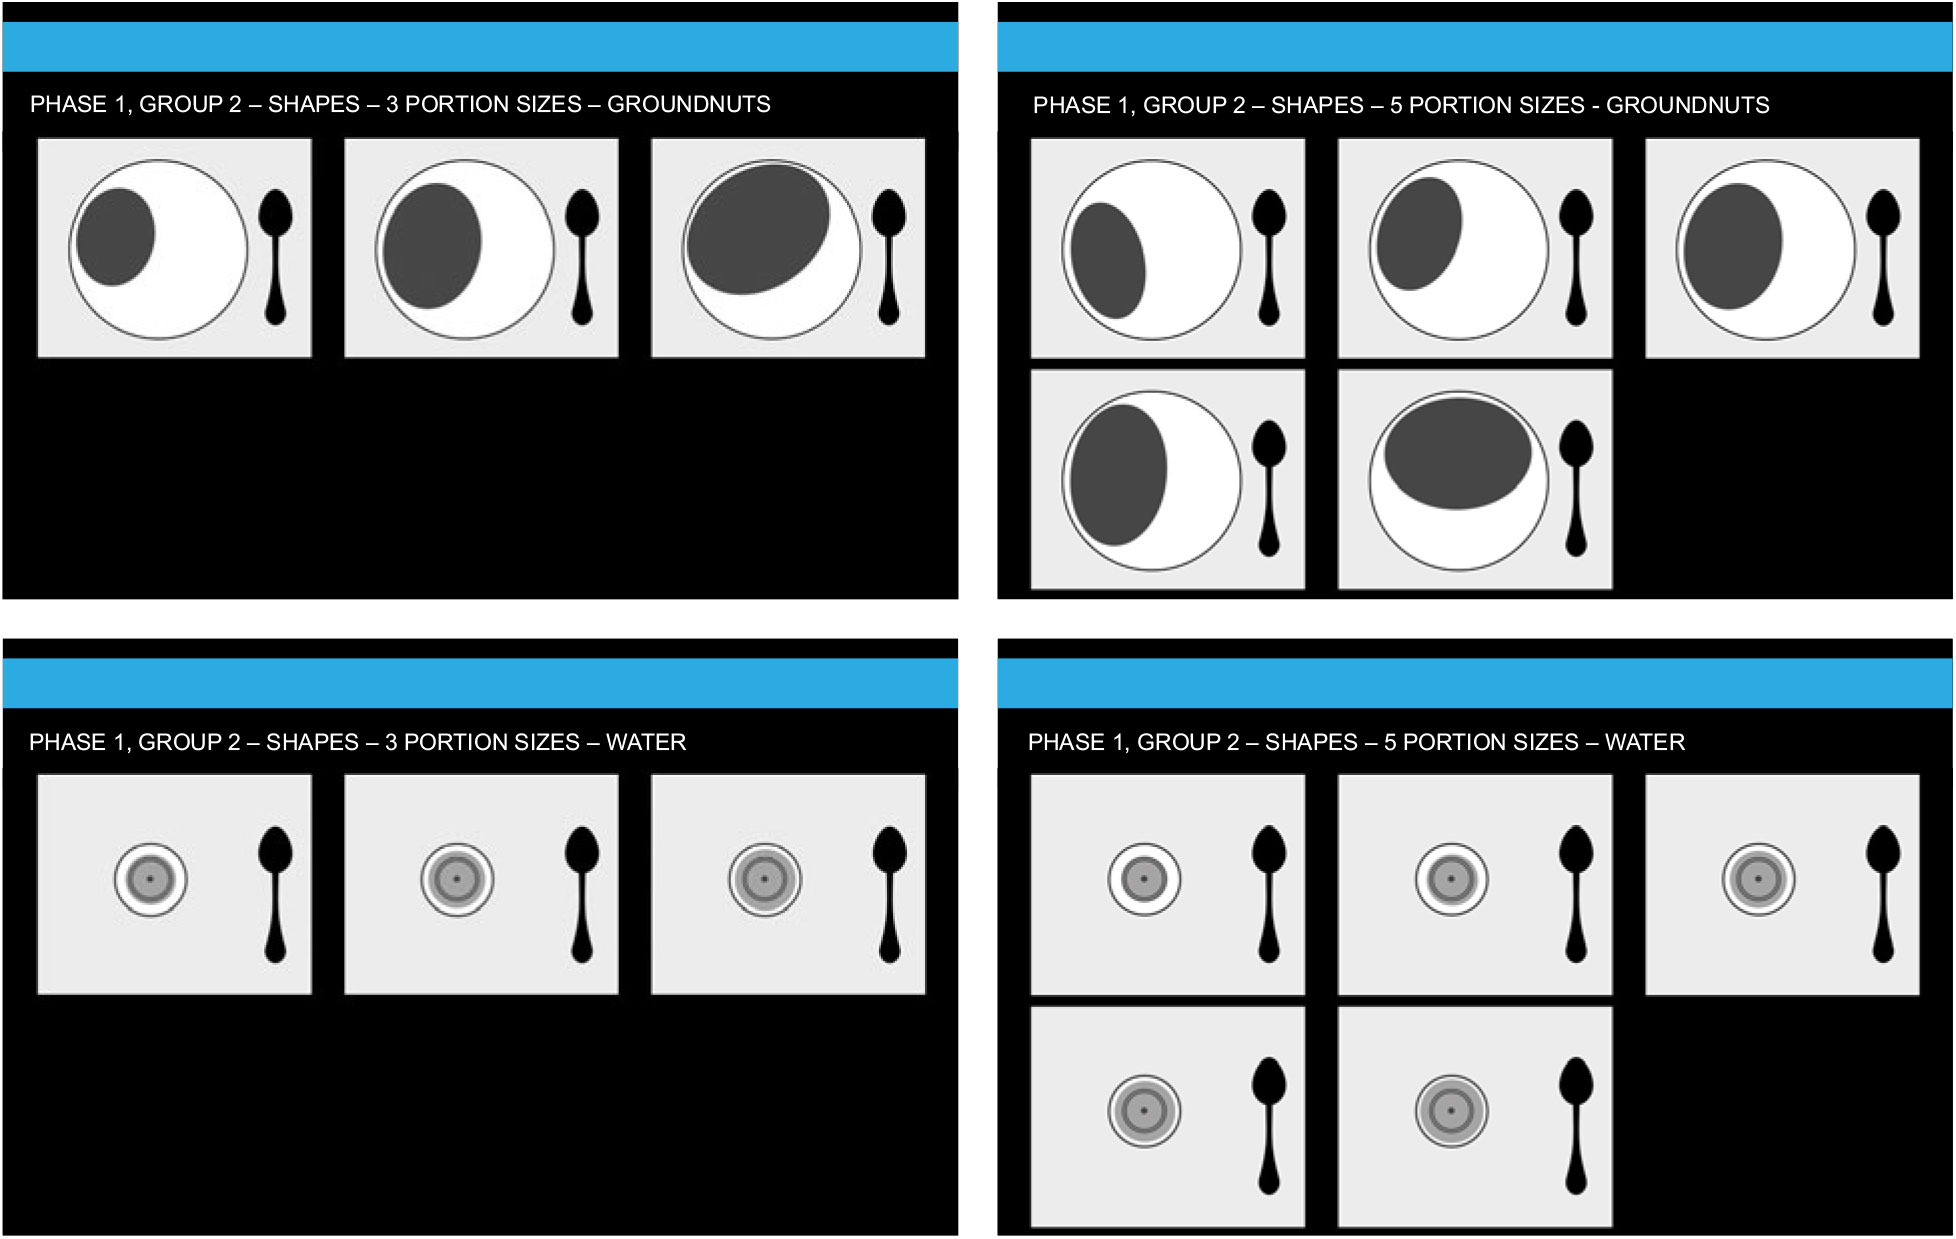
Fig. 3 Shapes of groundnuts and water portion sizes
Photographic atlas
We compiled all photographic and shape series into separate printed atlases according to the visual characteristics that we tested. The same files used in the printed atlases were loaded on tablets to serve as the digital PSEA.
Data analysis
We originally developed the data collection tools in English, then translated them into Chichewa. Data collectors used paper forms to collect quantitative information and to take notes on the answers to open-ended questions. Data were entered into an electronic database. Interviews were recorded with participant consent, transcribed verbatim in Chichewa and translated to English.
We analysed quantitative data after data collection for each pair of groups (Fig. 1) to inform which characteristic(s) would be incorporated into the PSEA for the next pair. We tabulated responses from closed-ended questions in the exit interview. For each participant, we calculated the difference in grams between the selected portion-size estimation image and the grams of food or water consumed. We then calculated the percentage of portion-size selections that were within 20 % of the actual gram weight of food or water consumed to determine the potential accuracy of the different sets of portion-size estimation images(Reference Godwin, Chambers and Cleveland25). As a supplemental analysis, we further assessed accuracy of portion-size estimations by calculating the percentage of image selections that were ‘correct’, defined as the closest image in terms of gram weight to the actual gram weight of the food or water consumed. We used the statistical software package Stata version 13.0 to analyse sociodemographic characteristics and portion-size accuracy and Microsoft Excel (2016) to tabulate answers to closed-ended questions.
After data collection was completed, we used interview transcripts from a subset of participants to develop a qualitative codebook. The transcripts were entered into Dedoose version 7.0.23 (SocioCultural Research Consultants LLC, Los Angeles, CA, USA) and coded for key themes using thematic content analysis(Reference Gibbs26,Reference Patton27) . To ensure inter-coder reliability, we double-coded 10 % of the data and discussed and re-coded any discrepancies. Coded data were entered into a matrix in which demographic characteristics and themes were columns of the matrix and ID numbers were listed in the rows. Quotes representing individuals’ responses related to each theme were placed in the cells(Reference Miles and Huberman28).
We did not analyse results by PSEA format (i.e. digital or print) because participants used only one; thus, the results are not directly comparable. Our intent in using digital PSEA in Phase 1 was to determine if they are feasible to use in field conditions. We did not conduct sub-analyses on quantitative results by participant characteristics because of the small study group sample sizes. We did, however, analyse qualitative data according to urban or rural location; differences in results are noted where applicable.
Results
We obtained data from questionnaires for all ninety-six participants. We planned to record and transcribe all interviews to have greater detail about the conversations between interviewers and participants than could be captured on the data collection forms. We completed recordings of sixty-one interviews. Thirty-five women (36 %) did not consent to be recorded because of a rumour, not related to the study, that was circulating in communities during data collection. Although there were some differences between these women and those who did consent to be recorded in average years of education, literacy, mobile phone ownership and frequency of watching television, their meal recall information and responses to closed-ended questions were captured and included in the analysis, and their responses to open-ended questions were reviewed from the paper forms.
Participant characteristics
Table 2 provides sociodemographic characteristics of the participants and Table 3 shows their degree of technology exposure(20). We intended for half the participants in each group to have ≤4 years of education and half to have >4 years of education to better understand the influence that level of education could have on accurate portion-size selection. However, 72 % of the final sample had a higher level of education; most of these participants were in Groups 3 through 6. Participants’ technology exposure was generally similar across all groups; however, more participants in Groups 1 through 4 used smartphones daily, and more participants in Groups 5 and 6 reported never watching television.
Table 2 Characteristics of the women aged 18–45 years who participated in the formative evaluation of portion-size estimation aids in Malawi (n 96), August–October 2017
* Household asset questions were derived from the Malawi Demographic and Health Survey 2010. The scores shown here are the average number of assets participant households owned out of twelve items.
† Data missing for one participant.
Table 3 Technology exposure of the women aged 18–45 years who participated in the formative evaluation of portion-size estimation aids in Malawi (n 96), August–October 2017
Portion-size selections and grams consumed
We obtained 1848 portion-size selections across all foods/water based on the number of participants who consumed the foods and water and how many portion-size selections they made for each food according to their study group and the visual characteristics they were evaluating. Only 12 % (134/1110) of the portion-size selections made by women in Groups 1 and 2 were for virtual portion-size options. The most frequently selected virtual portion-size option was for smaller than small and mainly for nsima and bean stew. The online supplementary material, Supplemental Table S2 shows the average of grams consumed of each food and water overall and by study group and how many participants from each group did not consume a food or water.
Ease of use
Overall, participants found photographs, three and five portion sizes, a 45° angle and simultaneous presentation to be the easiest to use (Fig. 4).
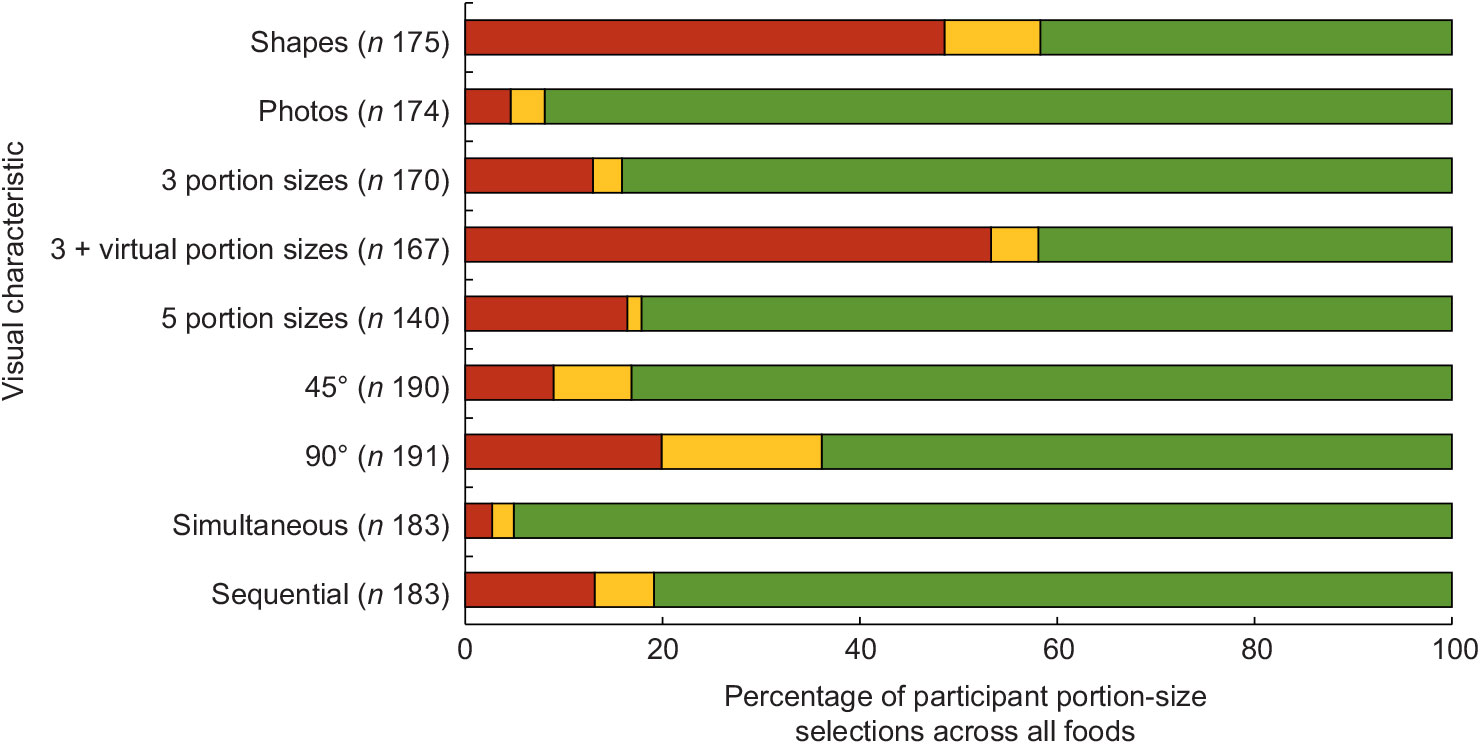
Fig. 4 Perceptions of ease of use (![]() , difficult or very difficult;
, difficult or very difficult; ![]() , neither;
, neither; ![]() , easy or very easy) for visual variables among ninety-six women aged 18–45 years who participated in the formative evaluation of portion-size estimation aids in Malawi, August–October 2017. n represents the total number of responses for all foods from participants who consumed that food and did not have data missing. We did not have any responses for bananas with five portion sizes because we did not include those images
, easy or very easy) for visual variables among ninety-six women aged 18–45 years who participated in the formative evaluation of portion-size estimation aids in Malawi, August–October 2017. n represents the total number of responses for all foods from participants who consumed that food and did not have data missing. We did not have any responses for bananas with five portion sizes because we did not include those images
Participants found shapes difficult to use because they had trouble conceptualizing the shape as representing food and then translating that to an amount of food they had eaten; conversely, participants found the photographs easy to use because the foods and amounts were ‘easy to see’:
‘It was difficult since I could not see the amount clearly. It looks like a moulded clay.’ (Participant with lower education in urban area)
Three with virtual portion-size options was difficult for participants because the virtual portion-size options were not visible, and they had a hard time imagining if the virtual options really aligned with the portion size they consumed:
‘It was difficult [to select a portion size] because I was not sure the hidden portion sizes were really like the ones I ate.’ (Participant with lower education in urban area)
Data collectors had to explain the virtual portion sizes at least twice to a few participants, demonstrating the participants’ difficulty understanding the virtual portion-size option concept.
Interviewer: ‘I have told you that in this group we are talking of three groups and others, which means that it’s not this or this but in between.’
Respondent: ‘Let’s stop there first. Can you explain to me clearly what you really mean here? Tell me in good Chichewa.’ (Participant with higher education in urban area)
Participants also struggled with the shape images and photographs of water displayed at 90° because they had trouble discerning the level of water in the tumbler and thus the size of the portion.
Participants found the sequential image presentation difficult because it was hard to remember each of the options when they were presented one at a time. A few participants had to go through the options several times before selecting a portion size:
‘Mmm! It is difficult to remember because you have to see the pictures on different pages and keep it in mind, then choose the one representing your food.’ (Participant with higher education in urban area)
Conversely, participants said the simultaneous images were easier to use because they could differentiate between the portion-size options and then select one while seeing them all at the same time.
Preference
In many cases, the reasons participants preferred one visual characteristic over the other were similar to their responses about ease of use (Table 4). All participants across Groups 1 and 2 preferred photographs to shapes because they said it was easier to understand the amount of food in each photograph and because seeing the actual food rather than an abstract representation helped them remember how much they ate. Shapes were least preferred by participants because they were ‘difficult to see’, confusing, and did not give the ‘true meaning’ of the food and the portion sizes:
‘[I preferred photographs] because I was looking at the actual picture. I was able to see the real and clear quantity of the food on the plate. The shapes did not provide a clear picture.’ (Participant with lower education from rural area)
Table 4 Preferences for visual characteristics among the women aged 18–45 years who participated in the formative evaluation of portion-size estimation aids in Malawi, August–October 2017
n represents the number of participants (out of thirty-two) who tested that visual characteristic and provided data on their preferences.
Groups 1 and 2 were approximately evenly divided in their preference for three or five portion sizes. Only a few participants preferred three photographs with virtual options. Those who preferred the three portion-size options said it was because they felt the portion sizes were adequate to capture typical portions of that food and because having fewer options made it easier to choose. Those who preferred five portion sizes said it was because there were more options from which to choose; conversely, other participants cited too many options as a reason why they least preferred the five portion-size options:
‘[Three portions] showed the portion sizes which were the same as the food I ate, hence it was easy to select the amount that I ate. And since the portions were few, there was no confusion in choosing the portion size which looked like what I ate.’ (Participant with higher education in urban area)
Almost all participants across Groups 3 and 4 preferred 45° angle photographs, mainly because the ‘proper positioning’ of the plates made it easier to see the foods and the amounts in each photograph:
‘[I preferred 45° photographs because] 45° helped me to recall what I ate, because the plates were placed rightly.’ (Participant with higher education in rural area)
Almost all participants across Groups 5 and 6 preferred simultaneous presentation because it was easier to remember what the options were, whereas the sequential presentation required more time and mental effort when selecting a portion size.
Portion-size appropriateness
Overall, approximately half to three-quarters of participants found the portion-size options in the PSEA for each food to be an appropriate amount according to how much of that food they typically eat at home (Fig. 5). Across groups and foods, many participants reported it was easier to select a portion size of food or water when they felt that the portion size they actually consumed was represented as an option to select (more so urban):
‘It was easy [selecting a portion size] because the nsima I had is the same as I see in the picture.’ (Participant with lower education in urban area)
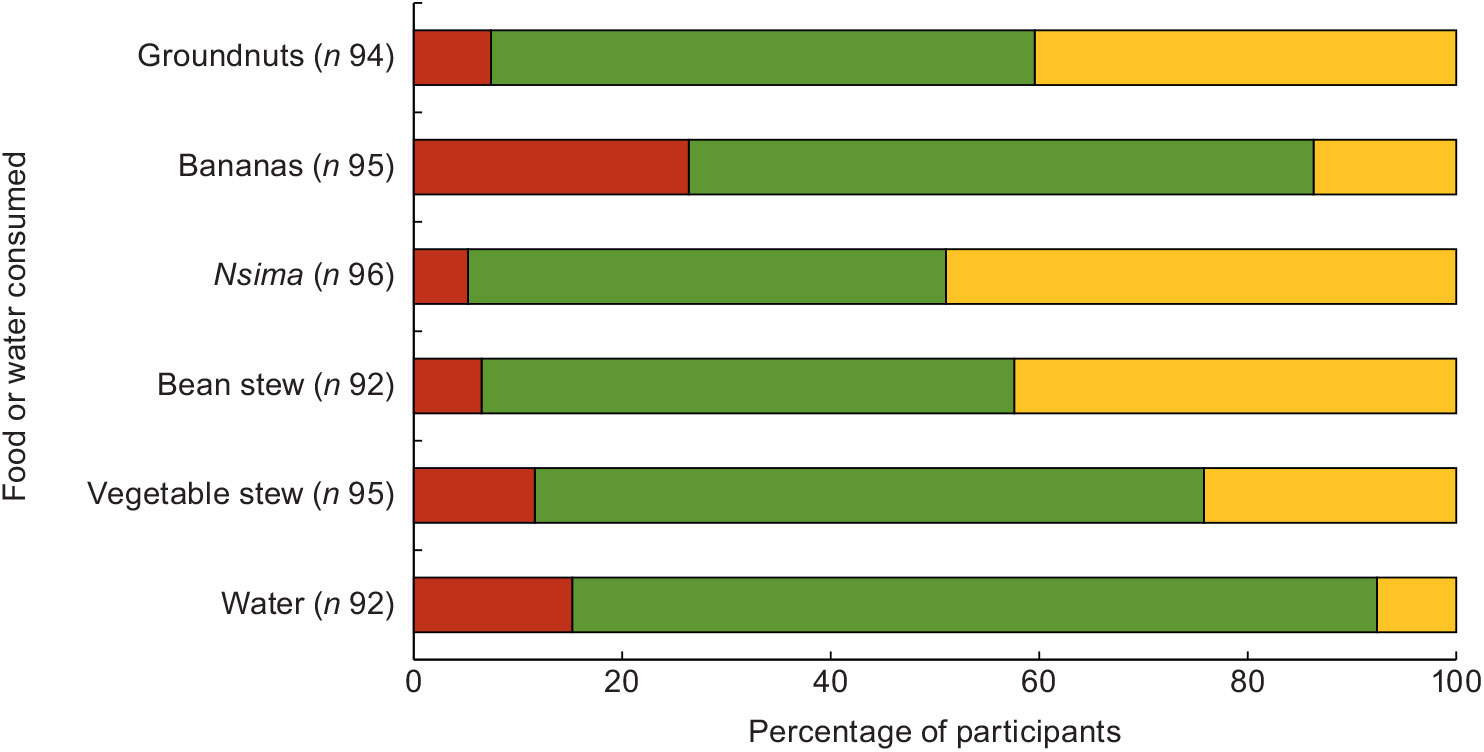
Fig. 5 Perceptions of portion-size appropriateness (![]() , portion-size options are too small;
, portion-size options are too small; ![]() , portion-size options are the right amount;
, portion-size options are the right amount; ![]() , portion-size options are too big) among ninety-six women aged 18–45 years who participated in the formative evaluation of portion-size estimation aids in Malawi, August–October 2017. n represents the number of participants who consumed that food and did not have data missing
, portion-size options are too big) among ninety-six women aged 18–45 years who participated in the formative evaluation of portion-size estimation aids in Malawi, August–October 2017. n represents the number of participants who consumed that food and did not have data missing
Conversely, a few urban participants noted that selecting a portion size during the meal recall was more difficult when they felt that the portion size they consumed was not represented in the PSEA:
‘It was difficult to recall only what I ate, because there was no picture which had the exact [amount of] food I ate.’ (Participant with higher education from urban area)
When making portion-size selections during the meal recall, just under half of the participants indicated they were thinking about nsima in terms of the number of pieces they had eaten rather than the total amount as displayed in the PSEA images.
Interviewer: ‘How about the quantity of nsima that you ate in comparison to these pictures?’
Participant: ‘I only had two pieces, and there is no two pieces here.’
Interviewer: ‘I am not referring to the piece, but I want to know how much you did eat?’
Participant: ‘Oh you mean that. It was like this [pointing to portion-size image].’ (Participant with lower education in rural area)
Accuracy
Overall, shapes with five portion sizes and photographs with three portion sizes tied for the highest level of accuracy (29 %) among the presentation choices (Fig. 6) when accuracy was defined as estimation within 20 % of actual consumption, even though photographs were universally preferred to shapes and considered easier to use. A 45° v. 90° photograph angle and simultaneous v. sequential presentation of images resulted in more accurate estimation of quantity consumed (37 v. 33 % for 45° v. 90° angle; 41 v. 31 % for simultaneous v. sequential). None of the approaches resulted in a very high degree of accuracy of estimations. The percentages of portion-size image selections that were closest to the actual gram weight consumed (see online supplementary material, Supplemental Fig. S1, percentage of participant portion-size selections with the correct image selection) indicate that three portion sizes using photographs, a 45° photograph angle and simultaneous presentation of images were more accurate than other options.
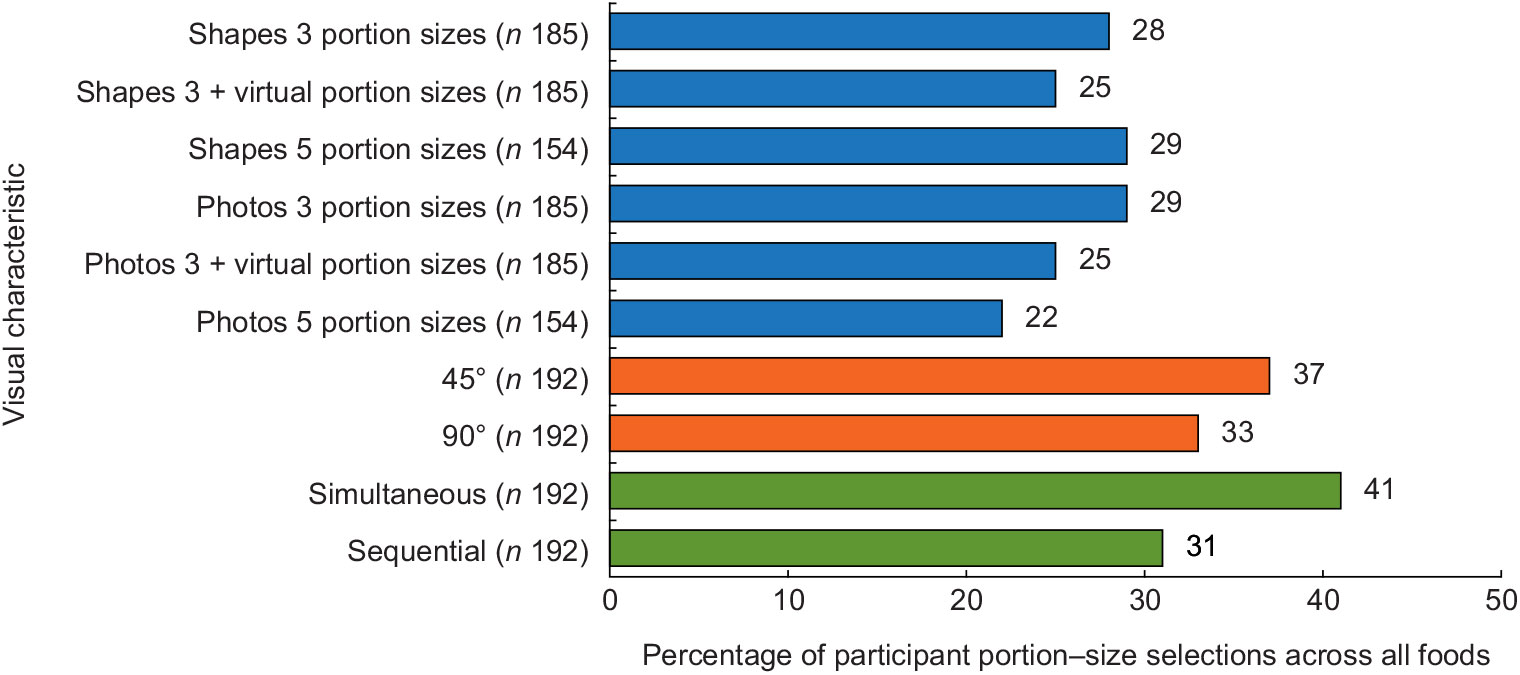
Fig. 6 Percentage of portion-size selections within 20 % of actual gram weight consumed for ninety-six women aged 18–45 years who participated in the formative evaluation of portion-size estimation aids in Malawi, August–October 2017. n represents the total number of responses for all foods from participants who consumed that food and did not have data missing. We did not have any responses for bananas with five portion sizes because we did not include those images
Cross-cutting findings
About one-third of participants (more so urban) indicated the meal recall process itself was difficult, either because they had to be reminded of the question being asked or how to use the PSEA or because they said they were not used to paying attention to or thinking about how much they eat.
Interviewer: ‘I will start with pictures of groundnuts taken at a 45° angle. Among these pictures, which one shows the amount of groundnuts you ate?’
Participant: ‘The groundnuts I ate today?’
Interviewer: ‘Yes.’
Participant: ‘I should point at one picture?’
Interviewer: ‘Yes, the picture which shows the amount of groundnuts you ate.’ – (Participant with higher education from rural area)
‘Mmh. We just eat these things. We don’t know the measurements.’ (Participant with lower education in rural area)
In contrast, just less than half of participants said selecting a portion size was easy because they knew what they had eaten:
‘It was easy [to select a portion size] because I am the one who ate it, and it cannot be difficult to recall the amount I ate.’ (Participant with higher education in urban area)
The split in these sentiments and their explanations also apply to participants’ perceptions of how difficult it was for some to account for leftover food, if they had any, when selecting their portion size. Some participants verbally considered their leftovers when selecting portion size, which may have made accurately selecting their portion size easier:
‘I drank like that [portion size] because I left some.’ (Participant with higher education in rural area)
A few participants spontaneously said selecting a portion size was easier when they did not eat that much or have any leftovers.
Discussion
We investigated preferences for and ease-of-use perceptions of several visual characteristics in photographic PSEA and documented the accuracy of portion-size selections using PSEA against a measured quantity of food. Overall, participant preferences and ease-of-use perceptions favoured photographs compared with line drawings of shapes, three and five portion sizes compared with three with four virtual portion sizes, a 45° photograph angle compared with a 90° angle, and simultaneous compared with sequential presentation. Accuracy results align with participant preferences and ease-of-use perceptions; analysis of the percentage of image selections that were ‘correct’ confirmed three portion sizes as the most accurate compared with the five or three with four virtual portion-size options. Many participants, however, seemed to struggle with the recall process itself. In addition to accuracy, participant preferences and experiences are important to consider when developing PSEA because they can help facilitate better concentration and engagement during what can be long interviews(Reference Nelson and Haraldsdottir5).
To our knowledge, the present study is the first that evaluated visual characteristics before validating photographic PSEA in a low-resource setting. A few studies have done this in high-income countries, and our results align with previous work in Taiwan and the USA showing colour photographs were more accurate and better comprehended by participants than black and white sketches(Reference Liu, Chiu and Lin19) and a simultaneous image presentation was more accurate and preferred by participants than a sequential approach(Reference Subar, Crafts and Zimmerman15). While Vereecken and colleagues(Reference Vereecken, Dohogne and Covents17) explored simultaneous v. sequential image presentation in Belgium, the methodology did not allow for direct comparison between the two approaches because they were tested with different foods and image sizes. Baranowski et al. (Reference Baranowski, Baranowski and Watson16) also evaluated simultaneous v. sequential image presentation with children in the USA but found no significant differences in accuracy between the two.
Results from a validation study in Italy showed that for colour photographs of three with four virtual portion sizes taken at a 45° angle and shown simultaneously, participants found the images were clear and attractive to look at during a long interview and showed the appropriate number of portion-size options(Reference Turconi, Guarcello and Berzolari29). Their finding regarding three with virtual portion-size options is contrary to results from the present study, where three with four virtual options was the least preferred and most difficult for participants to use. Our results also differ from those of Subar et al. (Reference Subar, Crafts and Zimmerman15) for number of portion-size options and photograph angle. Subar et al. found that American adults tended to be more accurate using a higher number of portion-size options (although not statistically significant) and generally preferred an aerial over an angled photograph, while we found a smaller number of portion sizes to be accurate and a 45° angle was more accurate and preferred compared with a 90° angle. Venter et al. also used three with four virtual portion-size options when testing their food photographic atlas for accuracy with South African adults; however, unlike in our study, no participants selected a virtual portion size(Reference Venter, MacIntyre and Vorster14). These varied results between different populations suggest that, for at least some visual characteristics, cultural differences should be considered when developing photographic PSEA images for use in different settings.
In our study, the five portion-size options were slightly more preferred than the three portion-size options but were slightly more difficult to use and less accurate. The presentation with the most options (i.e. three with four virtual options) was by far the least preferred, most difficult to use and least accurate. When Subar et al. (Reference Subar, Crafts and Zimmerman15) found a divergence between participants’ perceptions and accuracy, the research team went forward with what was more accurate, which is also the approach we took in the present study. Furthermore, the analysis of the percentage of image selections that were ‘correct’ resulted in greater accuracy than the percentage of portion-size selections that were within 20 % of the actual gram weight of food or water consumed. This is not surprising because when participants self-serve a portion of food, they can consume a quantity of food that is not within 20 % of the gram weight of food or water shown in the portion-size estimation image.
We studied shapes v. photographs because each shape could potentially represent multiple foods or drinks (the idea of ‘equivalent foods’(Reference Nelson and Haraldsdottir5)), thus reducing the number of images that would need to be included in a PSEA and the time and resources needed to produce it. Our participants’ preferences and ease-of-use perceptions regarding shapes indicate using shapes would not be acceptable for this population. This challenge with conceptualization would also likely apply if ‘equivalent foods’ were displayed via photograph rather than shapes (e.g. showing a picture of groundnuts to represent kidney beans). Furthermore, shapes or ‘equivalent food’ images would not necessarily be more efficient to develop than photographs of actual foods because researchers would still need to ensure that the correct gram weights of different foods are associated with each image.
While our study was particularly interested in photographic PSEA that could be shown digitally as part of a tablet-based dietary intake data collection system, different PSEA and methods (e.g. salt replicas or actual foods, food models, household measures, actual-size photographs) may be more appropriate for some foods than others(Reference Kirkpatrick, Potischman and Dodd12,Reference Godwin, Chambers and Cleveland30–Reference Faulkner, Livingstone and Pourshahidi33) . Similarly, the number of portion-size options may not need to be uniform across foods(Reference Lazarte, Encinas and Alegre3,Reference Al Marzooqi, Burke and Al Ghazali34) . However, varying the PSEA and numbers of portion sizes between foods might add another element of cognitive burden on participants if they are constantly readjusting throughout the recall, although our participants did not mention this with regard to not having five portion-size options for bananas. Using a tablet to show participants portion-size options is likely to be physically and logistically easier in a low-resource setting than having data collectors carrying a variety of PSEA with them to communities. Moreover, other research is underway on a variety of technologically advanced dietary intake data collection and portion-size estimation methods. A recent review found only computer- and tablet-based programs to be feasible in low-income countries out of six different categories of technologies(Reference Bell, Colaiezzi and Prata35). In our study, use of tablets for portion-size estimation was also feasible based on participants’ willingness and ability to use the tablets to view portion-size images as well as the logistical success of using them in the field (e.g. tablets not breaking, battery lasting long enough, solar chargers as a tool for charging tablets in a setting with unreliable electricity). With research demonstrating tablets to be a feasible tool for collecting dietary intake data, we believe optimizing digitally displayed photographic PSEA is a worthwhile pursuit to leverage an innovative solution.
The present study has some limitations. Our results for the accuracy of portion-size selections using different visual characteristics are based on a small sample size selected to achieve saturation for the qualitative analysis and thus should be interpreted with caution. Our validation study(Reference Flax, Thakwalakwa and Schnefke36) with a sample size large enough for more robust statistical analysis considers accuracy results for the PSEA developed from this formative research. Our sample also represents a single cultural context; therefore, results are not universally generalizable. We were unable to analyse data for any differences according to participants’ level of education as originally intended because of difficulties in recruiting participants with lower levels of education. Just over one-third of our sample did not consent to being recorded; thus, we could not analyse their transcripts but we were able to use the data from their questionnaires in analyses. Participants in Groups 1 and 2 were asked to recall their portions using six different sets of images and the number of portion-size options was not randomized, so fatigue may have played a role in their selections and exit interview answers. Finally, some participants indicated they ate more food than they usually do, perhaps because the food was provided ad libitum, which could have affected their meal recall process and perceptions.
Conclusion
Correctly recalling the portions of foods and drinks previously eaten is a challenge in dietary intake data collection. Optimizing the specific characteristics of PSEA visual presentation can help improve participants’ experiences during meal recalls and has the potential to improve accuracy of portion-size selections. The results of the present formative evaluation and the validation study(Reference Flax, Thakwalakwa and Schnefke36) can inform the development of PSEA for dietary intake data collection in low-resource settings, improvements that could better inform nutrition policies and programmes around the world. The present research indicates that further work is needed to test variations in visual presentation of PSEA on a wider variety of foods and in other geographical and cultural contexts.
Acknowledgements
Acknowledgements: The authors would like to acknowledge photographers Fletcher Gong’a and John Theilgard for their assistance with taking and editing the food and water photographs; Tayo Jolaoso for his work to create the shape images from the food photographs and prepare the images for the tablet application; Steve Litavecz for his assistance with programming the images/tablets; Denview Magalasi and Austrida Gondwe for their research assistance; Cathleen Prata, Zachary Gersten and Rosalind Gibson of the International Dietary Data Expansion (INDDEX) Project for their collaboration; the Malawian data collectors for their work to collect data and transcribe interviews; and Malawian community members for assistance with food preparation. Financial support: This work was supported by RTI International. RTI International funders had no role in the design, analysis or writing of this article. Conflict of interest: The authors have no conflicts of interest to declare. Authorship: V.L.F., M.K.M., J.C. and B.R. conceptualized the study and research questions and designed the study. C.H.S., B.C., W.B. and C.T. also contributed to the study design. C.T. oversaw data collection. C.H.S. conducted quantitative and qualitative data analysis with V.L.F. and input from M.K.M., and prepared the first draft of the manuscript. All authors read and approved the final manuscript. Ethics of human subject participation: This study was conducted according to the guidelines laid down in the Declaration of Helsinki and all procedures involving human subjects were approved by the University of Malawi College of Medicine Research and Ethics Committee and the RTI International Institutional Review Board. Written or thumb-printed informed consent was obtained from all subjects prior to data collection activities.
Supplementary material
To view supplementary material for this article, please visit https://doi.org/10.1017/S1368980019001733
Author ORCIDs
Courtney H Schnefke,0000-0003-0181-1502. Mary K Muth,0000-0001-7879-0469. John Phuka,0000-0003-4951-8145. Valerie L Flax,0000-0003-0200-3355.


