


Food-based dietary guidelines (FBDG) have been developed(1) and used internationally to express the principles of a balanced diet in terms of foods(Reference Kersting, Alexy and Clausen2–Reference Moschandreas and Kafatos7). In Belgium, a food triangle and a food pyramid have been developed by the regional health authorities that are responsible for health promotion(8, Reference Absolonne, Sirjacobs and Guggenbühl9). Both guidelines are similar. The triangle/pyramid is composed of eight food groups: (i) water (including coffee, tea and broth); (ii) bread, cereals, grains and potatoes; (iii) vegetables; (iv) fruits; (v) dairy products (including calcium-enriched soya products and cheese); (vi) meat, fish, eggs, legumes, nuts and meat substitutes; (vii) spreadable fats; and (viii) energy-dense, nutrient-poor foods. Within the group of bread, cereals, grains and potatoes, two different guidelines are formulated: one for bread and cereals and a second guideline for grains and potatoes. The reason why this food group has been split into two separate groups is because in Belgium, potatoes are usually consumed as part of a hot meal and thus practically can only be interchanged with pasta or rice, while bread and breakfast cereals are usually consumed as part of a cold meal and are consequently not interchanged with potatoes, pasta or rice in practice. Within the group of dairy products also, two recommendations are formulated because milk, including calcium-enriched soya products and cheese, is quantified differently. This means that for the eight food groups in the triangle, ten different FBDG are specified. These recommendations can be found elsewhere(8, Reference Vandevijvere, De Vriese and Huybrechts10).
The bigger the surface of a particular food group in the triangle, the larger the daily consumption of that food group should be relative to the other food groups. According to these FBDG, a healthy diet is based on variation, both among and between food groups, moderation and balance.
In 2005, a new model was developed that took into account the physical activity recommendation(11), while the dietary recommendations remained the same. According to this ‘active’ model, a person should perform at least half an hour of physical activity of at least moderate intensity on most if not all days of the week in parts of at least 10 min.
In 2004, the Ministry of Public Health, Environment and Food Safety initiated the first Belgian National Food Consumption Survey (BNFCS). The objective of the BNFCS was to monitor the nutritional adequacy of the food and nutrient intake within the Belgian population. These data are needed in the development of an evidence-based nutrition policy. A previous study has already assessed the compliance of the Belgian population with the FBDG(Reference Vandevijvere, De Vriese and Huybrechts10). It was found that food intake deviated significantly from the recommendations. In particular, fruit and vegetable consumption and intake of dairy, including calcium-enriched soya products, were inadequate. Consumption of energy-dense, nutrient-poor foods was excessive.
The objective of the present study was to assess the relationship(s) between complementary measures that assess different dimensions of the diet, such as overall and within-food group diversity, and several aspects of dietary quality, such as adequacy, moderation and balance, derived from FBDG in Belgium. The main purpose was to investigate whether persons consuming a more varied diet, both among and within food groups, comply better with the FBDG.
Design and methods
The design of the BNFCS followed to a large extent the recommendations of the European Food Consumption Survey Method project(Reference Brussaard, Johansson and Kearney12), which envisaged the formulation of recommendations to harmonize the methodology of data collection across Europe. The present study was conducted according to the guidelines laid down in the Declaration of Helsinki and all procedures involving human subjects were approved by the ethics committee of the Scientific Institute of Public Health. Written or verbal informed consent was obtained from all subjects. Verbal consent was witnessed and formally recorded. An in-depth description of the study design and the methodology used is given elsewhere(Reference De Vriese, Debacker and de Henauw13).
Study design
A representative sample of the Belgian population aged 15 years and above was randomly selected from the National Register. The sampling method followed a multistage stratified procedure. The participants were sampled in such a way that the population densities of the regions, the provinces and the municipalities were taken into account. For each selected individual, three individuals were selected beforehand who could serve as replacements in case the selected individual would not participate in the survey. They lived in the same statistical sector of the same municipality, in a household of the same size and were of the same age and gender. Institutionalized persons, individuals unable to speak one of the three national languages (Dutch, French or German) and individuals physically or mentally unable to be interviewed were excluded.
Participants were invited to take part in the study by a letter and leaflet. They were visited twice by a trained dietitian. At the first visit, the participants completed a face-to-face questionnaire about general health, lifestyle and physical activity. Physical activity was evaluated according to the International Physical Activity Questionnaire (IPAQ)(Reference Hagstromer, Oja and Sjostrom14).
Dietary assessment
Dietary intake was assessed using two non-consecutive 24 h recalls (2–8 weeks between both recalls) at the home of the participants. During the time between these two visits, the participants were asked to complete an FFQ. The dieticians checked the questionnaires for completeness. The 1-year survey was distributed equally over all seasons and days of the week. Data were collected in the year 2004–2005.
During the 24 h recall, the participants reported the types and quantities of all foods and beverages consumed during the preceding day. To obtain the standardized 24 h recall interviews, the validated software package EPIC-SOFT (International Agency for Research on Cancer, Lyon, France) was used, which is designed for uniform data collection in the ten countries participating in the European Prospective Investigation into Cancer and Nutrition(Reference Slimani and Valsta15).
The software enables very detailed descriptions and quantities of foods and supplements consumed and recipes used to be obtained in a standardized way. Quantification of the consumed foods is supported by a picture book that contains photographs of foods in different portion sizes.
Composite foods were disaggregated into their ingredients according to the information provided by the respondents or standard recipes. Food items were classified into food groups according to the FBDG as expressed in the Flemish food triangle(11). These guidelines are similar to the ones expressed in the Walloon food pyramid(Reference Absolonne, Sirjacobs and Guggenbühl9) and can consequently be used to evaluate Belgian food intake data. All foods and ingredients reported were assigned to the appropriate triangle group and the quantity of all food groups consumed was expressed in g/d. To allow comparison of portion sizes with the FBDG, the portion size of some reported foods had to be converted into an equivalent of another food using conversion factors, as proposed in the food guide(11).
Food groups used in the present study were the following: (i) water (including coffee, tea and broth); (ii) bread and cereals; (iii) grains and potatoes; (iv) vegetables; (v) fruits; (vi) dairy products (including calcium-enriched soya products; excluding cheese); (vii) cheese; (viii) meat, fish, eggs, legumes, nuts and meat substitutes; (ix) spreadable fats; and (x) energy-dense, nutrient-poor foods. As mentioned before (in the Introduction), the reason why the group of bread, cereals, grains and potatoes and the group of dairy products, including calcium-enriched soya products, were split into two separate groups is mainly due to practical reasons related to portion size estimation and food consumption habits. The group of energy-dense, nutrient-poor foods comprises alcohol, sugared drinks, sweet and salty snacks, sauces, cakes, sugar and confectionery. The FBDG for each of the above-mentioned food groups can be found elsewhere(Reference Vandevijvere, De Vriese and Huybrechts10, 11).
Based on the FBDG(Reference Vandevijvere, De Vriese and Huybrechts10, 11), food group-specific diversity, adequacy, moderation and balance scores were calculated for each subject. The FBDG specify a lower and upper recommended intake level for bread and cereals, grains and potatoes, dairy including calcium-enriched soya products and cheese; only an upper recommended intake level for meat, fish, eggs and meat substitutes, spreadable fats and energy-dense, nutrient-poor foods; and only a lower recommended intake level for liquids, fruits and vegetables.
The overall dietary diversity score was computed for each participant by summing the number of food groups from which at least one serving was consumed during the preceding day. Further, the average dietary diversity score was calculated as the mean diversity score over both interview days. The within-food group dietary diversity scores were computed by counting the number of different foods consumed during the preceding day within each food group. Further, the average within-dietary diversity scores were calculated as the mean scores over both interview days.
Aspects of dietary quality covered in this specific study were adequacy, moderation and balance. Dietary guidelines stress an adequate intake of elementary/nutritious foods such as fruit and vegetables, but also encourage moderation, especially in intakes of nutrient-poor energy-dense foods. A diet is in balance when an adequate but moderate intake of each element of the FBDG is reassured. Therefore, the dietary balance score is disaggregated into ‘adequacy’ and ‘moderation’.
The specific adequacy score, for each of the ten food groups, was computed by dividing the actual food intake by the lower limit of the recommended intake and multiplying the obtained value by 100, with a maximum score of 100 for each group. This means that the actual intake was truncated to the minimum recommended intake if this minimum recommended intake was exceeded. For the group of meat, fish, eggs, nuts, legumes and meat substitutes, the group of spreadable fats and the group of energy-dense, nutrient-poor foods, the adequacy score was set at 100 in all cases because FBDG only assign an upper limit of recommended intake and no lower limit. The specific adequacy scores of each food group were then summed and divided by the number of food groups (n 10) to calculate the overall adequacy score.
The specific moderation score for each of the ten food groups was computed by dividing the actual food intake by the upper limit of the recommended intake, multiplying the obtained value by 100 and subtracting 100.
Individuals consuming less than the upper recommended intake level were assigned a specific moderation score of 0. In case of excess consumption of a food group, the moderation score was truncated at 100 when exceeding 100. For the group of liquids, fruit and vegetables, the moderation score was set at 0 in all cases because the FBDG only assign a lower limit of recommended intake and no upper limit. The specific moderation scores of each group were summed and divided by the number of food groups (n 10) to calculate the overall moderation score.
The dietary balance score was calculated by subtracting the moderation score (measure for dietary excess) from the adequacy score. In this way, the dietary balance scores reflect how well a subject complies with the FBDG. A theoretical example of the calculation of the food group-specific adequacy, moderation and balance scores can be found in Table 1. Furthermore, the average dietary adequacy, moderation and balance scores were calculated as the mean scores over both interview days.
Table 1 A theoretical example of the calculation of the food group-specific dietary adequacy, moderation and balance scores
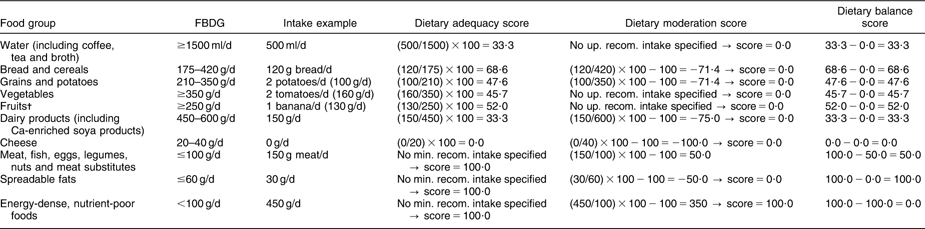
FBDG, food-based dietary guideline; min. recom. intake, minimum recommended intake; up. recom. intake, upper recommended intake.
†The recommended fruit intake for adolescents (15–18 years) is ≥375 g/d.
Other variables
Information on non-dietary variables such as education level, smoking behaviour and physical activity was obtained using a face-to-face questionnaire. The level of education was classified into four categories: (i) no education or up to grade 9; (ii) vocational or technical education; (iii) education up to grade 12; and (iv) education higher than grade 12. Smoking behaviour was classified into two categories: (i) no or former smoker and (ii) smoker. Following the IPAQ criteria, respondents were classified accordingly into three categories of physical activity: (i) inactive; (ii) minimally active; and (iii) active enough to experience health-enhancing effects. Health-enhancing physical activity means vigorous-intensity activity on at least 3 d of the week achieving a minimum total physical activity of at least 1500 MET-min/week, or ≥7 d of any combination of walking, moderate-intensity or vigorous-intensity activities achieving a minimum total physical activity of at least 3000 MET-min/week. MET are multiples of the resting metabolic rate and MET-min are equivalent to kilocalories for a person weighing 60 kg.
Body weight and height were collected during the dietary assessment and were self-reported. BMI was calculated as weight (kg) divided by the square of height (m2). The participants were classified into four categories: (i) underweight (BMI < 18·5 kg/m2), (ii) normal weight (BMI ≥ 18·5 to <25 kg/m2), (iii) overweight (BMI ≥ 25 to <30 kg/m2) and (iv) obese (BMI ≥ 30 kg/m2).
Statistical analysis
Only respondents with two completed 24 h recall interviews were included in the analyses. A total of 3083 participants completed two 24 h recalls of which 1537 were women and 1546 were men. The participants were categorized into four age groups: 15–18 (n 760), 19–59 (n 830), 60–74 (n 789) and 75 years or above (n 704).
Statistical analyses were performed using the STATA statistical software package version 10·1 (StataCorp, College Station, TX, USA). All analyses took into account the sampling design and were carried out with a precision of 95 %. All tests were two-sided. All analyses were stratified on gender.
The relationships between total dietary diversity and overall dietary adequacy/balance and associations between within-food group dietary diversity and overall dietary adequacy/balance were examined using multiple logistical regressions while controlling for age group, total energy intake, education level, physical activity level, smoking behaviour and BMI. Tests for checking the assumption of proportionality of odds were undertaken. Associations between within-food group dietary diversity and food group-specific dietary adequacy/balance scores were examined using Spearman’s rank correlations.
All analyses were performed both with and without taking into account the group of energy-dense, low-nutritious food group, as this group is not necessary in a healthy diet.
Results
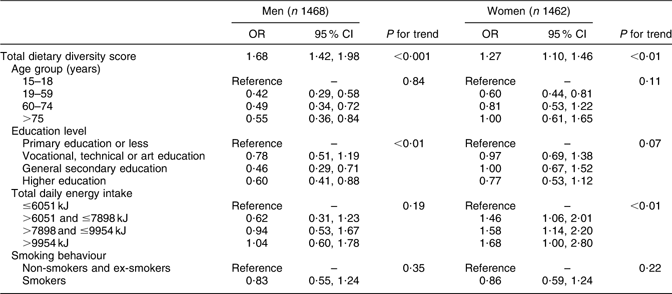
For both men and women, total dietary diversity score increased with age (P < 0·001). The association between dietary diversity and education level was not clear, but individuals who pursued higher education had a higher total dietary diversity score than those who completed only primary education or less (P < 0·01 for women and P = 0·058 for men). The total dietary diversity score was higher among non-smokers and former smokers, compared with smokers, for both men and women (P < 0·05 for men and P < 0·01 for women). No relationship could be found between dietary diversity and BMI or physical activity level (Table 2).
Table 2 Association between total dietary diversity score and different predictor variables (sex-specific OR and 95 % CI; Belgian National Food Consumption Survey 2004)
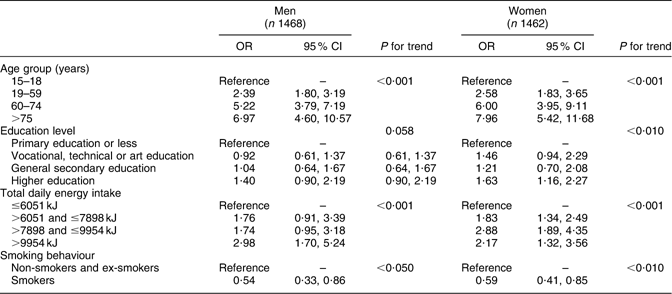
Tertiles of dietary diversity for men: low diversity (score: ≤7·5; n 576), moderate diversity (score: >7·5 and ≤8·5; n 477), high diversity (score: >8·5; n 415).
Tertiles of dietary diversity for women: low diversity (score: ≤7·5; n 498), moderate diversity (score: >7·5 and ≤8·5; n 531), high diversity (score: >8·5; n 433).
Approximate likelihood-ratio test of proportionality of OR: P = 0·63 (men) and P = 0·87 (women).
Seventy-eight men and seventy-five women were excluded due to missing values for smoking behaviour or education level.
Table 3 shows overall dietary adequacy, moderation and balance score and overall and within-food group dietary diversity scores according to tertiles of dietary diversity. Men and women in a higher tertile of total dietary diversity had significantly higher dietary adequacy, moderation and balance scores than those in the lower tertiles of dietary diversity (P < 0·001). Furthermore, men and women in a higher tertile of total dietary diversity also had significantly higher within-food group dietary diversity scores than those in the lower tertiles of total dietary diversity (P < 0·001).
Table 3 Overall dietary adequacy, moderation and balance score and overall and within-food group dietary diversity score according to tertiles of total dietary diversity and by sex (Belgian National Food Consumption Survey 2004)
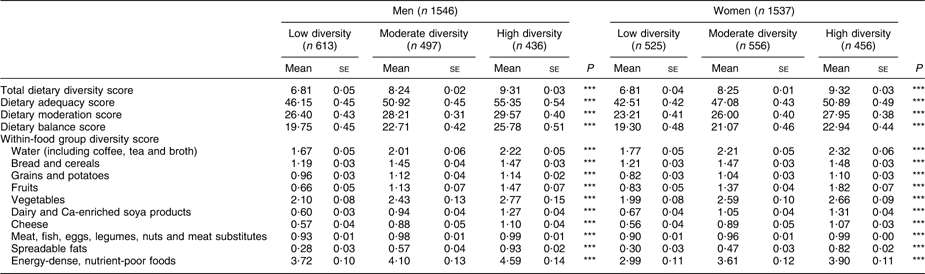
***P < 0·001.
Positive associations between within-food group dietary diversity and food group-specific dietary adequacy score were found for bread and cereals (P < 0·001), vegetables (P < 0·001), dairy and calcium-enriched soya products (P < 0·001), meat, fish, eggs, nuts, legumes and meat substitutes (P < 0·001), spreadable fats (P < 0·001) and energy-dense, nutrient-poor foods (P < 0·001) in both men and women (Table 4). The strongest positive associations between overall dietary adequacy and within-food group diversity (P < 0·001) were found for spreadable fats (OR = 7·12 (sd 1·78) for men and 5·04 (sd 0·91) for women) and dairy and calcium-enriched soya products (OR = 3·42 (sd 0·58) for men and 2·96 (sd 0·35) for women). The strongest negative association between overall dietary adequacy and within-food group diversity was found for energy-dense, nutrient-poor foods (OR = 0·82 (sd 0·04) for men (P < 0·001) and 0·85 (sd 0·04) for women (P < 0·001); data not shown).
Table 4 Spearman’s rank correlation (r) between the food group-specific dietary adequacy/dietary balance score and within-food group dietary diversity (same food group), by sex (Belgian National Food Consumption Survey 2004)
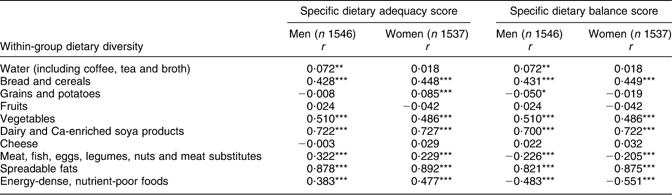
*P < 0·05; **P < 0·01; ***P < 0·001.
Positive associations between within-food group dietary diversity and food group-specific dietary balance score were found for bread and cereals (P < 0·001), vegetables (P < 0·001), dairy and calcium-enriched soya products (P < 0·001) and spreadable fats (P < 0·001) in both men and women. Inverse associations between within-food group dietary diversity and food group-specific dietary balance score were found for meat, fish, eggs, legumes, nuts and meat substitutes (P < 0·001) and energy-dense, nutrient-poor foods (P < 0·001; Table 4). The strongest positive associations between overall dietary balance and within-food group diversity (P < 0·001) were found for spreadable fats (OR = 3·77 (sd 0·75) for men and 3·28 (sd 0·57) for women) and dairy and calcium-enriched products (OR = 2·45 (sd 0·33) for men and 2·24 (sd 0·23) for women). The strongest negative associations between overall dietary balance and within-food group diversity (P < 0·001) were found for meat, fish, eggs, nuts, legumes and meat substitutes (OR = 0·27 (sd 0·17) for men and 0·41 (sd 0·17) for women), water (OR = 0·74 (sd 0·07) for men and 0·71 (sd 0·07) for women) and energy-dense, low-nutritious foods (OR = 0·75 (sd 0·03) for men and 0·69 (sd 0·04) for women; data not shown).
In both men and women, a significant positive association was found between overall dietary diversity and both overall dietary adequacy (P < 0·001) and balance (P < 0·001 and P < 0·01 for men and women, respectively), controlled for age, sex, energy intake and smoking behaviour (Tables 5 and 6).
Table 5 Association between overall dietary adequacy score and total dietary diversity score, adjusted for age, education level, energy intake and smoking behaviour (sex-specific OR and 95 % CI; Belgian National Food Consumption Survey 2004)

Tertiles of dietary adequacy in men: low adequacy (score: ≤44·50; n 373), moderate adequacy (score: >44·50 and ≤51·55; n 464), high adequacy (score: >51·55; n 631).
Tertiles of dietary adequacy in women: low adequacy (score: ≤44·50; n 589), moderate adequacy (score: >44·50 and ≤51·55; n 504), high adequacy (score: >51·55; n 369).
Approximate likelihood-ratio test of proportionality of OR: P = 0·56 (men) and P = 0·40 (women).
Seventy-eight men and seventy-five women were excluded due to missing values for smoking behaviour or education level.
Table 6 Association between overall dietary balance score and total dietary diversity score, adjusted for age, education level, energy intake and smoking behaviour (sex-specific OR and 95 % CI; Belgian National Food Consumption Survey 2004)
Tertiles of dietary balance in men: low balance (score: ≤18·84; n 439), moderate balance (score: >18·84 and ≤25·76; n 480), high balance (score: >25·76; n 549).
Tertiles of dietary balance in women: low balance (score: ≤18·84; n 530), moderate balance (score: >18·84 and ≤25·76; n 482), high balance (score: >25·76; n 450).
Approximate likelihood-ratio test of proportionality of OR: P = 0·57 (men) and P = 0·39 (women).
Seventy-eight men and seventy-five women were excluded due to missing values for smoking behaviour or education level.
When the total dietary diversity score was calculated without taking into account the group of energy-dense, low-nutritious foods, because intake of these products should be discouraged in a healthy diet, the coefficients changed only slightly and the interpretations of the results remained the same (data not shown).
Discussion
In general, dietary diversity increases with age. Other studies also found that dietary diversity is higher among older age groups(Reference Roberts, Hajduk and Howarth16, Reference Drewnowski, Henderson and Driscoll17). Anyway, it needs to be stressed that these studies used a different number of food groups and another method to calculate the diversity score.
The relationship between dietary diversity and education level is not clear and no relationship with BMI could be found. Some studies in diverse populations did find a correlation between dietary diversity and BMI(Reference Bernstein, Tucker and Ryan18–Reference Togo, Osler and Sorensen20).
Individuals classified in a group with a higher mean total dietary diversity score had higher overall scores for dietary adequacy, moderation and balance and a higher score for dietary diversity within all food groups. Consequently, they comply better with FBDG than individuals classified in a group with a lower mean total dietary diversity score.
Further, from the positive association found between overall dietary diversity and both overall dietary balance and adequacy, it follows that total dietary diversity could be a useful indicator of dietary quality in Belgium. Other studies from different populations and countries also found associations between overall dietary diversity and quality of the diet(Reference Roche, Creed-Kanashiro and Tuesta21–Reference Randall, Nichaman and Contant27). Nevertheless, a number of different groupings, classification systems and reference periods have been used. This limits the comparability and generalizability of the findings.
For most food groups, especially bread and breakfast cereals, vegetables, dairy products and spreadable fats, within-food group dietary diversity is positively associated with the fulfilment of the specific FBDG for that food group. The association between dietary diversity within both the meat group and the group of energy-dense, nutrient-poor foods and dietary balance is negative, which means that the probability of complying with the recommendation for meat consumption or intake of energy-dense, nutrient-poor foods decreases with the increase in dietary diversity within these groups. This is in line with the review of Kennedy et al. (Reference Kennedy28), which states that variety in energy-dense foods may contribute to obesity and overweight, and with the study of McCrory et al. (Reference McCrory, Fuss and Hays29), which found that a high variety of sweets promotes long-term increases in energy intake. Both consumption of meat and energy-dense, low-nutritious foods were found to be excessive in Belgium(Reference Vandevijvere, De Vriese and Huybrechts10). Despite this finding, it needs to be noted that no association was found between BMI and dietary diversity in the present study.
Furthermore, it should be noted that the group of meat, fish, eggs, legumes, nuts and meat substitutes is quite heterogeneous, but intake of meat comprises the largest part of the total intake of this food group (120 g of meat/d v. 161 g/d in total).
The strong association between dietary diversity within the dairy group and overall dietary adequacy and balance was also found in other studies(Reference Mirmiran, Azadbakht and Azizi30, Reference Foote, Murphy and Wilkens31). A higher dietary diversity in the group of dairy and spreadable fats is associated with the strongest increase in dietary adequacy and balance within the Belgian population, while dietary diversity within the meat group and the group of energy-dense, low nutritious foods is associated with the strongest decrease in dietary adequacy and balance.
The finding regarding spreadable fats is interesting. In general, one would think that people would use the same spreadable fats, thereby having a low within-group diversity in general due to product loyalty resulting in a low within-subject diversity. The present study shows that individuals having a higher within-food group diversity regarding spreadable fats seem to comply better with FBDG.
It is important to state some of the limitations of the present study. The response rate was low (42 %); 24 h recalls were also used in older subjects (>75 years) and only two non-consecutive 24 h dietary recalls were used to assess diversity, adequacy, moderation and balance of the diet. Furthermore, the dietary diversity score did not take into account that within each food group some individual foods are healthier than others. A weighed diversity score could be more appropriate, but it is difficult to give a weight to all food items within each food group. Many nutritionists make a demand for a more precise definition of food diversity(Reference Randall, Nichaman and Contant27, Reference Ruel32, Reference Krebs-Smith, Smiciklas-Wright and Guthrie33) and to develop a suitable indicator. Some authors have already tried to address this demand(Reference Drescher, Thiele and Mensink34).
Furthermore, the used adequacy, moderation and balance scores were not validated as such before use in the present study. They have only been used previously as part of a dietary quality index that was developed and validated in pre-school children(Reference Huybrechts, Vereecken and De Bacquer35). But the objectives of the present study were different and the number of food groups used to calculate the scores was different; spreadable fats were not included because spreadable fat intake was not well quantified in the pre-school children study. However, because these scores were calculated on the basis of existing FBDG, we considered them as appropriate tools to assess dietary quality.
Conclusion
Overall dietary diversity increases with age and is a useful indicator of both dietary adequacy and balance. For some food groups, such as bread and breakfast cereals, vegetables, dairy products, spreadable fats and energy-dense, nutrient-poor foods, within-group dietary diversity is a useful indicator of compliance with the specific FBDG for the intake of that food group. Dietary diversity within the group of dairy and spreadable fats is associated with the strongest increase in overall dietary adequacy and balance, while dietary diversity within the meat group and the group of energy-dense, nutrient-poor foods contributes most to a decrease in overall dietary quality in Belgium.
Acknowledgements
The survey was funded by the Federal Ministry of Health, Food Chain and Environment. The authors declare no conflicts of interest. S.V. did the analyses and drafted the manuscript. S.D., I.H. and M.M. were responsible for the fieldwork of the survey. H.V.O. was the general coordinator of the survey. All authors read and approved the final version of the manuscript. The authors acknowledge dietary support from Mia Bellemans, Mieke De Maeyer, Kadija El Moumni and Davy Van Steenkiste. Special thanks go to the respondents and the dietitians during the fieldwork.


