


A growing segment of the public identifies as following a specific popular diet for a variety of reasons, including to improve health, prevent chronic disease or lose weight(Reference Schwartz and Stapell1,Reference Radnitz, Beezhold and DiMatteo2) . A popular diet can be defined as a dietary pattern promoted through cookbooks, diet books or popular media coverage, as opposed to a researcher-generated dietary pattern such as the Dietary Approaches to Stop Hypertension (DASH) diet(Reference Campos, Wood and Burke3). Data from specialised retail food products(Reference Batte, Hooker and Haab4), Google keyword search activity (see Appendix 1)(Reference Nuti, Wayda and Ranasinghe5) and certain consumer surveys(Reference Asher, Green and Gutbrod6,7) confirm there is ongoing interest in particular diets. These diets include vegan/vegetarian, Paleo, low-carb and a variety of ‘whole food’ diets focused on avoiding highly processed foods. Although many popular diets differ in some respects, most share a common emphasis on eating practices generally associated with better health outcomes, including eating more fruits, vegetables(Reference Buijsse, Feskens and Schulze8) and whole grains(Reference Reynolds, Mann and Cummings9), and limiting refined grains(Reference Schlesinger, Neuenschwander and Schwedhelm10) and foods high in added sugar(Reference Khan, Tayyiba and Agarwal11). Dietary guidelines recommend moving towards a more unrefined, plant-based diet given that the majority of adult Americans have intakes below the recommended goals for vegetables (87 %), fruits (75 %) and whole grains (92 %), while exceeding the recommendations for added sugars (70 %), saturated fat (71 %) and Na (89 %)(12).
A variety of eating patterns have been reported to be beneficial for weight loss and reduced cardiometabolic risk, including plant-based(Reference Chen, Schoufour and Rivadeneira13), Mediterranean(Reference Franquesa, Pujol-Busquets and Garcia-Fernandez14), vegan/vegetarian(Reference Orlich and Fraser15), Paleo(Reference de Menezes, Sampaio and Carioca16), low-carb(Reference Harvey, Schofield and Zinn17) or gluten-free(Reference Kim, Demyen and Mathew18). Given the high prevalence of overweight and obesity associated with typical US dietary intake patterns(Reference Juul, Martinez-Steele and Parekh19,Reference Wang and Beydoun20) , studying individuals who report long-term adherence to diets lower in refined foods, higher in fibre and containing more fruits and vegetables can provide important examples of lifestyle choices that may support higher dietary quality or healthier weight. However, to date, no observational study has captured data from individuals who self-report adhering to a variety of popular diets and examined the association of these diets with BMI. Such data are relevant for dietitians and other health professionals who may encounter patients who either follow a specific popular diet or are interested in trying such diets to make specific dietary changes to achieve weight loss. Moreover, as interest in these diets for weight loss is encouraged by the popular media, health professionals should be prepared to engage in evidence-based discussion on such specific eating patterns.
The present study uses data from the Adhering to Dietary Approaches for Personal Taste (ADAPT) Feasibility Survey (FS) to examine the relationship between adherence to popular diet patterns and BMI. The first objective was to describe characteristics of self-identified popular diet followers, and the second objective was to compare mean BMI values across these diets, stratified by time following diet. Our hypothesis was that diet followers who identified as following a particular diet would have a lower BMI compared with those reporting that they ‘try to eat healthy’ (TTEH), and BMI would be lower among those participants reporting following their particular diet for a longer time period.
Materials and methods
As described in our previously published methodology paper(Reference Karlsen, Lichtenstein and Economos21), the ADAPT FS was a brief, web-based, cross-sectional survey designed to recruit self-identified popular diet followers and capture certain demographic and lifestyle characteristics. The study sample included self-selected individuals ≥18 years who encountered a study invitation through social media posts and newsletters shared by public figures promoting specific popular diets who acted as study recruitment partners. Participants answered yes to two screening questions ‘Are you at least 18?’ and ‘Do you agree to participate’. Answering ‘yes’ to these two questions were the only requirements for participation. We provided the recruitment partners with text to share via social media, as previously described(Reference Karlsen, Lichtenstein and Economos21). Enrolment was open for 8 weeks (14 July 2015–14 September 2015), with an active recruitment period of 6 weeks (14 July 2015–31 August 2015). The study was administered out of the Jean Mayer USDA Human Nutrition Research Center on Aging at Tufts University located in Boston, Massachusetts. The Checklist for Reporting Results of Internet E-Surveys (CHERRIES) was used to guide the survey design and administration(Reference Eysenbach22).
Data captured
In total, 9726 individuals responded to the survey. Of these, 9582 (98 %) provided complete data on age, sex, race and Hispanic ethnicity and indicated they followed a specific diet. The general principles of the self-reported diets are described in Table 1. Participants self-identified their current diet by responding to the question described in Fig. 1. The list of popular diet answer choices was based on our knowledge of the field and on recent Google Trends data (see online supplementary material, Supplemental Table 1) to track online search activity patterns with respect to a broad range of popular diets(Reference Karlsen, Lichtenstein and Economos21). The term ‘TTEH’ was offered as a choice for those interested in healthy eating but who did not identify as following a specific diet(Reference Karlsen, Lichtenstein and Economos21). Individuals who selected the ‘no particular diet’ (n 126) and ‘unknown/prefer not to answer’ (n 46) options, or who selected ‘other’ and were coded as ‘avoidance & medical diet’ (n 352) or ‘weight loss or athletic diets’ (n 39) constituted less than 4 % (n 563) of the total sample and were excluded from analysis due to lack of specificity and/or limited sample size. The resulting sample size was 9019 participants for the characterisation of followers of popular diets (Objective 1). Due to missing (n 445) or implausible (n 340) height or weight data, or missing data for time on diet (n 8), the final sample size for the comparison of BMI across diets and by length of adherence to the specific diet (Objective 2) was 8226 participants. The characteristics of the restricted sample were similar to the original sample (data not shown).
Table 1 Basic principles of diet groups captured in the Adhering to Dietary Approaches for Personal Taste (ADAPT) Feasibility Survey

* In addition to the food summarised in this table, many of these diet groups also make specific supplement recommendations.
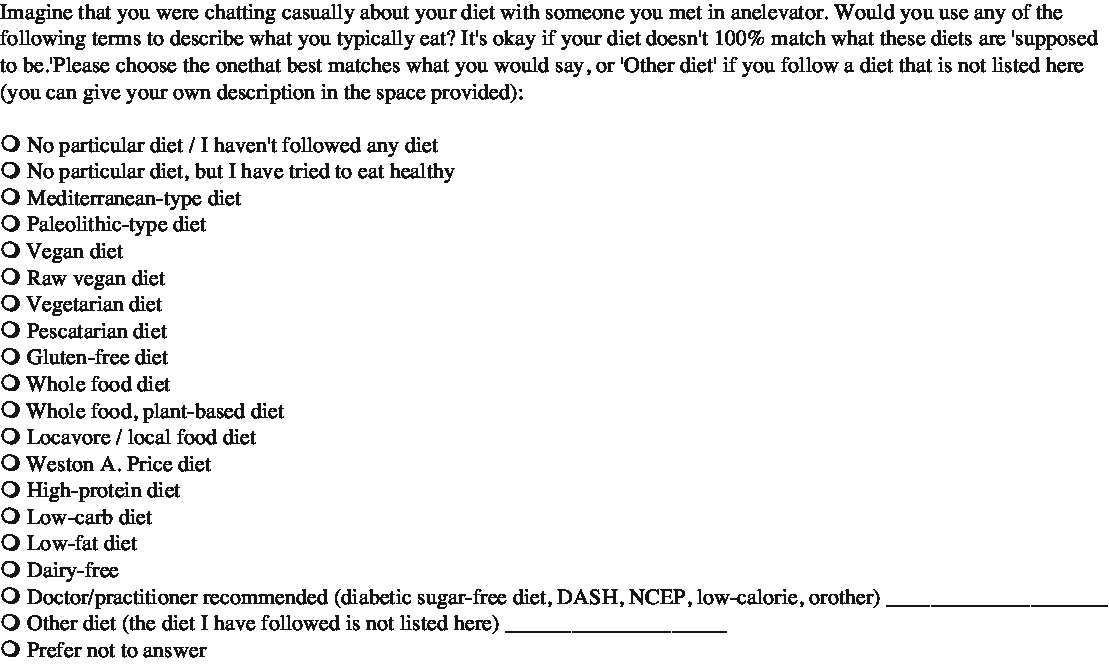
Fig. 1 Current diet captured in the Adhering to Dietary Approaches for Personal Taste (ADAPT) Feasibility Survey
Height and weight values within the 1–99 percentiles of data generated by sex for the National Health and Nutrition Examination Survey 2011–2014 were considered plausible in our sample(23). Weight status was defined using the Center for Disease Control’s cut-points for normal, overweight and obese based on BMI(24).
Diet groups were combined based on self-identification and/or similarity of included/excluded or avoided foods, specifically fruits and vegetables, whole grains, animal food v. plant food, dairy, meat and refined foods. In addition, similar dietary groups with small numbers were collapsed into larger groups(Reference Karlsen, Lichtenstein and Economos21). For example, respondents who selected the diet choice ‘low-fat’ (n 25) were combined with the larger group ‘TTEH’. The final categories were as follows: whole food, plant-based (WFPB) (n 2344; 26 %), vegan (including raw vegan) (n 1763; 20 %), Paleo (n 1326; 15 %), TTEH (n 1048; 12 %), vegetarian and pescatarian (n 883; 10 %), whole food (including Mediterranean and ‘locavore’) (n 754; 8 %), Weston A. Price (WAP) (n 493; 5 %) and low-carb (n 408; 4 %). Those who selected TTEH were presented with a follow-up question asking which dietary behaviours they practice to ‘try to eat healthy’, and participants could select multiple dietary behaviours (see online supplementary material, Supplemental Fig. 1). Time following each diet was collapsed into four categories: <6 months, 6 months–1 year, 1–5 years, >5 years, as well as a dichotomous grouping of <1 year or ≥1 year.
Demographic and descriptive health data captured included gender, age (seven categories 18–24, 25–34, 35–44, 45–54, 55–64, 65–74 and 75+ years), height (feet and inches), weight (lbs), race (White, Black or African American, American Indian or Alaska Native, Asian, Native Hawaiian or Other Pacific Islander and Other multiracial), ethnicity (Hispanic/non-Hispanic), ever diagnosed with a variety of health conditions (y/n), currently diagnosed as overweight or obese (y/n), US residency (y/n) and, if applicable, US-based zip code. Age categories were collapsed for analysis into 18–34, 35–54 and 55+ years.
In addition to self-identifying their diet, participants were asked about dietary practices and lifestyle habits, including supplement use, past diet and how long they had followed their current diet. Specific supplements consumed were asked as a follow-up question for those who answered ‘yes’ to taking any supplements. Not asked were which specific single-nutrient or multi-nutrient supplements were taken. No data on prescription diet pills or other medications were collected.
Physical activity data were available on a subgroup of participants (n 3352 participants) who completed the International Physical Activity Questionnaire short form(Reference Maddison, Ni Mhurchu and Jiang25), which was an optional fill-in questionnaire. The sample size was further reduced to 3114 by restricting to those with valid BMI data. A continuous score of Metabolic-Equivalent (MET) minutes per week as well as categorical variables for low, moderate and high activity were generated according to International Physical Activity Questionnaire protocol.
Statistical methods
SAS statistical software (Version 9.4; SAS Institute) was used for all analyses. Descriptive statistics were generated for demographic and lifestyle characteristics for the total sample and by self-identified diet group. Continuous data are presented as means and 95 % CI, and categorical data are presented as n and (%).
Due to right-skewed distribution, BMI values were log transformed prior to analyses. General linear models were used to estimate least square means adjusted for age, sex, US residency, time on diet and medication use for the following conditions: high cholesterol, high blood pressure, type 2 diabetes, cancer and gastrointestinal issues. Results are presented as geometric means and 95 % CI. The mean BMI among those on their diet for <1 year and ≥1 year were compared within each diet group. A Bonferroni adjustment for multiple comparisons was applied (n 8) yielding a critical value of 0·00625 for these analyses. A sensitivity analysis was conducted on the subset of participants who had physical activity data (n 3114) to assess if physical activity confounded the relationship between time on diet and BMI (see online supplementary material, Supplemental Table 2). BMI for each diet group overall was compared using TTEH as a reference group, as well as BMI for each diet group within each time on diet group (<1 year, 1–5 years and >5 years). TTEH was used as the reference group to represent a more non-specific eating pattern. Tukey’s Honestly Significant Differences were applied to adjust for multiple comparisons in these analyses.
Results
A comparison of the demographic and self-reported health characteristics across diets is presented in Table 2. Of the total sample of 9019 respondents, participants were 82 % female, 93 % White and 96 % non-Hispanic. A greater proportion of participants were aged between 35 and 54 years (46 %), followed by ≥55 years (33 %) and 18–34 years (22 %). The WFPB group had the smallest proportion (16 %) of those 18–34 years while the vegan group had the largest (26 %). The Paleo group had the smallest proportion (21 %) of those ≥55 years while the WFPB group had the largest (42 %). The majority of respondents (84 %) who took the survey reported living in the USA. Twenty-six percent of participants (n 9019) reported a current physician diagnosis of obesity or overweight, with the lowest rate observed in WAP (14 %) and highest among TTEH (40 %). Among those with BMI data (n 8226), 3 % were classified as underweight, 55 % normal weight, 24 % overweight and 18 % obese based on self-reported weight and height data.
Table 2 Unadjusted demographic and lifestyle characteristics by diet group
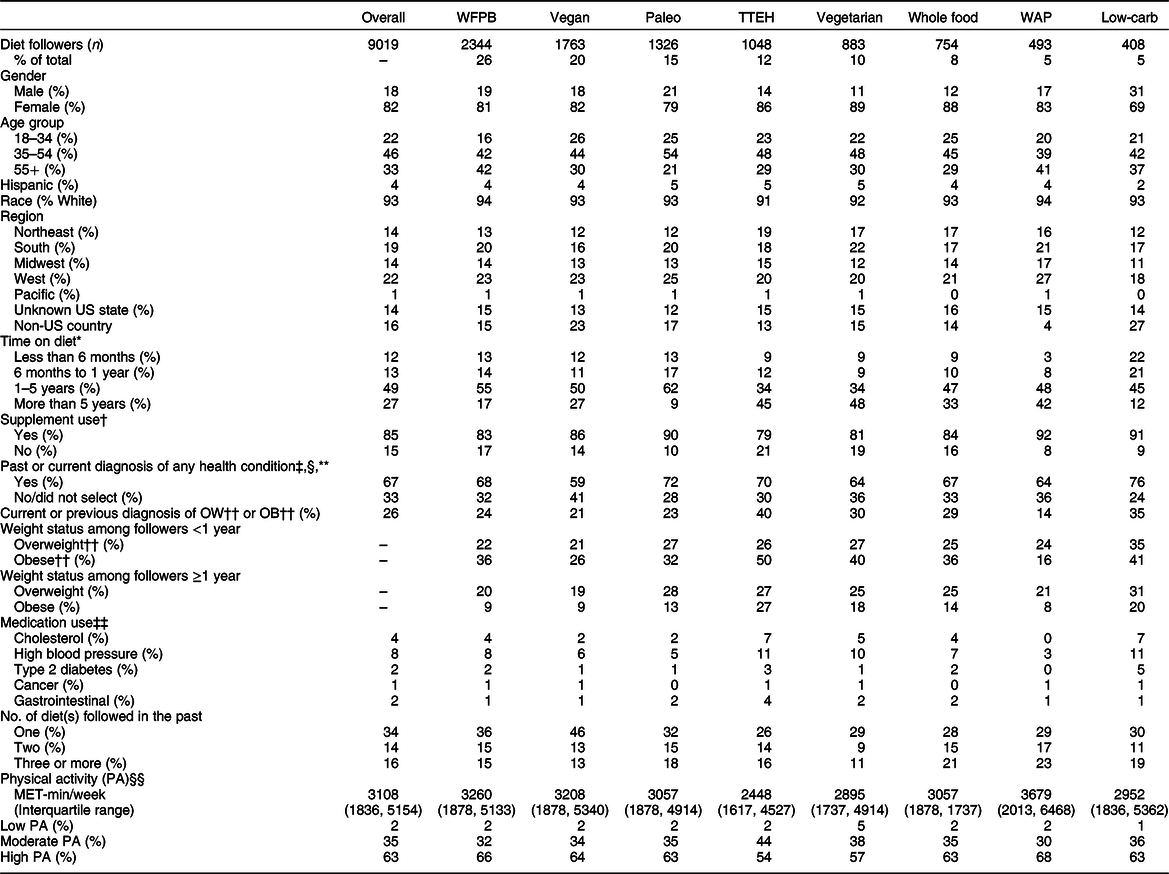
WFPB, whole food, plant-based; TTEH, try to eat healthy; WAP, Weston A. Price; MET, metabolic equivalents.
* n 9011 (excludes n 8 prefer not to answer responses).
† n 8996 (excludes n 10 prefer not to answer and n 13 missing responses).
‡ Includes those who selected either ‘At some point in the past I have been diagnosed with’ and/or ‘I still have this’ in response to the health history question for ‘ever diagnosed with health condition’; nonresponse was considered ‘no’.
§ Includes n 6013 who selected any current or past disease condition and n 3006 who did not select any current or past disease condition; nonresponse was considered ‘no’.
** Includes overweight, obese, high cholesterol, high blood pressure, type 2 diabetes, CVD, cancer, autoimmune, gastrointestinal or other.
†† OW = overweight: BMI ≥25·0 and <30·0; obese: BMI ≥ 30·0.
‡‡ Includes participants who selected ‘I currently take medication for this condition’; nonresponse was considered ‘no’.
§§ n 3114 (includes only participants with complete and plausible physical activity data).
The distribution of time following current self-identified diet was 12 % (less than 6 months), 13 % (6 months to 1 year), 49 % (1–5 years) and 27 % (>5 years). The TTEH and vegetarian groups had the smallest proportion (34 %) following their diet for 1–5 years, and the Paleo group had the largest (62 %). The Paleo group also had the smallest proportion (9 %) within the >5 years category. A large proportion of WAP respondents (42 %) reported following their diet for more than 5 years.
A total of 67 % (n 6013) of participants responded ‘yes’ to having a current or past diagnosis of any health condition with 53 % of 18–34 years, 67 % of 35–54 years and 75 % of 55+ years reporting a health condition. The sample reported low medication use, with only 8 % reporting blood pressure medication and 4 % reporting cholesterol medication. Overall, a total of 34 % reported following one other diet in the past (n 3077), 14 % had followed two (n 1227) and 16 % had followed three or more (n 1425).
In the subsample of 3114 participants who completed the physical activity questions and had a valid BMI, the overall median MET minutes per week was 3108 (interquartile range (IQR): 1836–5154). In this subsample, 63 % of respondents reported engaging in high physical activity defined by International Physical Activity Questionnaire for an average of at least 1 h or more of moderate or high intensity activity per day(Reference Maddison, Ni Mhurchu and Jiang25). Across diet groups, the range was 1–5 % low activity (1 % for low-carb; 5 % for vegetarian), 30–44 % moderate (30 % for WAP; 44 % for TTEH) and 54–68 % high (54 % TTEH; 68 % WAP) (Table 2).
In the overall sample, we saw significant percentage differences in mean BMI for each diet group relative to TTEH (P < 0·001 for all; Fig. 2). When comparing those who reported following their diet for ≥1 year v. <1 year (Table 3), the following four diet groups’ mean BMI were significantly lower among those on their diets for ≥1 year: WFPB (25·9 v. 23·4 kg/m2; P < 0·001), vegan (24·5 v. 23·2 kg/m2; P = 0·002), whole food (26·1 v. 24·0 kg/m2; P = 0·002) and low-carb (29·1 v. 24·8 kg/m2; P < 0·001). In the sensitivity analysis restricted to the subset of participants with available physical activity data (n 3114), additionally adjusting for physical activity did not attenuate the results (see online supplementary material, Supplemental Table 2), suggesting that our main analysis is unlikely to be confounded by physical activity.
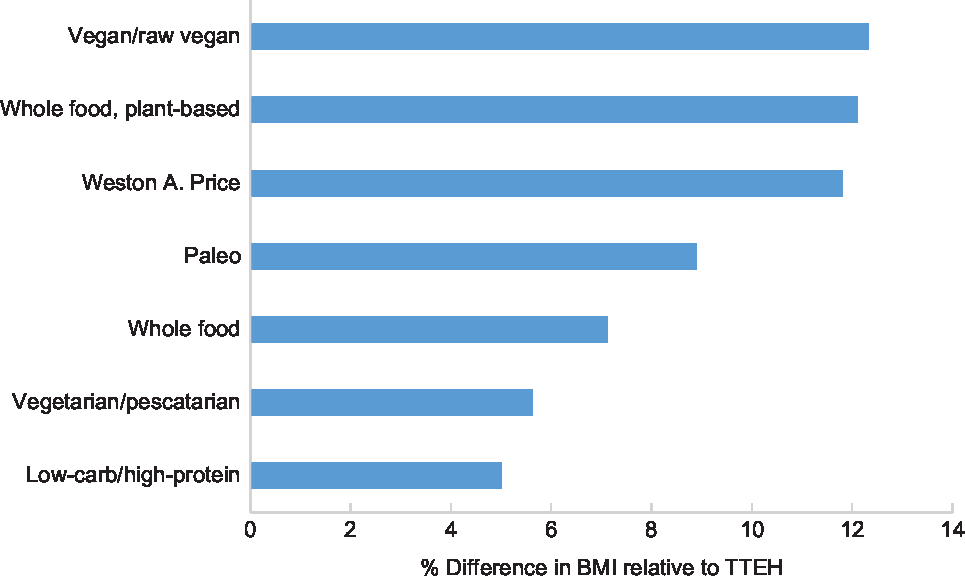
Fig. 2 Comparison of overall adjusted mean BMI*,† (percent differences) by diet group compared with TTEH. *n 8226. Excludes those with missing or invalid BMI (n 785 due to missing or implausible height or weight data) and (n 8) prefer not to answer responses to time on current diet; BMI means are adjusted for age, sex, US ‘residency’, time on diet and current medication use for the following conditions: high cholesterol, high blood pressure, type 2 diabetes, cancer and gastrointestinal. †Adjusted for Tukey’s Honestly Significant Differences. All differences were statistically significant (P < 0·001)
Table 3 Comparison of adjusted mean (95 % CI) BMI* by time on diet (<1 year to ≥ 1 year) within each diet group
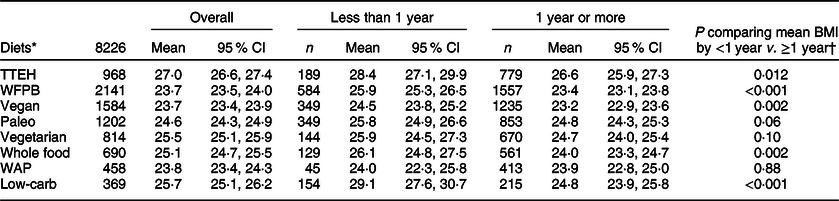
TTEH, try to eat healthy; WFPB, whole food, plant-based; WAP, Weston A. Price.
* Excludes those with missing or invalid BMI (n 785 due to missing or implausible height or weight data) and (n 8) prefer not to answer responses to time on current diet; BMI means are adjusted for age, sex, US ‘residency’, time on diet and current medication use for the following conditions: high cholesterol, high blood pressure, type 2 diabetes, cancer and gastrointestinal.
† Bonferroni correction for multiple comparisons (eight diet groups) yields a critical value of 0·00625 (0·05/8).
Among those who reported following their diet for 1–5 years, mean BMI were significantly lower among all diet groups compared with TTEH (Table 4). Mean BMI were TTEH (26·4 kg/m2), WFPB (23·2 kg/m2; P < 0·001), vegan (23·5 kg/m2; P < 0·001), Paleo (24·6 kg/m2; P < 0·001), vegetarian (25·0 kg/m2; P = 0·004), whole food (24·6 kg/m2; P < 0·001), WAP (23·5 kg/m2; P < 0·001) and low-carb (24·7 kg/m2; P = 0·002).
Table 4 Comparison of adjusted mean (95 % CI) BMI* by diet group stratified by time on diet and compared with TTEH group
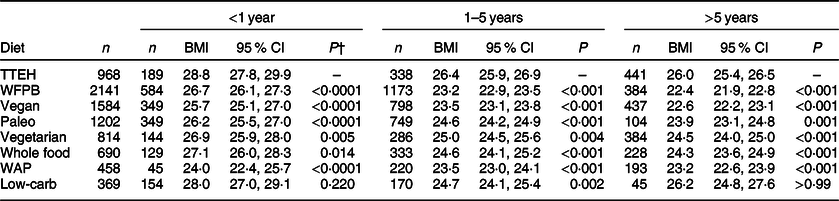
TTEH, try to eat healthy; WFPB, whole food, plant-based; WAP, Weston A. Price.
* n 8226, excludes those with missing or invalid BMI (n 785 due to missing or implausible height or weight data) and (n 8) prefer not to answer responses to time on current diet; BMI means are adjusted for age, sex, US ‘residency’ and current medication use for the following conditions: high cholesterol, high blood pressure, type 2 diabetes, cancer and gastrointestinal.
† P-values are adjusted using Tukey’s Honestly Significant Differences method for multiple comparisons.
Among those who reported following their diet for more than 5 years, mean BMI were significantly lower compared with TTEH (26·0 kg/m2; P < 0·001) in the following groups: WFPB (22·4 kg/m2; P < 0·001), vegan (22·6 kg/m2; P < 0·001), Paleo (23·9 kg/m2; P = 0·001), vegetarian (24·5 kg/m2; P < 0·001), whole food (24·3 kg/m2; P < 0·001) and WAP (23·2 kg/m2; P < 0·001). BMI for low-carb followers did not differ from the TTEH diet group. Similarly, mean BMI for those who reported following their diet for less than 1 year was lower in all popular diet groups than in the TTEH group, except for low-carb followers.
Discussion
To our knowledge, this survey is the first to capture data on a variety of popular diet followers, allowing for a comparison of participant characteristics and BMI across a wide range of self-identified diets with a sufficient sample size. We observed that compared with those participants who were reportedly trying to eat healthy, participants who reported following any particular diet had significantly lower mean BMI. We observed that mean BMI was lower among participants who had followed a WFBP, vegan, whole food or low-carb diet for more than 1 year compared with those who followed it for less than 1 year with mean difference ranging from 1·3 kg/m2 (vegan) to 4·3 kg/m2 (low-carb). We also observed that mean BMI among those who followed any particular diet, with the exception of low-carb, for 5 or more years ranged from 1·5 (vegetarian) to 3·6 (WFPB) kg/m2 lower compared with TTEH. These data suggest, perhaps, that BMI is lower among those who made active decisions to adhere to well-defined diets particularly those that are more plant-based and/or limited highly processed foods, as well as those who follow specific diets for a longer time period. Based on a meta-analysis of observational studies, a 5 kg/m2 higher BMI is associated with a 16 % higher relative risk of sudden cardiac death incidence(Reference Aune, Schlesinger and Norat26), and even a one unit higher BMI is associated with higher systolic blood pressure and total cholesterol in both men and women(Reference Dudina, Cooney and Bacquer27). These data underscore the importance of our findings in understanding factors that may facilitate healthy weight loss and maintenance. Based on our ADAPT FS, we have designed a larger ADAPT Study (data collection ongoing) aimed at capturing a wide range of data on psychobiological, cultural, social and environmental predictors of long-term dietary adherence, in addition to self-reported dietary intake data.
Our previous analysis estimating theoretical food and nutrient levels of WFPB and vegan diets indicated that WFPB and vegan patterns were similar(Reference Karlsen, Rogers and Miki28), including high targets for vegetables, whole grains and legumes, no animal products, low levels of total and saturated fat, and a high level of fibre (~70 g/d). Consistent with findings from other cross-sectional studies(Reference Jaceldo-Siegl, Estevez and Fraser29–Reference Newby, Tucker and Wolk32), we observed that followers of more plant-based diets, in particular vegan and WFPB, had the lowest BMI relative to other diet followers and also compared with those who TTEH (Fig. 2). In a cross-sectional analysis in a sample of 73 308 adults from the Adventist Health Study II cohort, vegans had lower BMI (24·1 kg/m2) compared with vegetarians (26·1 kg/m2) and semi-vegetarians (27·3 kg/m2)(Reference Orlich, Singh and Sabate33). Similarly, in a recent cross-sectional analysis of 3475 Hispanic/Latino adults, in comparison to the non-vegetarian diet followers, BMI was significantly lower in vegan, followed by vegetarian and pescatarian adults(Reference Jaceldo-Siegl, Estevez and Fraser29).
Emerging evidence from longitudinal studies shows that higher conformity to more plant-based diets is associated with less weight gain(Reference Chen, Schoufour and Rivadeneira13,Reference Japas, Knutsen and Dehom34) , less gain in abdominal adiposity(Reference Chen, Schoufour and Rivadeneira13) and reduced risk of becoming overweight or obese(Reference Japas, Knutsen and Dehom34). Noteworthy is the observation that weight gain is not mitigated in followers of plant-based diets when these diets are considered ‘less healthy’, that is, diets high in sugary foods and beverages, refined gains and desserts(Reference Gomez-Donoso, Martinez-Gonzalez and Martinez35). A meta-analysis of twelve randomised controlled trials, with a median of 18 weeks duration (8 weeks to 2 years), found that people assigned to vegetarian weight loss diets lost significantly more weight than those assigned to non-vegetarian diets(Reference Huang, Huang and Hu36). Limited observational data on the long-term impact of following a Paleo diet on body weight exist, although a recent meta-analysis of eleven randomised controlled trials conducted over 2 weeks to 24 months suggests that the Paleo diet compared with the control diet led to greater reductions in body weight, BMI and waist circumference(Reference de Menezes, Sampaio and Carioca16). While sample sizes were small, these intervention diets typically eliminated added sugars and refined foods, while at the same time emphasising meat, fish and vegetables(Reference de Menezes, Sampaio and Carioca16).
We observed that BMI was higher among those who identified as ‘trying to eat healthy’, which captured several dietary behaviours, including eating more fruits and vegetables, drinking less sugar-sweetened beverages, eating less meat and eating fewer salty snacks. One possibility is that merely ‘trying to eat healthy’ may not be as effective at achieving or maintaining healthy body weight as subscribing to a more defined diet. Alternatively, participants who report following a specific diet may have been doing so specifically to manage or lose weight. We also observed lower mean BMI among those participants who had followed their diets for more than 1 year, suggesting that adherence to a diet is important in weight maintenance or loss. Albeit limited, there is some evidence to support that adherence to certain specific diets, irrespective of the principles of the diet, may be a more important determinant of weight loss than the diet itself(Reference Dansinger, Gleason and Griffith37,Reference Alhassan, Kim and Bersamin38) . A randomised controlled trial of five increasingly plant-based diets (spanning omnivorous to vegan), providing no instructions on energy restriction, found that those assigned to the vegan diet lost significantly more weight than the omnivorous, semi-vegetarian and pescatarian; however, among adherent participants only, all diets produced equivalent weight loss over 6 months(Reference Turner-McGrievy, Davidson and Wingard39). Of note, the non-adherent vegan and vegetarian participants in this intervention lost significantly more weight than non-adherent omnivore participants(Reference Moore, McGrievy and Turner-McGrievy40), thus suggesting that plant-based diets may be more effective targets for weight loss without full adherence. Given the duration of the interventions and poor follow-up outcomes of weight loss studies, future long-term studies of followers of all these diets are needed to determine whether consciously committing to any specific diet is associated with lower BMI over the lifespan.
As this study was designed to demonstrate feasibility, several limitations should be noted. Participants were primarily women (82 %) and White (93 %), limiting the generalisability of our findings, to primarily White women, consistent with observed response rates to other surveys(Reference Cramer, Kessler and Sundberg41,Reference Smith42) , including web-based surveys(Reference Schwartz and Stapell1). The self-selected nature of the cohort prevents knowing whether the followers in each diet group are representative of the followers in the general population, and, due to the sampling, they are unlikely to be representative with respect to sex, race, socioeconomic status, internet access or time following current diet. Self-reported data also increase the possibility of reporting bias, particularly with respect to body weight. The ADAPT FS was brief and did not capture data on actual dietary intake, socioeconomic status, behaviour or physical activity. Our current exposure is intentionally self-identified diet; thus, discrepancies may exist between researchers’ perceptions of the self-identified label and actual food choices(Reference Rothgerber43,Reference Rajpoot, Sharma and Harikrishnan44) . Furthermore, the cross-sectional nature of our survey did not allow for prospective identification of either (1) individuals who successfully lost weight following a particular dietary pattern or (2) ‘serial dieters’ (individuals who may try one diet after another).
One additional limitation not addressed in this analysis is that diet followers may be motivated to adhere to their diet for a variety of reasons, and these motivations may also influence eating habits(Reference Radnitz, Beezhold and DiMatteo2) and, accordingly, weight and BMI(Reference Schlesinger, Neuenschwander and Schwedhelm10,Reference Naughton, McCarthy and McCarthy45) . For example, vegans with health-related motivations reported eating more fruits and fewer sweets compared with vegans with ethical motivations(Reference Radnitz, Beezhold and DiMatteo2). In a general sample of adults, being female, older age, having normal BMI, regular exercise and higher intakes of fruits and vegetables were associated with higher odds of having a strong motivation to eat healthfully(Reference Naughton, McCarthy and McCarthy45). These are important considerations for future surveys, and we have aimed to address many of these limitations with our larger ongoing data collection in the main ADAPT Study. Preliminary analysis of data collected among individuals in the main ADAPT Study suggests that prevention and overall wellness are among the top motivations for following a particular diet, although other motivations were identified(Reference Miki, Karlsen and Livingston46).
The ADAPT FS has several strengths including capturing demographic and lifestyle characteristics data across a broad range of diet groups. Other strengths include the large sample size and relatively even distribution among age brackets, geographic origin in the USA and time following current diet. This survey captured self-identified diet, which enables future analyses on adherence to specific diet principles by comparing theoretical v. actual dietary intakes. Results on mean BMI across diet followers provide a relevant snapshot into possible outcomes for individuals who choose to adhere to a specific diet over the long-term.
Effective strategies to promote healthy weight loss and maintenance are urgently needed. Overweight and obesity are the most widespread public health problems in the USA, with approximately two-thirds of all Americans being overweight and half of those being obese(Reference Yang and Colditz47). In the USA, at the midcourse review of the Healthy People 2020 goals, it was noted that ‘little or no detectable change’ was observed with prevalence of adult obesity or daily consumption of vegetables(48). Adherence to diets that emphasise more plant foods and less refined foods, such as those identified in the ADAPT Study, may be effective strategies to promote weight loss and healthy weight maintenance.
Conclusion
Our findings suggest that BMI is lower among those participants who made active decisions to adhere to a specific diet, particularly more plant-based diets and/or specific diets limiting processed foods, compared with those who simply try to eat healthy, as well as those who follow intentional eating plans for a longer time period. However, these data indicate overweight and obesity may be less prevalent in our study respondents compared with the general US population. Health professionals who encounter individuals following a specific diet should be familiar with what is known about popular diet followers in practice, as these diets may facilitate healthy weight loss and maintenance. In future research, actual dietary intake data from recalls or records should be collected and recruitment strategies expanded to collect data on men, different ethnic groups and those reporting no particular diet.
Acknowledgements
Acknowledgements: The authors thank our recruitment partners who made the administration of this survey possible and to ADAPT FS study participants. Funding support: This work was supported by USDA ARS agreement No. 2012-38420-30200 (M.C.K., C.D.E.), USDA ARS agreement No. 58-1950-4-003 (A.H.L., G.R., P.F.J., K.A.L. and N.M.M.), Tufts Collaborates and the Lisa Wendel Memorial Foundation. Conflict of interest: M.C.K. is an unpaid member of the Board of Directors for the Plant-based Prevention of Disease Conference and currently receives consulting payments from the Plantrician Project. N.M.M. currently receives research funding from the Bell Institute of Health and Nutrition and ILSI North America. The other authors declare no conflict of interest. Authorship: M.C.K., G.R., K.A.L. and N.M.M. collected the data. M.C.K. analysed the data and wrote the first draft of the manuscript with oversight from G.R. and N.M.M. K.A.L. edited the manuscript. All authors reviewed and commented on subsequent drafts of the manuscript. Ethics of human subject participation: This study was conducted according to the guidelines laid down in the Declaration of Helsinki and all procedures involving research study participants were approved by the Tufts University Health Sciences Internal Review Board. Written informed consent was obtained from all subjects.
Supplementary material
For supplementary material accompanying this paper visit https://doi.org/10.1017/S10.1017/S1368980020001330


 Open access