


Household food insecurity is increasingly recognized as an important public health problem in many affluent countries, including Canada( Reference Tarasuk, Mitchell and Dachner 1 – Reference Loopstra, Reeves and Stuckler 4 ). Empirical evidence suggests that experiencing inadequate or insecure access to food due to financial constraints is a strong determinant of physical and mental health across the life cycle( Reference Gundersen and Ziliak 5 – Reference Power, Uphoff and Kelly 8 ), and a growing number of studies indicates the presence of a dose–response relationship between the severity of the experience and risk of poor health outcomes( Reference Whitaker, Phillips and Orzol 9 – Reference Gregory and Coleman-Jensen 14 ). In Canada, where there is a universal health-care system, food insecurity has also been associated with elevated health-care costs independently of other social determinants of health( Reference Tarasuk, Cheng and de Oliveira 15 , Reference Fitzpatrick, Rosella and Calzavara 16 ).
Food insecurity is inextricably linked to households’ economic resources. Household income has repeatedly been shown to have an inverse relationship with the risk of food insecurity( Reference Leete and Bania 17 – Reference Coleman-Jensen 27 ) and with the severity of the experience( Reference Tarasuk, Mitchell and McLaren 26 – Reference Li, Dachner and Tarasuk 29 ). Recent studies from Canada also indicate that food insecurity is sensitive to policy interventions that increase household incomes (e.g. through increases in social assistance and child benefits)( Reference Loopstra, Dachner and Tarasuk 30 – Reference McIntyre, Dutton and Kwok 32 ). However, evidence suggests that food insecurity is not simply a manifestation of low income, but that it is the consequence of a complex set of economic circumstances and opportunities. Vulnerability to food insecurity has been shown to be influenced by income stability( Reference Leete and Bania 17 ), access to assets and savings( Reference Leete and Bania 17 – Reference McIntyre, Wu and Fleisch 20 ) and costs of living( Reference Nielsen, Garasky and Chatterjee 22 – Reference Sriram and Tarasuk 25 , Reference Fletcher, Andreyeva and Busch 33 – Reference Nord, Coleman-Jensen and Gregory 35 ). Other independent risk factors, often associated with greater economic and social vulnerability, have also been identified in Canada. Examples include Aboriginal status, lone parenthood, lower education, renting rather than owning one’s home and reliance on income assistance programmes( Reference McIntyre, Wu and Fleisch 20 , Reference Sriram and Tarasuk 25 , Reference Tarasuk, Mitchell and McLaren 26 , Reference Li, Dachner and Tarasuk 29 ). The body of research highlights that food insecurity reflects economic hardship arising from a dynamic, multifactorial process.
Although food insecurity focuses on material deprivation that manifests as food access problems, there are indications that the deprivation experienced by food-insecure households pervades other domains of consumption. Qualitative research among low-income households has long documented that food insecurity occurs in a context of competing demands for scarce resources and that food-insecure households make trade-offs in multiple spheres of their lives( Reference Campbell and Desjardins 36 – Reference Knowles, Rabinowich and Ettinger de Cuba 41 ). Analyses from the USA have shown that food-insecure households tend to have lower food expenditures( Reference Coleman-Jensen 27 , Reference Cristofar and Basiotis 42 – Reference Coleman-Jensen, Rabbitt and Gregory 46 ), but evidence from the USA and Canada indicates that food insecurity often coexists alongside substandard housing( Reference Cook, Black and Chilton 11 , Reference Ouellette, Burstein and Long 47 – Reference Cutts, Meyers and Black 50 ), unstable housing( Reference Cutts, Meyers and Black 50 , Reference Gundersen, Weinreb and Wehler 51 ), having difficulty paying essential bills like rent, mortgage and utilities( Reference Cook, Black and Chilton 11 , Reference Ouellette, Burstein and Long 47 – Reference Kirkpatrick and Tarasuk 49 , Reference Cook, Frank and Casey 52 – Reference Heflin 54 ), and, more specific to the US context, being unable to afford medical care when needed( Reference Ouellette, Burstein and Long 47 , Reference Heflin 48 , Reference Klesges, Pahor and Shorr 53 , Reference Heflin 54 ). A small study of low-income urban families in Canada also demonstrated that the severity of food insecurity is associated with greater odds of borrowing money for rent, delaying bill payments, living in substandard housing and giving up services( Reference Loopstra and Tarasuk 55 ). The findings suggest that the material well-being of food-insecure households is compromised in numerous ways and that the compromises increase with the severity of food insecurity.
Characterizing the extent of the deprivation experienced by food-insecure households is critical to our broader understanding of the problem of food insecurity, but previous studies have provided only a partial depiction of the compromises made by food-insecure households by focusing on a few, discrete indicators of hardship( Reference Ouellette, Burstein and Long 47 – Reference Loopstra and Tarasuk 55 ) or on specific expenditures, such as food( Reference Coleman-Jensen 27 , Reference Cristofar and Basiotis 42 – Reference Coleman-Jensen, Rabbitt and Gregory 46 ) and housing( Reference Kirkpatrick and Tarasuk 49 ). More comprehensive analyses of household spending have long been used to contrast the material well-being of population subgroups( Reference Deaton 56 – Reference Kaushal, Gao and Waldfogel 63 ). Generally, lower spending on diverse goods and services and greater proportions of the budget allocated towards basic needs are indicative of lower relative material well-being, especially when differences are observed between population subgroups stratified by some measure of economic disadvantage( Reference Chai and Moneta 60 – 64 ). To date, in-depth assessments of household spending in the context of food insecurity in affluent countries have been thwarted by a paucity of data, but such analyses can shed light on the consumption and material well-being of food-insecure households. Drawing on a unique, population-based survey, the present study aimed to: (i) describe the allocation of economic resources over a 12-month period among Canadian households reporting different levels of food insecurity; and (ii) examine the influence of household income on the association between food insecurity status and households’ resource allocation, recognizing that household income is a strong predictor of both consumption and food insecurity.
Methods
Data and sample
Data were obtained from the 2010 cycle of the Survey of Household Spending (SHS), a cross-sectional survey administered annually by Statistics Canada to collect detailed information on household expenditures( 65 ). The sampling frame consisted of all households living in the ten provinces, except for individuals living in institutions, members of the Canadian Forces living in military camps and people living on First Nations reserves; these exclusions represented approximately 2 % of the population of the ten provinces. Information on demographic and socio-economic characteristics as well as regular and large infrequent expenditures were collected during an in-person interview. The Household Food Security Survey Module (HFSSM) was added to the interview questionnaire of the 2010 cycle. Households were also asked to complete a diary for all daily expenditures that were not collected during the interview for a 2-week period. To improve the accuracy of the expenditures reported and reduce respondents’ burden, households were encouraged to consult personal records during the interview and had the option of providing receipts of daily expenditures instead of recording them in the diary( 65 ). Annual income for the year prior to the survey was retrieved from administrative data tax file (i.e. income tax returns) for most households in the sample; otherwise, annual income was reported during the interview. Statistics Canada imputed missing income and expenditures and annualized all expenditures with multiplying factors appropriate for the reporting reference period. Unavailable information on household food insecurity status was identified as missing. A total of 9062 households completed both the interview and diary components of the survey( 65 ), and the final analytic sample for the present study included all households with a measurement of household food insecurity status (n 9050).
Household food insecurity status
Household food insecurity is monitored in Canada and the USA using the eighteen-item HFSSM( Reference Tarasuk, Mitchell and Dachner 1 , Reference Coleman-Jensen, Rabbitt and Gregory 46 ). The HFSSM is a validated experience-based scale structured to reflect a severity continuum ranging from anxiety about being unable to afford food, to compromising food quality, to cutting or skipping meals, losing weight or not eating for a whole day because of insufficient money to buy more food over the past 12 months( Reference Hamilton, Cook and Thompson 44 , Reference Hamilton, Cook and Thompson 66 , Reference Wunderlich and Norwood 67 ). The module contains an adult and a child component, but an error in the administration of the eight items specific to children during the interview of the 2010 SHS prevented their use to determine household food insecurity status. For the present study, answers to the ten items specific to adults were coded as affirmative or negative based on Health Canada’s protocol( 68 ). One strength of using only the items specific to adults is that the same items and thresholds are used to determine the food security status of households with and without children( Reference Wilde 69 ). Household food insecurity status was expressed as a four-level variable, with food security, marginal, moderate and severe food insecurity defined, respectively, as 0, 1, 2–5 and ≥6 affirmative answers( Reference Tarasuk, Mitchell and Dachner 1 , 68 ). The cut-offs for moderate and severe food insecurity are based on Health Canada’s thresholds( 68 ). Marginal food insecurity was included as a discrete category, given emerging evidence that affirming any item is associated with heightened vulnerability( Reference Tarasuk, Cheng and de Oliveira 15 , Reference Tarasuk, Mitchell and McLaren 26 , Reference Coleman-Jensen 27 , Reference Loopstra and Tarasuk 55 ).
Household expenditures
More than 400 expenditures were collected in the interview and diary components of the survey. To contrast spending patterns by severity of household food insecurity, the individual annualized expenditures were first aggregated into ten sub-categories that reflect different consumption purposes, and these sub-categories were further aggregated into four broad categories that provide a more succinct description of resource allocation towards essential and more flexible consumption needs (see Table 1 for detailed description). The four broad categories were basic needs, other necessities, discretionary spending and investments/assets. The sub-categories included in basic needs were consistent with the expenditures included in the definition of a basic standard of living to calculate the low income cut-offs used in Canada( 64 ). The notion of what represents discretionary spending likely varies across households, but the term was used in the present study to refer to more flexible expenditures that may be less critical for daily living and functioning. Total household expenditures were also examined, since it is indicative of the overall economic resources available to households for consumption during the period for which food insecurity was measured.
Table 1 Description of the four categories and ten sub-categories of expenditures
Covariates for household composition, household size and household income
Household composition is considered a critical factor influencing households’ preferences and consumption decisions( Reference Deaton and Zaidi 57 ). Given that previous Canadian population-based studies have shown that food insecurity is related to household composition( Reference McIntyre, Wu and Fleisch 20 , Reference Sriram and Tarasuk 25 , Reference Tarasuk, Mitchell and McLaren 26 , Reference Li, Dachner and Tarasuk 29 ), the number of children below the age of 18 years, the number of adults aged 18–64 years and the number of seniors 65 years of age or more were added as separate continuous variables in the analyses to control for differences in household composition. These three variables also served to account for differences in household size, which is essential when analysing expenditure data since a household’s needs generally increase with its size.
Annual household income was expressed as quartiles of after-tax income, which was calculated by subtracting income tax from household incomes obtained from all sources (e.g. wages and salaries, pensions, and government transfers and tax credits). After-tax income was used instead of before-tax income to better reflect the money available for consumption.
Statistical analyses
Proportions and means with standard deviations were used to describe the sample by food insecurity status. Spending patterns were first examined using the four broad expenditure categories and then using the ten sub-categories. Each expenditure category and sub-category was expressed in dollars spent (all dollar values are $CAN) and proportion of total expenditures, hereafter referred to as budget share. Mean dollars spent and mean budget share for each category and sub-category were estimated by food insecurity status while first controlling only for household composition and size, and then adding quartiles of after-tax household income. The mean estimates were obtained using generalized linear regression models with a gamma distribution and log-link function. The gamma distribution was used because expenditure data are limited to non-negative values( Reference Hardin and HiIbe 70 ). The log-link function was selected over the traditional practice of applying a logarithmic transformation to data with a right-skewed distribution because it enables estimations of predicted outcomes in the original scale, avoiding the issues associated with the re-transformation of the log-transformed expenditures( Reference Manning and Mullahy 71 ). Tests for linear trend were conducted to assess the presence of an association between the predicted means and food insecurity status. The P values of the linear trends were adjusted using the Bonferroni method to account for multiple tests (adjusted for twenty-nine outcomes). A lack of overlap in the 95 % CI of the estimated means was also used as an indication that the means differed from each other( Reference Cumming 72 ).
As a sensitivity analysis, more detailed covariates for children’s age (i.e. number of children aged 0–2, 3–5, 6–12 and 13–17 years) were included in the models, since children’s age may be associated with food insecurity( Reference Anderson, Butcher and Hoynes 73 ) and may influence household consumption decisions (e.g. food, housing and leisure choices, childcare, education). These inclusions had minimal impact on the point estimates and did not affect the trends. The results obtained from the more parsimonious models including number of children <18 years, number of adults 18–64 years and the number of seniors ≥65 years are reported, but the results including more detailed age groups for children are available upon request.
The sampling and bootstrapped weights provided by Statistics Canada were used to obtain population-representative estimates and to account for the complex survey design. All analyses were conducted with the statistical software package Stata version 15.
Results
Household composition differed by food insecurity status; food-secure households tended to have fewer children and more seniors than marginally, moderately and severely food-insecure households (Table 2). Compared with food-secure households, the marginally, moderately and severely food-insecure households were more likely to be in the lowest quartile of after-tax income and less likely to be in the highest quartile.
Table 2 Household composition and income by household food insecurity status in a population-based sample of households from the ten provinces of Canada (n 9050), 2010 Survey of Household Spending
* Adjusted Wald tests for equality of means or the Rao–Scott F-adjusted χ 2 statistic for categorical variables.
† Column percentages.
‡ Use with caution, high sampling variability associated with the estimate (CV>16·6 %).
Food-secure households had higher mean total expenditures ($69 603) than marginally ($47 214), moderately ($43 353) and severely ($39 579) food-insecure households (Fig. 1(a)). There was a significant downward linear trend in mean total expenditures as severity of food insecurity increased (P<0·0001).
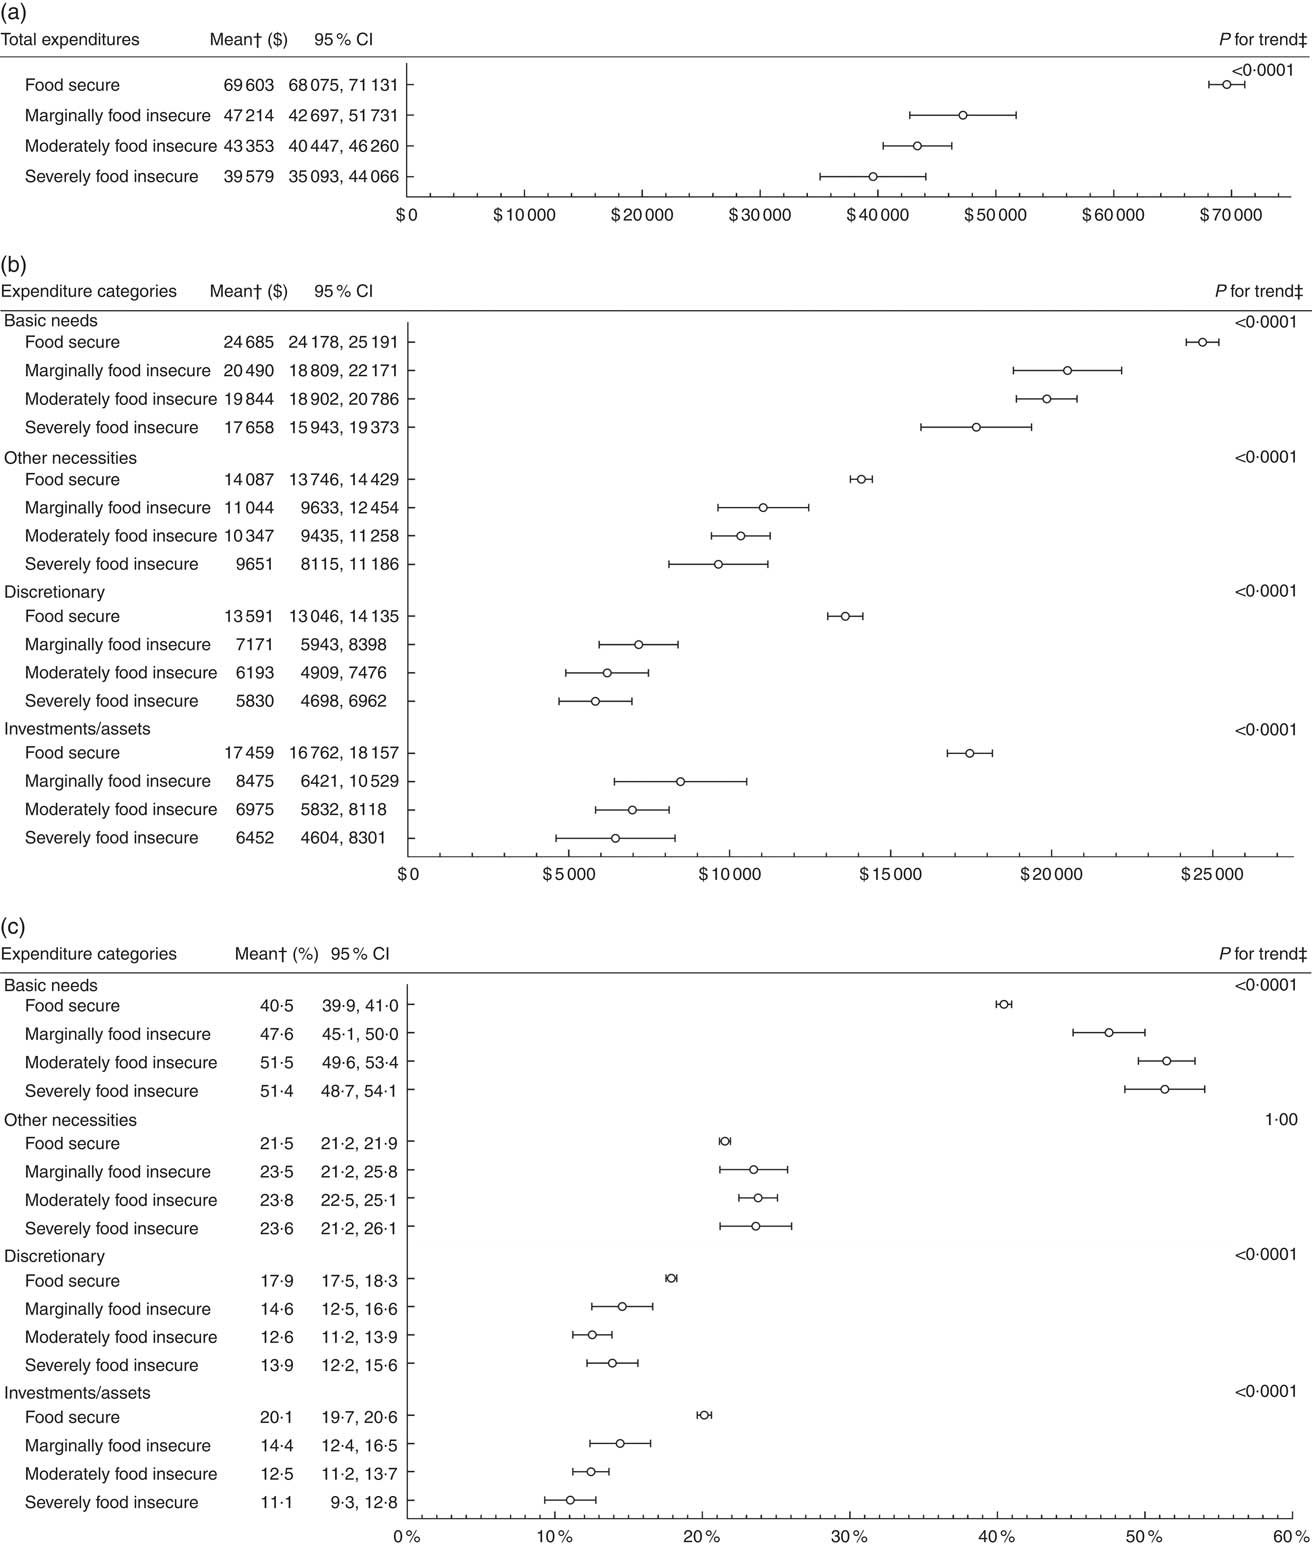
Fig. 1 Mean total expenditures by household food insecurity status* (a), mean dollars spent in each expenditure category by household food insecurity status* (b) and mean budget share allocated to each expenditure category by household food insecurity status* (c) in a population-based sample of households from the ten provinces of Canada (n 9050), 2010 Survey of Household Spending. All dollar values are $CAN. *Analyses using all households with no missing food insecurity status; food secure (n 7783), marginally food insecure (n 324), moderately food insecure (n 621) and severely food insecure (n 322). †Predicted means conditional on number of children <18 years, number of adults 18–64 years and number of seniors ≥65 years in the household set at observed values; means (○) and 95 % CI (represented by horizontal bars) estimated while accounting for the complex survey design. ‡Bonferroni-adjusted P value for linear trend test across household food insecurity status; the linear trend test accounted for the complex survey design
Mean dollars spent and mean budget shares of the full sample for the four broad categories and ten sub-categories are presented in the online supplementary material, Supplemental Tables 1 and 2.
Food-secure households had higher mean expenditures on basic needs, other necessities, discretionary spending and investments/assets than marginally, moderately and severely food-insecure households (Fig. 1(b)). For each of the four categories, there was a highly significant downward trend in mean expenditures as severity of food insecurity increased (P<0·0001 for all trends). Of the four categories, basic needs represented the largest expense for all levels of food insecurity, with a mean budget share of 40·5 (95 % CI 39·9, 41·0) %, 47·6 (95 % CI 45·1, 50·0) %, 51·5 (95 % CI 49·6, 53·4) % and 51·4 (95 % CI 48·7, 54·1) % for the food-secure, marginally, moderately and severely food-insecure households, respectively (Fig. 1(c)). The budget shares allocated to other necessities, discretionary spending and investments/assets tended to be similar among food-secure households, with each one comprising roughly 20 %, but they differed for the food-insecure households. Irrespective of the level of severity, food-insecure households allocated a larger budget share to other necessities than to discretionary spending or investments/assets, while these latter two categories had similar mean budget shares. Food-secure households had lower mean budget share allocated to basic needs but higher mean budget shares allocated to discretionary spending and investments/assets than marginally, moderately and severely food-insecure households. The linear trend indicated that the budget share allocated to basic needs rose with the severity of food insecurity (P<0·0001). In contrast, the budget shares allocated to discretionary spending and investments/assets both declined as severity of food insecurity increased (P<0·0001 for both trends). There was no significant trend for the budget share allocated to other necessities (P=1·00).
Similar to the patterns observed for the four broad categories, there were significant downward trends in the dollars spent in each of the ten sub-categories as severity of food insecurity increased, except for transportation which had a non-significant downward trend (P=0·06; Fig. 2(a)). Food-secure households had higher mean expenditures on food, clothing, household/personal care, health/education, leisure, miscellaneous, personal insurance/pension and durables/assets than marginally, moderately and severely food-insecure households. For all four levels of food insecurity, housing represented the highest budget share, ranging from 22·8 (95 % CI 22·4, 23·2) % among food-secure households to 32·2 (95 % CI 29·5, 35·0) % among severely food-insecure households (Fig. 2(b)). Among the marginally, moderately and severely food-insecure households, the second highest budget share was allocated to food followed by transportation, whereas food-secure households had similar mean budget shares for food (13·5 %; 95 % CI 13·3, 13·8 %) and durables/assets (13·7 %; 95 % CI 13·2, 14·1 %). The other sub-categories represented 10 % or less of total expenditures for all groups, irrespective of food insecurity status. There were no significant trends for the budget shares allocated to food, clothing, transportation, household/personal care, health/education and leisure. In contrast, the budget share on housing rose with severity of food insecurity (P<0·0001), while the budget shares on miscellaneous (P=0·0008), personal insurance/pension (P<0·0001) and durables/assets (P<0·0001) declined as severity of food insecurity increased.
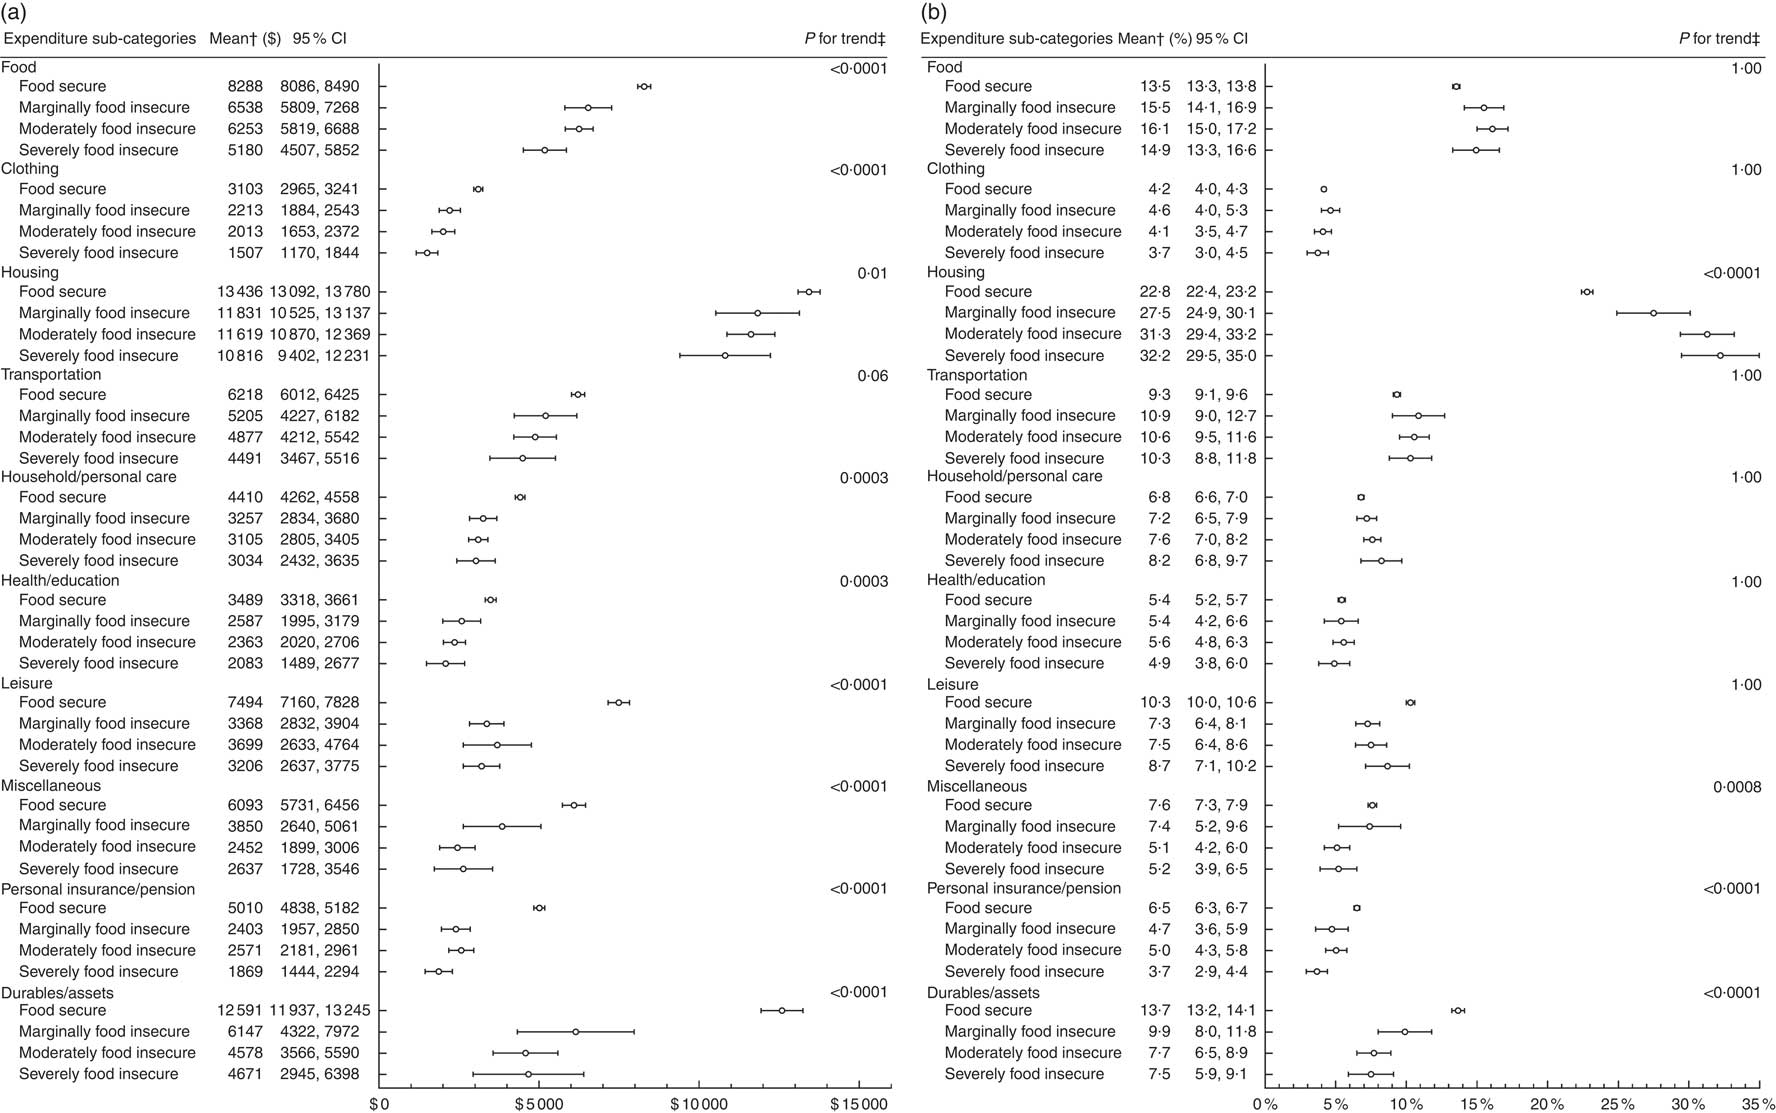
Fig. 2 Mean dollars spent in each expenditure sub-category by household food insecurity status* (a) and mean budget share allocated to each expenditure sub-category by household food insecurity status* (b) in a population-based sample of households from the ten provinces of Canada (n 9050), 2010 Survey of Household Spending. All dollar values are $CAN. *Analyses using all households with no missing food insecurity status; food secure (n 7783), marginally food insecure (n 324), moderately food insecure (n 621) and severely food insecure (n 322). †Predicted means conditional on number of children <18 years, number of adults 18–64 years and number of seniors ≥65 years in the household set at observed values; means (○) and 95 % CI (represented by horizontal bars) estimated while accounting for the complex survey design. ‡Bonferroni-adjusted P value for linear trend test across household food insecurity status; the linear trend test accounted for the complex survey design
Accounting for household income in the models generally led to a narrowing in the gaps in mean dollars spent and budget shares between the four levels of food insecurity for all categories and sub-categories (Figs 3 and 4). Most of the trends in mean dollars spent and budget shares across household food insecurity status remained once household income was included. However, the downward trends for mean dollars spent on basic needs, other necessities, housing, household/personal care and personal insurance/pension, and the downward trends for the mean budget shares allocated to discretionary, miscellaneous and personal insurance/pension, became non-significant when household income was included in the models.
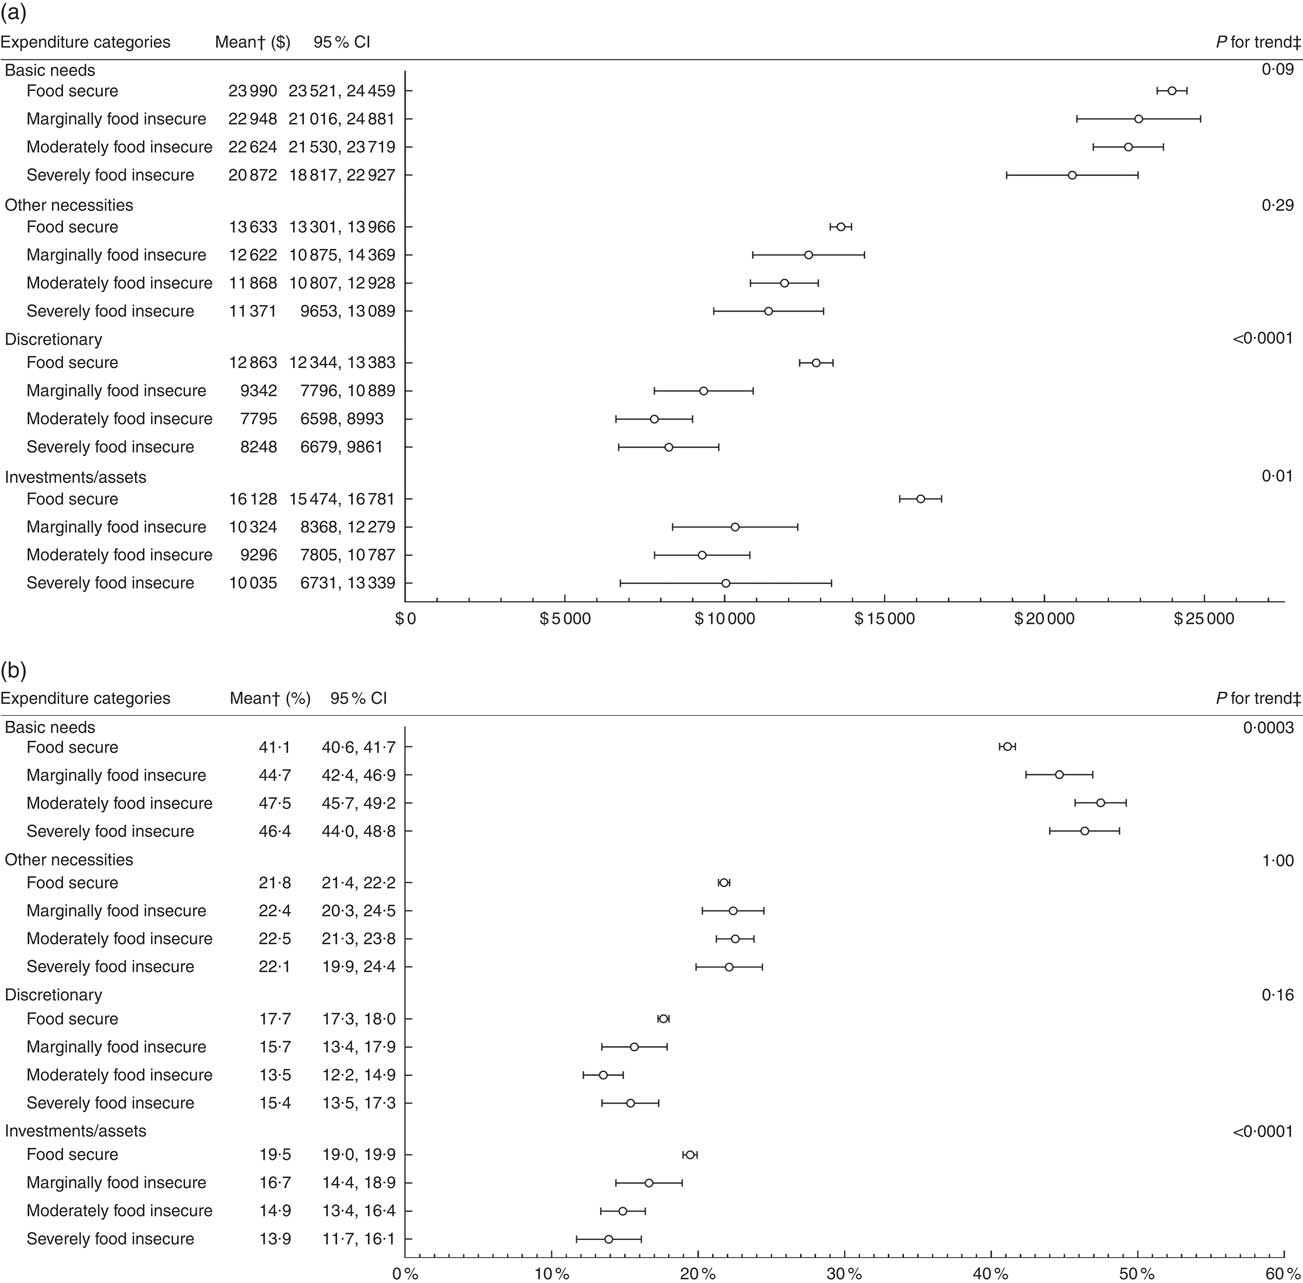
Fig. 3 Mean dollars spent in each expenditure category by household food insecurity status* while controlling for household income (a) and mean budget share allocated to each expenditure category by household food insecurity status* while controlling for household income (b) in a population-based sample of households from the ten provinces of Canada (n 9050), 2010 Survey of Household Spending. All dollar values are $CAN. *Analyses using all households with no missing food insecurity status; food secure (n 7783), marginally food insecure (n 324), moderately food insecure (n 621) and severely food insecure (n 322). †Predicted means conditional on number of children <18 years, number of adults 18–64 years and number of seniors ≥65 years in the household, and quartiles of after-tax household income set at observed values; means (○) and 95 % CI (represented by horizontal bars) estimated while accounting for the complex survey design. ‡Bonferroni-adjusted P value for linear trend test across household food insecurity status; the linear trend test accounted for the complex survey design

Fig. 4 Mean dollars spent in each expenditure sub-category by household food insecurity status* while controlling for household income (a) and mean budget share allocated to each expenditure sub-category by household food insecurity status* while controlling for household income (b) in a population-based sample of households from the ten provinces of Canada (n 9050), 2010 Survey of Household Spending. All dollar values are $CAN. *Analyses using all households with no missing food insecurity status; food secure (n 7783), marginally food insecure (n 324), moderately food insecure (n 621) and severely food insecure (n 322). †Predicted means conditional on number of children <18 years, number of adults 18–64 years and number of seniors ≥65 years in the household, and quartiles of after-tax household income set at observed values; means (○) and 95 % CI (represented by horizontal bars) estimated while accounting for the complex survey design. ‡Bonferroni-adjusted P value for linear trend test across household food insecurity status; the linear trend test accounted for the complex survey design
Discussion
Our results indicate that the spending patterns of households experiencing food insecurity differ considerably from those of food-secure households, with substantially lower expenditures and a prioritization of the essentials. The lower spending of food-insecure households compared with their food-secure counterparts across most of the expenditure groupings examined is consistent with the large body of research demonstrating the numerous ways through which the economic resources of food-insecure households are constrained( Reference Leete and Bania 17 – Reference Willows, Veugelers and Raine 21 , Reference Bartfeld and Dunifon 24 – Reference Coleman-Jensen 27 ). The gap observed in the present study between the mean total expenditures of the food-secure and the marginally, moderately and severely food-insecure households indicates that households experiencing food insecurity have lower overall economic resources available for consumption. Household income represents a primary resource for consumption, and our results suggest that the lower amounts spent on essentials by food-insecure households is a function of their incomes, but the prioritization of the essentials among food-insecure households is not fully explained by their lower incomes.
We found that despite spending less on basic needs, food-insecure households allocated a larger proportion of their budget to these. This prioritization of the budget towards goods and services contributing to basic living highlights the lower relative material well-being of food-insecure households, particularly at the more severe levels of food insecurity. It appears that the prioritization of basic needs was achieved by decreasing the proportion of the budget allocated to discretionary spending and investments/assets. The greatest disparities in mean expenditures between the food-secure and the marginally, moderately and severely food-insecure households were observed for discretionary spending and investments/assets, while the gaps in mean expenditures on basic needs and other necessities tended to be smaller. Similarly, the largest disparities in mean expenditures between the food-secure and the marginally, moderately and severely food-insecure households were for leisure, miscellaneous spending, personal insurance/pension and durables/assets. The spending patterns observed in the present study indicate purchasing decisions that overall favour the essentials when food insecurity is experienced.
The prioritization of basic needs that we observed among households experiencing food insecurity is consistent with the results of earlier research examining the effects of policy interventions that increased the financial resources of lower-income households on their spending patterns( Reference Gregg, Waldfogel and Washbrook 62 , Reference Jones, Milligan and Stabile 74 ). For example, a population-based analysis of child benefits in Canada showed that income supplements provided to low-income families led to higher expenditures on food, rent, childcare, education and transportation( Reference Jones, Milligan and Stabile 74 ). These shifts in household expenditures following income-based interventions are consistent with findings from a growing number of studies from Canada and the USA that have reported reductions in food insecurity in conjunction with policy interventions that improve the economic resources of lower-income households via cash or in-kind benefits( Reference Loopstra, Dachner and Tarasuk 30 – Reference McIntyre, Dutton and Kwok 32 , Reference Schmidt, Shore-Sheppard and Watson 75 , Reference Kreider, Pepper and Gundersen 76 ).
Consistent with previous US studies( Reference Coleman-Jensen 27 , Reference Cristofar and Basiotis 42 – Reference Coleman-Jensen, Rabbitt and Gregory 46 ), mean food expenditures tended to decline with severity of food insecurity. However, the budget share allocated to food was similar among all four levels of food insecurity, suggesting that food expenditures tended to decline proportionally with total expenditures across food insecurity status. Economic theory posits that the proportion of the budget allocated to food generally increases as total economic resources decline( Reference Deaton 56 , Reference Chai and Moneta 60 ), but the absence of a trend in the budget share for food in our study may be because the experience of food insecurity indicates compromised food access, with more severe levels of food insecurity reflecting greater food compromises. The inclusion of household income had minimal impact on the patterns observed across household food insecurity status for the dollars spent on food and the proportion of the budget allocated to food, suggesting that these patterns, especially the lower expenditures, are specific to the experience of food insecurity, rather than to the lower income generally associated with food insecurity.
Our finding that the budget share for food is similar across levels of food insecurity raises serious questions about the validity of using the proportion of total spending allocated to food as a proxy for household food security, which is an established practice in the UK( 77 ). While our finding needs to be confirmed in other country contexts, it highlights the importance of a direct measurement of household food insecurity to monitor the magnitude of the problem.
We found that despite a downward trend in housing expenditures across severity of food insecurity, there was an upward trend in the budget share allocated to housing. These results may indicate that housing expenditures represent a financial burden that cannot easily be reduced to accommodate lower economic resources, which is consistent with ecological studies from Canada and the USA showing a positive association between area-level housing cost and risk of food insecurity( Reference Bartfeld and Dunifon 24 , Reference Sriram and Tarasuk 25 , Reference Fletcher, Andreyeva and Busch 33 ). The downward trends in the budget shares allocated to the sub-categories of personal insurance/pension, durables/assets and miscellaneous spending imply a lower prioritization of these goods and services among households experiencing food insecurity. While previous studies have found that households with lower assets and savings are more vulnerable to food insecurity( Reference Leete and Bania 17 – Reference McIntyre, Wu and Fleisch 20 ), our results indicate that during periods of food insecurity, households spend disproportionately less on goods and services that can contribute to future financial security (e.g. pension, personal insurance and durables).
Our results suggest that household income partly contributed to the gaps in mean dollars spent and budget shares observed between levels of food insecurity for all categories and sub-categories, yet many differences in the spending patterns of food-secure and food-insecure households were not fully explained by differences in household income. The lower amounts spent on other necessities and basic needs, especially housing, by food-insecure households appear to have been a function of their incomes, but the allocation of a greater proportion of their budget towards basic needs persisted despite the inclusion of income. In contrast, the lower expenditures on investments/assets, particularly for durables/assets, and discretionary spending among food-insecure households remained after controlling for income, but only the downward trend in mean budget shares for investments/assets stayed significant. The persisting differences in the spending patterns of food-secure and food-insecure households after the inclusion of income may suggest that prioritizing basic needs is inherent to the experience of food insecurity.
The spending patterns observed by household food insecurity status reveal that marginally food-insecure households are more similar in their expenditures to moderately and severely food-insecure households than to food-secure households. This finding is consistent with a growing number of studies indicating that households affirming any item(s) on the HFSSM are distinct from fully food-secure households (i.e. those with zero affirmatives) in terms of their sociodemographic profiles( Reference Coleman-Jensen 27 ), vulnerability to other forms of material hardship( Reference Loopstra and Tarasuk 55 ) and risk of poor health outcomes( Reference Whitaker, Phillips and Orzol 9 , Reference Cook, Black and Chilton 11 , Reference Jessiman-Perreault and McIntyre 13 – Reference Tarasuk, Cheng and de Oliveira 15 ). This highlights the importance of including households experiencing a marginal level of food insecurity among the food-insecure rather than the food-secure households to avoid underestimating the magnitude of the problem of household food insecurity and its consequences.
To date, few studies have examined the differences in the economic circumstances of food-insecure households along the severity continuum. Evidence suggests that the odds of experiencing different material hardships rise with the severity of food insecurity( Reference Loopstra and Tarasuk 55 ) and that the severity of food insecurity declines with a gain in employment( Reference Loopstra and Tarasuk 28 ), an increase in income( Reference Loopstra and Tarasuk 28 ) and greater savings and assets( Reference Huang, Guo and Kim 18 , Reference Guo 19 ). However, our results indicate considerable similarity in the spending patterns of the marginally, moderately and severely food-insecure households. There are some visible trends in the estimated means across the three groups, particularly when examining dollars spent, but the much smaller number of households in each group led to less precise estimates and significant overlap in the confidence intervals. Using a survey with a larger sample of food-insecure households would likely lead to greater differences in spending patterns. However, it is possible that the reference periods used to measure the expenditure data led to more similarities than differences among the three food-insecure groups. The measurement of food insecurity captures the worst experience in the last 12 months, but it is likely that the severity of food insecurity fluctuates over those 12 months. The reference periods for which the expenditures were reported may not reflect actual spending at the time when the most severe experience of food insecurity occurred.
There is a long history of using household consumption derived from expenditure data as an indicator of material well-being( Reference Deaton 56 – Reference Kaushal, Gao and Waldfogel 63 ). However, the SHS lacked information on the prices faced by the households and on the quality of the goods and services purchased, meaning that the expenditures in the present study were a proxy rather than a direct measure of consumption. Lower expenditures among the food-insecure households compared with their food-secure counterparts may not reflect lower consumption of goods and services if they faced lower prices. Yet, it appears unlikely that the food-insecure households comprising this population-based sample faced systematically lower prices across all goods and services, given the evidence from Canada and the USA that living in areas with higher housing( Reference Bartfeld and Dunifon 24 , Reference Sriram and Tarasuk 25 , Reference Fletcher, Andreyeva and Busch 33 ), utility( Reference Emery, Bartoo and Matheson 34 ) and food( Reference Gregory and Coleman-Jensen 23 ) prices is associated with greater risk of food insecurity.
Measurement error in expenditure data is an important consideration, but the extent to which measurement error varies by household food insecurity status is unknown. Generally, longer reference periods increase the risk of recall bias whereas shorter reference periods tend to increase the variance of the estimates( Reference Deaton 56 ). To increase the accuracy of the expenditures reported by respondents, Statistics Canada uses different reference periods (e.g. last 2 weeks for common expenditures like food or last 12 months for infrequent expenditures like large durables) and the expenditures are subsequently annualized. Most of the aggregates created in the present study were susceptible to the limitations of both short and long reference periods since they included expenditures reported for different periods. While the categories and sub-categories created were to some extent arbitrary, we attempted to group individual expenditures into commonly understood and referenced categories and to be as conservative as possible in the expenditures included in basic needs and other necessities. We also separated, when possible, expenditures on non-durables and durables or longer-term investments, since they contribute to consumption and living standards differently( Reference Deaton 56 , Reference Deaton and Zaidi 57 ).
For some households in the sample, the annual income used in the analyses may not have reflected the income available during the 12-month period for which food insecurity and the expenditures were measured, because SHS collects income data for the year prior to the survey. Given the evidence that household food insecurity is associated with income shocks( Reference Leete and Bania 17 ), these differences in the timing of the measurements may have led to an overestimation of the income of food-insecure households and larger differences in the spending of the food-secure and food-insecure households when controlling for income. Future research should be conducted with contemporaneous measures of income, food insecurity and expenditures to further examine the influence of income on the resource allocation of food-insecure households. Our analyses controlled for household composition, household size and income, but spending decisions may be affected by other household characteristics also associated with food insecurity (e.g. disability, employment, home ownership). Since different household characteristics likely affect certain categories of spending but not others and the direction of effects may vary by category, it is unclear how the inclusion of such variables would affect our results. Although more research is needed to better characterize the relationship between household food insecurity and specific expenditure categories, evidence that food insecurity is a managed process associated with deliberated trade-offs( Reference Cook, Black and Chilton 11 , Reference Campbell and Desjardins 36 – Reference Knowles, Rabinowich and Ettinger de Cuba 41 , Reference Ouellette, Burstein and Long 47 – Reference Loopstra and Tarasuk 55 , Reference Radimer, Olson and Campbell 78 , Reference Hadley and Crooks 79 ) would suggest that, irrespective of other household characteristics, the prioritization of basic needs is an integral part of the experience of food insecurity.
To our knowledge, the present study is the first population-based analysis of a broad spectrum of household expenditures in the context of food insecurity in an affluent country. Our work adds to previous research on the relationship between discrete expenditure categories and household food insecurity( Reference Coleman-Jensen 27 , Reference Cristofar and Basiotis 42 – Reference Coleman-Jensen, Rabbitt and Gregory 46 , Reference Kirkpatrick and Tarasuk 49 ) by examining not only the amount spent in different categories but also the proportion of the budget allocated to these, and by considering the severity of food insecurity. The distinct spending patterns observed in the present study indicate that households experiencing food insecurity, including the most marginal level, prioritize essential needs above all else. Our findings lend support to evidence showing that food insecurity is related to constrained financial resources and add to prior qualitative( Reference Tarasuk 37 – Reference Knowles, Rabinowich and Ettinger de Cuba 41 ) and quantitative( Reference Cook, Black and Chilton 11 , Reference Ouellette, Burstein and Long 47 – Reference Loopstra and Tarasuk 55 ) studies documenting the coexistence of food insecurity with compromises in numerous domains of consumption. The pervasiveness of the material deprivation experienced by food-insecure households and the myriad of poor health outcomes related to food insecurity stress the importance of developing effective policy interventions that improve the economic resources of vulnerable households.
Acknowledgements
Financial support: The present work was supported by a programmatic grant in Health and Health Equity from the Canadian Institutes of Health Research (FRN: 115208). The Canadian Institutes of Health Research had no role in the design, analysis or writing of this article. Conflict of interest: None. Authorship: A-A.F.S.G. and V.T. conceived and designed the study, interpreted the data and wrote the manuscript. A-A.F.S.G. conducted the statistical analyses. Both authors read and approved the final manuscript. Ethics of human subject participation: Ethics approval for the present study was obtained from the University of Toronto’s Health Sciences Research Ethics Board.
Supplementary material
To view supplementary material for this article, please visit https://doi.org/10.1017/S1368980018000472


