


In New Zealand (NZ) it is projected that by 2026, 15 % of the population will be people of Asian ethnicity, a level similar to that projected for the Māori population, the indigenous people of NZ( 1 ). Nutrition-related health issues among ‘Asian’ immigrants to Western countries has been a topic of investigation in recent years( Reference Wahlqvist 2 – Reference Kolt, Schofield and Rush 8 ). Research has indicated an elevated risk for type 2 diabetes and CHD among South Asian immigrants( Reference Kuppuswamy and Gupta 9 – Reference Garduno-Diaz and Khokhar 14 ) and cancers among Chinese immigrants( Reference Hanley, Choi and Holowaty 15 , Reference Virk, Gill and Yoshida 16 ).
Although migrants can be relatively healthier than the resident population on arrival, there is evidence that longer duration of residence can mitigate the healthy migrant status( Reference Harding 17 , Reference Creatore, Moineddin and Booth 18 ). Numerous factors synergistically contribute towards this process, and changes in dietary patterns have been identified as an important independent risk factor for the development of chronic diseases among South Asian( Reference Gilbert and Khokar 5 , Reference Garduno-Diaz and Khokhar 14 , Reference Dekker, Snijder and Beukers 19 – Reference Eapen, Karla and Merchant 21 ) and Chinese( Reference Tam, Martin and Hislop 22 ) migrants. The negative consequences of changed dietary patterns and acculturation have been observed among first-generation migrants( Reference Huang, Rodriguez and Burchfiel 23 – Reference Satia 25 ) and among subsequent generations( Reference Smith, Kelly and Nazroo 26 , Reference Edwards, Murphy and Feltbower 27 ).
There is a long history of Asian migration to NZ. However, few studies have reported dietary patterns and nutrient intakes of this growing sector. The 1977 National Diet Survey( Reference Birkbeck 28 ), the 1989 Life in NZ survey( Reference Howarth, Parnell and Birkbeck 29 ) and the 1997 National Nutrition Survey( Reference Russel, Parnell and Wilson 30 ) reported dietary intakes of adult New Zealanders. However, no attempt was made in these surveys to provide representative samples to report dietary intakes of Asians. In NZ the Diabetes Heart and Health Study was probably the first to report dietary intakes for Asian adults and indicated that Asians consumed more dietary cholesterol and less Ca and alcohol than Europeans( Reference Metcalf, Scragg and Schaaf 4 ). However, reporting results for ‘Asians’ as an ethnic category is problematic, as they are a heterogeneous group. Combining them in a single ‘Asian’ category averages out subgroup differences and masks important distinctions( Reference Rasanathan, Craig and Perkins 31 ). The aims of the present paper were to profile ‘Asian’ participants of the 2008/09 Adult National Nutrition Survey (NZANS) and report dietary habits, nutrient intakes and health outcomes of Asian subgroups separately to gain some understanding of similarities and differences between these groups resident in NZ. It also aimed to report significant differences within the Asian subgroups according to duration of residence and compare the two Asian subgroups, South Asians (SA) and East and South-East Asians (ESEA), with the New Zealand European and Other (NZEO) group.
Methods
Study design and sample
The 2008/09 NZANS was a cross-sectional survey of NZ adults (15 years and older). A three-stage, stratified, probability-proportional-to-size sample design was used with an overall response rate of 61 % (n 4721). To ensure adequate sample sizes to make comparisons, the Māori and Pacific ethnic groups and the age groups 15–18 years and 71 years and older were over-sampled. The study was conducted according to the guidelines laid down in the Declaration of Helsinki and all procedures involving human participants were approved by the Multi-Region Ethics Committee. Written informed consent was obtained from all participants. A computer-based interviewer-administered questionnaire was used to collect information on dietary habits, nutrition-related health and demographics. A full description of the methods is available elsewhere( 32 ).
Demographic information and ethnicity
Information on ethnicity was collected using the Statistics New Zealand standard ethnicity question. For the present research, if participants reported belonging to two or more groups they were assigned to a single group using the following order: (i) South Asian (SA); (ii) East and South-East Asian (ESEA); (iii) Māori; (iv) Pacific; and (v) New Zealand European and Others (NZEO). For example, if a participant reported he/she was Māori and East Asian he/she was coded as East Asian. Data from participants coded as Māori and Pacific are not presented in this paper. Included in the SA group were participants who self-identified as Indian, Bangladeshi, Nepalese, Pakistani, Fiji Indian, Afghani and Sri Lankan; and in the ESEA group participants who reported they were Chinese (includes Malaysian, Hong Kong, Cambodian, Singaporean and Vietnamese Chinese), Malaysian, Taiwanese, Filipino, Cambodian, Vietnamese, Burmese, Indonesian, Thai, Japanese, Korean and Tibetan. The ‘Others’ in the NZEO group includes all other ethnicities mainly Latin American and African.
Participants reported their highest school-level qualification, and if applicable their highest post-school qualification (greater than 3 months’ study or training). Four groups were derived: (i) no school or post-school qualifications; (ii) school qualifications only; (iii) trade or technical qualifications; and (iv) post-school qualifications (professional or tertiary).
The NZ Index of Deprivation (NZDep06) was used to measure socio-economic status. This is an area-based measure and reflects eight dimensions of material deprivation( Reference Salmond, Crampton and Atkinson 33 ). For the purposes of the 2008/09 NZANS deprivation scores were divided into quintiles.
Duration of residence
Participants who reported they were not born in NZ were asked the year they arrived in NZ. Duration of residence was categorized into a dichotomous variable: (i) <10 years of residence (recent migrants); and (ii) ≥10 years of residence and NZ born (long-term migrants). Statistically significant differences in dietary habits and nutrient intakes according to duration of residence have been reported in the text but are not included in the respective tables.
Dietary habits
Participants were asked about their frequency of consumption of selected foods in the ‘past four weeks’.
Nutrient intakes
A four-stage 24 h diet recall was administered by trained interviewers using LINZ24 (a computer software system)( 32 ). Of those completing one diet recall a randomly selected sub-sample (25 %) also completed a second 24 h diet recall; however, mean nutrient intakes were calculated from the first day of recall only because of inadequate numbers of repeat recalls in the Asian groups. Energy and nutrient intakes were determined using a tailored and expanded version of the New Zealand Food Composition Database( 32 ).
Biochemical/blood indices
A non-fasting venous blood sample was provided by a total of 3348 participants (not pregnant) and 3315 provided a spot urine sample. Full details on the analytical methods for all biochemical analyses are available elsewhere( 32 ). Concentrations of glycated Hb (HbA1c), total cholesterol, HDL-cholesterol, serum ferritin, Hb, serum Fe, and red blood cell (RBC) and serum folate were reported.
Iron and folate status
Low Hb was defined as: <136 g/l (15–19 years, males); <137 g/l (20–49 years, males); <133 g/l (50–69 years, males); <124 g/l (70+ years, males); <120 g/l (15–69 years, females); and <118 g/l (70+ years, females). Fe deficiency with or without anaemia was defined as serum ferritin <12 μg/l and Zn protoporphyrin >60 μmol/mol. Fe deficiency with anaemia was defined as serum ferritin <12 μg/l and Zn protoporphyrin >60 μmol/mol and low Hb. Low RBC folate was defined as <317 nmol/l and low serum folate as <6·8 mmol/l.
Blood pressure
Diastolic and systolic blood pressures were measured on non-pregnant participants by trained interviewers using an OMRON HEM907 instrument. Three measurements were taken and the mean of the second and third measurements was used.
Diagnosed diabetes
Participants were asked ‘Have you ever been told by a doctor that you have diabetes?’ Those answering affirmatively were categorized as having ‘doctor diagnosed diabetes’.
Anthropometric measurements
Two measurements for height and weight were made for each participant. If the measurements differed by 1 %, then a third measurement was taken. WHO BMI cut-offs were used to classify participants over 19 years of age into underweight (BMI<18·5 kg/m2), normal (BMI=18·5−24·99kg/m2), overweight (BMI=25·0–29·99 kg/m2) and obese (BMI ≥ 30·0 kg/m2)( 34 ). Due to small numbers the underweight category was collapsed into the normal category (BMI<25·0kg/m2). Sex- and age-specific cut-offs were used for participants aged 15–18 years( Reference Cole, Bellizzi and Flegal 35 ).
The prevalence of overweight and obesity were also defined using ethnic-specific cut-offs( 36 ) as evidence indicates obesity is under-diagnosed using standard WHO guidelines among ‘Asian’ people( Reference Vasudevan, Stotts and Mandayam 37 ). For SA and ESEA participants over 19 years the following cut-offs were used: normal (BMI<23·0 kg/m2), overweight (BMI=23·0–24·99 kg/m2) and obese (BMI≥25·0 kg/m2). To define overweight and obesity in Asian participants aged 15–18 years, sex- and age-specific cut-offs were used( Reference Jiang, Cole and Pan 38 ).
Statistical analysis
For all analyses survey commands were used to allow for the complex survey design, including sampling weights and primary sampling units. Results reported were weighted to reflect population estimates. Separate analyses were conducted for males and females. The χ 2 test was used to examine the associations between categorical dietary habit variables and ethnicity.
Linear regression was used to compare nutrient intakes by ethnicity, with age as a covariate. Nutrient intakes (apart from percentage of energy) were positively skewed and therefore were transformed using the natural log transformation to normalize them. Therefore geometric means are reported for all nutrients apart from percentage of total energy from fat, saturated fat, polyunsaturated fat, monounsaturated fat, carbohydrate and protein. Linear regression with adjustment for age was used to compare serum total cholesterol, HDL-cholesterol, Hb, ferritin, serum folate, RBC folate, HbA1c and blood pressure. Logistic regression, with adjustment for age, was used to examine the relationship between dichotomous blood and health indices, overweight, obesity and ethnic group. For ESEA males there were no observations for low Fe stores (<12 µg/l), Fe deficiency, Fe-deficiency anaemia, low serum folate (<6·8 mmol/l), high HbA1c (≥6·5 %) and diagnosed diabetes; therefore a comparison could not be made with other ethnic groups using logistic regression. Similarly for ESEA females there were no observations for low RBC folate (<317 nmol/l).
For nutrient intakes and dietary habits, analyses were repeated for SA and ESEA with comparison by duration of residence. All statistical analyses were conducted using the Stata statistical software package version 12. All statistical tests were two-sided and P<0·05 was considered statistically significant in all cases.
Results
The percentage of ‘Asian’ participants (9·8 %) was comparable to that in the NZ population, based on the estimates for 2006 by Statistics New Zealand (11 %) and calculated by excluding Māori and Pacific Peoples( 39 ). More ESEA and SA were younger compared with NZEO (P<0·001). Although ESEA and SA were more likely to have higher educational qualifications than NZEO (P<0·001), the percentage of ‘Asians’, especially SA, living in deprived areas was high (P=0·003). The majority of ‘Asian’ participants were migrants who had lived in NZ for less than 10 years (i.e. recent migrants; P<0·001; Table 1).
Table 1 Sample characteristics by ethnicity (n 2995)Footnote *, 2008/09 Adult National Nutrition Survey, New Zealand
SA, South Asians; ESEA; East and South-East Asians; NZEO, New Zealand Europeans and Others.
*
Number of those with 24 h diet recall data (excluding Pacific and
 $$\tf="Helvitica_font_roman" M \bar aori}$$
participants).
$$\tf="Helvitica_font_roman" M \bar aori}$$
participants).
† Weighted percentage.
‡ P value from χ 2 test.
§ NZDep06, 2006 New Zealand Index of Deprivation, is an area-based measure of deprivation.
Dietary habits
There were significant differences between ethnic groups with respect to meeting the dietary guidelines for fruits and vegetables, bread consumption, milk consumption, meat consumption and preparation, and alcohol use (Table 2).
Table 2 Dietary habits and alcohol consumption by gender and ethnicity (n 2995), 2008/09 Adult National Nutrition Survey, New Zealand
SA, South Asians; ESEA; East and South-East Asians; NZEO, New Zealand Europeans and Others; M, males; F, females.
* P value from χ 2 test.
† Other milk includes cow’s milk alternatives such as rice milk and soya milk.
‡ Only includes those reporting alcohol consumption.
§ Percentage significantly different compared with NZEO.
|| Percentage significantly different between the Asian subgroups.
In particular, meeting the dietary guidelines for fruit and vegetables (5+ a day) was low for ESEA males (9 %) in comparison to SA (32 %; P=0·011) and NZEO (40 %; P=0·000) males; and for SA females (15 %) in comparison to ESEA (35 %; P<0·05) and NZEO (55 %; P<0·001) females.
While ESEA males were the group most likely to eat chicken ‘three or more times per week’, SA females were the group most likely to ‘never’ eat chicken (26 %), red meat (25 %) and processed meat (55 %; P<0·05; Table 2). Among males, SA males were the group who most often ‘never’ ate red meat (21 %). Among males, both SA and ESEA were more likely to ‘never’ eat processed meat compared with NZEO males (P<0·05; Table 2). Among males, recent SA migrants were more likely to ‘never’ consume processed meat (60·2 %; 95 % CI 44·3, 76·2 %) compared with long-term migrants (26·5 %; 95 % CI 5·0, 47·8 %; P=0·009).
With respect to removing fat from meat and from chicken, SA males and females were more likely to do this compared with NZEO males and females (P<0·05; Table 2).
Fast food (‘more than three times per week’) was reported by 19 % of SA males compared with 7 % of NZEO males. In contrast among females, the SA ethnic group seldom consumed fast food (P=0·014; Table 2).
Nutrient intakes
Age-adjusted mean nutrient intakes are reported by sex in Table 3. SA males had lower intakes of energy, fat, saturated fat (all P<0·05) and percentage of energy from fat (P<0·05) and saturated fat (P<0·001), and higher percentage of energy from carbohydrate (P<0·05), compared with NZEO males. Cholesterol intake was also lower compared with NZEO (P<0·01). Similarly, SA females had lower intakes of energy (P<0·01), protein (P<0·001), fat (P<0·01), monounsaturated fat (P<0·001) and higher percentage of energy from carbohydrate (P<0·01) compared with NZEO females. SA females also had lower energy (P<0·05), protein (P<0·01) and monounsaturated fat (P<0·05) intakes compared with ESEA females. Males (P<0·001) and females (P=0·003) of both Asian subgroups had lower intakes of saturated fats compared with NZEO. Both ESEA males and females had higher percentage of energy from protein (P<0·05) and carbohydrate (P<0·05) compared with NZEO (Table 3).
Table 3 Mean daily nutrient intakes (age-adjusted) by gender and ethnicity (n 2995), 2008/09 Adult National Nutrition Survey, New Zealand
SA, South Asians; ESEA; East and South-East Asians; NZEO, New Zealand Europeans and Others; M, males; F, females; %TE, percentage of total energy; RE, retinol equivalents.
Geometric mean reported for all nutrients apart from %TE.
* P value for the association between nutrient intake and ethnicity.
† Mean value significantly different compared with NZEO.
‡ Mean significantly different between Asian subgroups.
Both SA males and females reported lower intakes of vitamin B12, Se, niacin and retinol compared with NZEO (P<0·05). In addition, SA males reported lower intakes of Ca, riboflavin, vitamin B6 and vitamin A compared with NZEO males (P<0·05). SA females reported lower intakes of K and Zn compared with NZEO females (P<0·05). Compared with ESEA, mean vitamin B12, Se, Zn (all P<0·001) and niacin intakes (P<0·01) were lower for SA females. The micronutrient intake of ESEA males and females was also lower compared with NZEO for retinol, thiamin and Ca (P<0·05; Table 3). Furthermore, mean intakes of vitamin A (P<0·001) and riboflavin (P<0·05) were lower for ESEA males compared with NZEO males.
Recent SA male migrants had higher intakes of carbohydrate (288 g v. 234 g; P=0·036), dietary fibre (21 g v. 17 g; P=0·008), retinol (225 µg v. 133 µg; P=0·027) and Ca (690 v. 492 mg; P=0·012) than long-term migrants.
Biochemical and blood indices
There was no difference in the levels of serum total cholesterol and HDL-cholesterol among males and females (Table 4). In general, indices of Fe status were lower for SA compared with NZEO. A higher percentage of SA males had low Fe stores (17 %), were Fe deficient (12·7 %) or were categorized with Fe-deficiency anaemia (4·5 %) compared with NZEO (P<0·05). ESEA females had lower Hb levels compared with NZEO females (P<0·05; Table 4).
Table 4 Blood indices and prevalence of diagnosed diabetes and blood pressure (age-adjusted) by gender and ethnicity, 2008/09 Adult National Nutrition Survey, New Zealand
SA, South Asians; ESEA; East and South-East Asians; NZEO, New Zealand Europeans and Others; M, males; F, females; RBC, red blood cell; HbA1c, glycated Hb.
* Mean or percentage significantly different compared with NZEO.
† Mean or percentage significantly different between Asian subgroups.
‡ Analyses not adjusted for age due to lack of observations.
Mean RBC folate concentrations were similar among all three ethnic groups for males and females (males P=0·355; females P=0·916). The percentage of SA males with low RBC folate concentration was higher than NZEO (P<0·005) and ESEA males (P<0·005; Table 4).
Among females the prevalence of diagnosed diabetes was significantly higher (P<0·001) among SA (20·5 %) compared with ESEA (0·3 %) and NZEO females (2·8 %). None of the ESEA males reported having diabetes and SA males reported a significantly higher prevalence of diagnosed diabetes compared with NZEO males. Mean HbA1c level among SA males (6·1 %) was higher than that among ESEA (5·6 %; P<0·05) and NZEO (5·5 %; P<0·05) males. Twenty-seven per cent of SA males (>NZEO; P<0·010) and about 24 % of SA females had HbA1c levels equal to or above 6·5 % (Table 4).
Mean diastolic and systolic pressure was similar among males and females of the three ethnic groups.
Body size
Figure 1(a) and (b) presents the age-adjusted prevalence of overweight and obesity among males and females by ethnicity using standard cut-offs and ethnic-specific cut-offs. Using standard cut-offs (Fig. 1(a)), SA males and females were more likely to be overweight compared with ESEA (P<0·05) but were similar to NZEO. ESEA males and females had lower prevalence of being overweight and obese compared with NZEO (P<0·05).
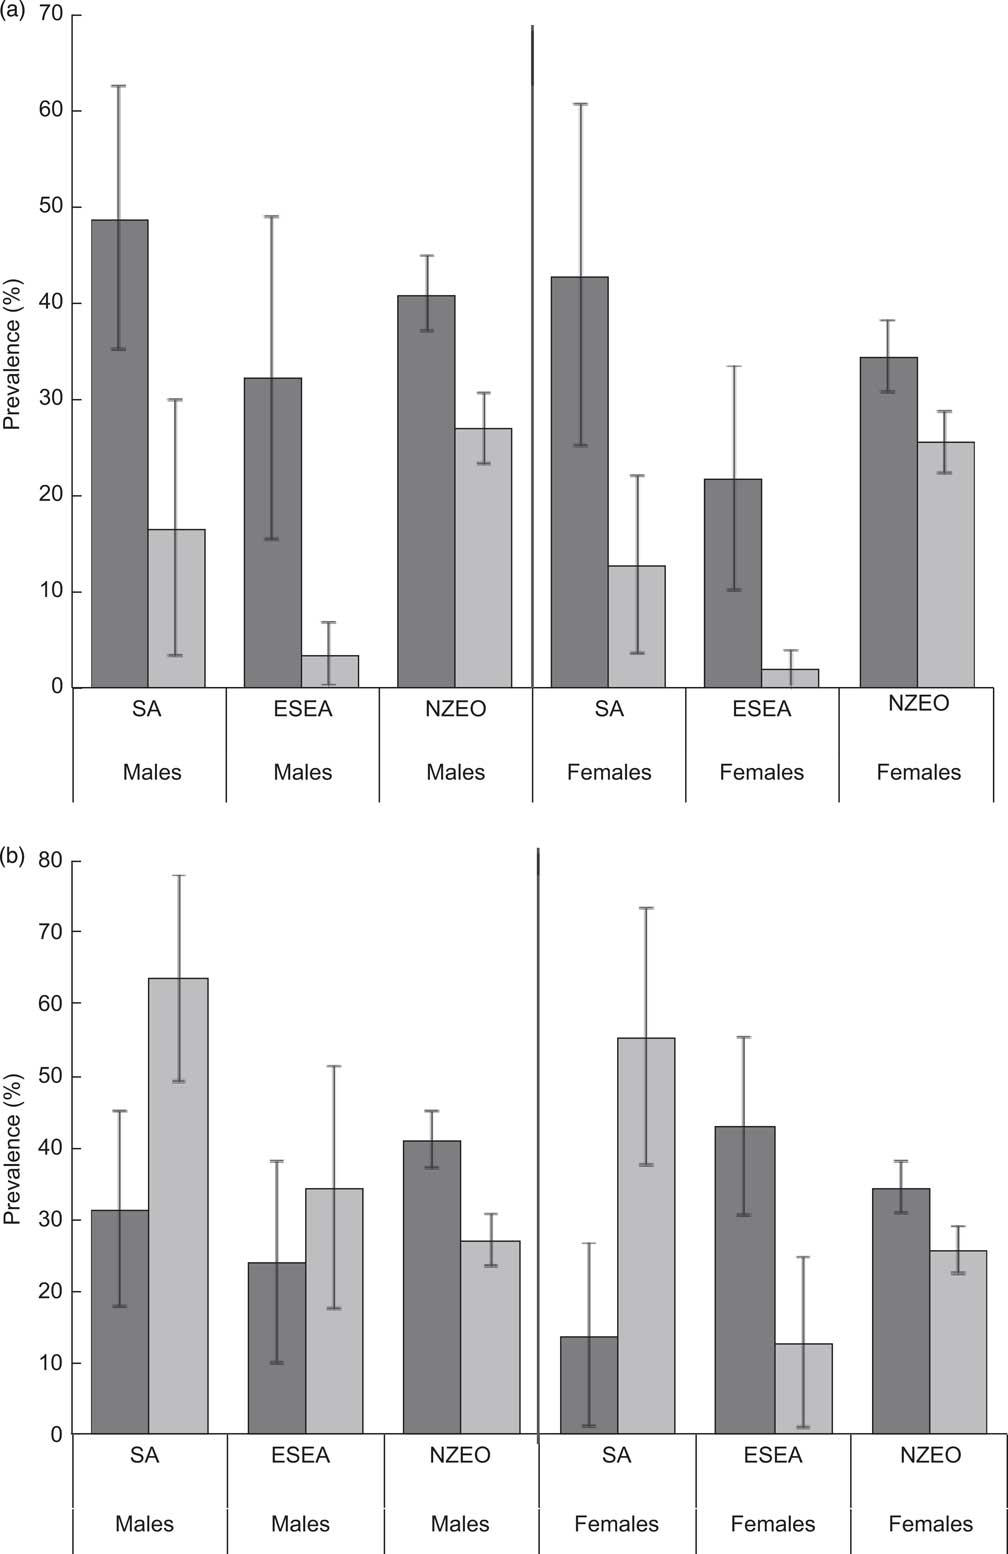
Fig. 1 Percentage of (age-adjusted) overweight (![]() ) and obesity (
) and obesity (![]() ) by gender and ethnicity (SA, South Asians; ESEA; East and South-East Asians; NZEO, New Zealand Europeans and Others), using (a) standard cut-offs and (b) ethnic-specific cut-offs, among adults aged 15 years and older (n 2995), 2008/09 Adult National Nutrition Survey, New Zealand. Values are means with their 95 % confidence intervals represented by vertical bars
) by gender and ethnicity (SA, South Asians; ESEA; East and South-East Asians; NZEO, New Zealand Europeans and Others), using (a) standard cut-offs and (b) ethnic-specific cut-offs, among adults aged 15 years and older (n 2995), 2008/09 Adult National Nutrition Survey, New Zealand. Values are means with their 95 % confidence intervals represented by vertical bars
Using ethnic-specific cut-offs increased the prevalence of obesity among the Asian subgroups (Fig. 1(b)). Higher percentage of SA males (66 %) was obese when compared with ESEA (37 %; P<0·05) and NZEO (27 %; P<0·001) males. Among females 56 % of SA were obese, which was higher than both ESEA (22 %; P=0·007) and NZEO (25 %; P=0·003).
Discussion
The results presented in the current paper are unique, and report nutrient intakes, dietary habits and health outcomes from national survey data for South Asians and East/South-East Asians separately. Such analysis has enabled comparisons between the two Asian subgroups, thereby providing new knowledge on similarities and differences in dietary intakes and health outcomes. Some significant differences according to duration of residence have also been reported, particularly for SA males.
A different dietary profile was evident for the Asian subgroups with higher percentage of energy from carbohydrate than NZEO due to their predominantly carbohydrate-based diets. A unique aspect of the SA subgroup was that, in contrast to ESEA, SA reported consuming lower amounts of meat, poultry and processed meats than NZEO. Consequently, SA also had lower intakes of fat, protein (among females), saturated fat and cholesterol (among males). Vitamin and mineral intakes, namely retinol, niacin, vitamin B12 and Zn, were also lower among SA females.
Given the high percentage of SA reporting they never eat red meat or chicken (Table 2), it is not surprising that biochemical indices of Fe status were poorer for SA males and females (although not statistically significant in females). Dietary Fe intake was not significantly lower in SA but it is likely to be coming from non-haem sources and therefore is not as bioavailable. Having an ‘Asian dietary pattern’ has been found to be a risk factor for suboptimal Fe status in women of childbearing age( Reference Beck, Kruger and Conlon 40 ). However, the results of our study seem to imply that suboptimal Fe status is more likely to be associated with SA dietary patterns only and not ESEA. These results highlight the importance of accounting for variations in dietary patterns within Asian subgroups to understand their diet-related disease risk factors.
Consistent with other New Zealand( Reference Metcalf, Scragg and Schaaf 4 ) and Australian research( Reference Zhang, Hsu-Hage and Wahlqvist 41 ), Ca intakes were lower among SA males and ESEA males and females compared with NZEO. Further examination of the food groups reported in the 24 h diet recall (data not shown) reveals that SA and ESEA males and females were less likely to report cheese and ESEA were less likely to report milk and other dairy products compared with NZEO. This may partly explain the lower Ca intakes of the Asian subgroups.
No ethnic differences were observed for serum cholesterol levels among males. However, in the NZ Health Survey (NZHS), SA males had twice the risk for hypercholesterolaemia( Reference Scragg 42 ). On further examination of the data in the current study, it was found that the percentage of SA males on medication was double that of NZEO; however as the number of SA was small (n 7; data not shown), it was not feasible to analyse excluding those on medication.
Consistent with the results of the NZHS( Reference Scragg 42 ), lower proportions of the Asian subgroups met the recommendation for servings of fruits and vegetables. However, caution should be exercised in interpreting these results from the dietary habits questionnaire because this recommendation is based on serving sizes, the concept of which may vary within Asian subgroups as well as between Asians and Europeans. Higher percentages of SA females and SA males had poor RBC folate status and poor serum folate status, respectively, which provides some evidence for lower fruit and vegetable intakes in the SA subgroup. Both serum folate and RBC folate concentrations were reported as the former is indicative of recent folate intake and the latter reflects long-term folate status( Reference Gibson 43 ).
In contrast to females, SA males were more likely to consume fast food ‘more than three times per week’ than NZEO. The reason for this observed gender difference is unclear and warrants further investigation, especially as SA males are at high risk for diet-related chronic diseases( Reference Gibson 43 ).
Although some of the differences observed did not reach statistical significance due to small sample size, the magnitude of the prevalence of diagnosed diabetes among SA in comparison with ESEA and NZEO cannot be ignored. Results from the NZHS also corroborate these findings as the prevalence of diabetes among SA (no gender differences were reported) was 12 %( Reference Scragg 42 ). Prevalence of diabetes in a national study in the USA was 17·4 % among Asian Indians( Reference Kanya, Wassel and Mathur 13 ). These findings are consistent with those observed in India, which leads the world in the number of diabetic cases( Reference Wild, Roglic and Green 44 ). Although the primary driver of the diabetic epidemic in India is nutrition transition( Reference Misra, Singhal and Sivakumar 45 ), there is some evidence that genetic predisposition also plays a role( Reference Radha and Mohan 46 ).
Using ethnic-specific cut-offs, the prevalence of obesity among the SA males and females was much higher than among NZEO and ESEA females (P<0·01). A linear relationship was observed between duration of residence and the prevalence of overweight and obesity (combined) in the NZHS( Reference Scragg 42 ). However, this was not observed in the current study; our findings were similar to those observed among migrants from India and South-East Asia in a US study( Reference Oza-Frank and Venkat Narayan 47 ) and in a small sample of SA women in Australia( Reference Gallegos and Nasim 48 ).
A strength of the present study is the inclusion of biochemical indices, dietary habits, nutrient intakes and anthropometry which together provide an overview of nutritional status. A limitation of the study is the small sample size in the Asian subgroups, especially for biochemical indices. Furthermore, adjustments for potential confounders such as age were not possible for some analyses. Similarly, a lack of SA and ESEA participants in the repeat 24 h recall also limited the study from reporting usual nutrient intakes and hence calculating the probability of inadequate nutrient intakes. A single 24 h diet recall does not capture usual intake; however, ‘means’ are adequate for making comparisons between subgroups of the population( Reference Khokhar, Pandor and Cade 50 ) but may provide unreliable results with smaller numbers. As with other types of self-reported dietary assessment, under-reporting may be an issue( 49 ). As it was not possible to discern under-reporters from under-consumers all participants were included in the analyses. Studies have highlighted the difficulties in assessing individual consumption of foods among collective societies such as ‘Asian’( Reference Khokhar, Pandor and Cade 50 ) linked to, for example, the practice of shared eating (i.e. from one dish), understanding of food terms and concepts, inadequate information on ethnic dishes and recipes, and culture-specific foods and portion sizes( Reference Khokhar, Pandor and Cade 50 , Reference Khokhar, Ashkanani and Garduno-Diaz 51 ).
A recent review has highlighted the need to develop and employ specific methodology to assess dietary intake among immigrant populations( Reference Ngo, Gurinovic and Frost-Andersen 52 ). An NZ study on SA women has reported a significant decrease in under-reporting, especially for use of plant oils and dairy, by using multiple methods for dietary data collection( Reference Kruger, Stonehouse and von Hurst 53 ). In preparation for the 2008/09 NZANS the 24 h recall probes were revised to capture ethnic-specific dishes. However, of note was the lower energy intake of SA females compared with the other ethnic groups, similar to that reported in the USA for females of an SA subgroup( Reference Jonnalagadda and Diwan 54 ). As energy intake was similar for SA males compared with NZEO males and ESEA females compared with NZEO females, perhaps the 24 h recall probes were adequate. Possible reasons for low energy intake among SA females may include under-reporting due to the effect of social desirability and language barriers. A lower level of physical activity among SA females compared with European females has been documented elsewhere( Reference Hayes, White and Unwin 55 ) and this may also explain decreased energy intakes.
The results of the current study indicate that dietary habits, nutrient intakes, blood indices and body size differ significantly between Asian subgroups and emphasize the need to acknowledge this heterogeneity in future diet- and disease-related research. Investigating associations between health outcomes and dietary intakes according to ethnicity was beyond the scope of the current research.
Conclusions
The current study is unique in reporting dietary data and health outcomes for two Asian subgroups separately, thereby addressing in part the heterogeneity in the disease risk profile of ‘Asian’ people. It also provides some evidence for changes in dietary intakes according to duration of residence, especially for SA males. Investigating diet-related disease risk levels for Asian ethnic groups is imperative and hence needs to be addressed in future studies. The authors recommend that future national surveys include an adequate sample of the Asian subgroups to be able to draw comparisons and make recommendations for the public health status of these groups.
Acknowledgements
Financial support: The New Zealand Ministry of Health funded the 2008/09 New Zealand Adult Nutrition Survey. The New Zealand Crown is the owner of the copyright for the survey data. The funder had no role in the design, analysis or writing of this article. The results presented in this paper are the work of the authors. Conflict of interest: None. Authorship: S.M.P. developed the concept, developed the Asian subgroup categorization and contributed significantly to writing the manuscript. C.S. developed the analysis plan, conducted the data analysis and interpretation, wrote the Methods section and contributed towards editing the other sections of the manuscript. W.R.P. contributed to collection of data, data interpretation and editing of the manuscript. Ethics of human subject participation: The study was conducted according to the guidelines laid down in the Declaration of Helsinki and all procedures involving human participants were approved by the Multi-Region Ethics Committee. Written informed consent was obtained from all participants.


