

The Danish National Survey of Dietary Habits and Physical Activity is a nation-wide, representative, cross-sectional survey collecting data on diet and physical activity with the aim of estimating intakes of foods and nutrients and monitoring trends and variations in habitual dietary patterns and physical activity in Denmark(Reference Groth and Fagt1–Reference Rasmussen, Matthiessen and Biltoft-Jensen4).
Until now data have been collected for 8551 individuals (4041 males and 4510 females) aged 4–75 years, all randomly drawn from the centralised Civil Registration System to create representative samples of the Danish population. Data were collected from 2000–2002, 2003–2004 and 2005–2008 by means of a pre-coded food diary and a physical activity diary, for seven consecutive days. Furthermore, anthropometric and demographic variables, as well as lifestyle information and information on attitudes towards dietary habits, were collected through interviews prior to the food recording(Reference Biltoft-Jensen, Groth and Matthiessen5). The pre-coded food diary applied in the Danish National Survey of Dietary Habits and Physical Activity to collect information on dietary intake contains pre-coded answers for the most commonly eaten foods and drinks in Denmark, and it is organised according to a typical Danish diet comprising breakfast, lunch, dinner and three snack meals. The participants were asked to fill in the diary prospectively for 7 d, thus not relying on remembering food intake in the past. Ongoing recruitment took place, covering dietary intake for all seasons for the whole population.
The pre-coded food diary has previously been validated against an objective measure (energy expenditure assessed by means of a validated position-and-motion instrument), which showed that the ability to rank individuals according to energy intake recorded by the food diary was acceptable(Reference Biltoft-Jensen, Matthiessen and Rasmussen6). However, the ability to assess intake of specific food groups was not examined.
The aim of the present study is to assess the relative validity of intakes of foods, drinks and nutrients estimated with the pre-coded food diary used in the Danish National Survey of Dietary Habits and Physical Activity against a 4 d weighed food record.
Materials and methods
In total seventy-two participants (thirty-five males, thirty-seven females) aged 20 to 69 years participated in the validation study. The participants were recruited at the Technical University of Denmark and the Danish Veterinary and Food Administration. Invitations were sent out by email, and all respondents who volunteered were included.
In the validation study the pre-coded food diary (FD) was completed for four consecutive days, three weekdays and one weekend day, instead of a whole week as in the main study. This was done to minimise the burden of the participants. The food diary included pre-coded lines for the most commonly eaten foods and drinks in the Danish diet, and it contained approximately 400 pre-coded lines. It comprised breakfast, lunch, dinner and snack meals in the morning, afternoon and evening respectively, and for each of the meals participants had the possibility to write additional food items not found in the food diary under the heading ‘Others’. Portion sizes were estimated using household measures (cups, glasses, pieces, etc.) or by means of a series of photographs with varying sizes of commonly eaten food items.
Furthermore, all participants filled in a weighed food record (WFR) through four consecutive days, three weekdays and one weekend day. They were asked to record all foods and drinks consumed using a scale and to write all items in a booklet. For mixed dished, participants were asked to provide a recipe using weights or usual household measures, or to describe the composition of the meal in detail. In addition, participants were asked to give information on the number of portions eaten, as well as the weight of each portion.
The study was carried out as a cross-over study, with half of the participants first completing the WFR followed by the FD, and the other half in the reverse order. Each participant completed the two dietary recordings on the same weekdays, with one or two weeks in between the two recording periods. Participants were instructed in person by trained dietitians on how to fill in the FD and WFR prior to each recording period. At the first personal instruction meeting body weight and height were determined for all participants by the project workers, and information on age, education and job description was obtained.
Mean intakes of foods, macro- and micronutrients recorded in the pre-coded FD were calculated by use of the software system GIES developed at the National Food Institute (Søborg, Denmark), including standard recipes, information on portions sizes and data from the Danish Food Composition Database (www.foodcomp.dk) as described previously(Reference Biltoft-Jensen, Matthiessen and Rasmussen6). Mean intakes of foods and nutrients recorded in the WFR were calculated by use of the same software system and food composition database as for the FD, but including intakes in grams and recipes as reported by the participants.
Output data were overall food groups (fruit, vegetables, meat, etc.) in grams per day, intake of specific foods and drinks, total energy intake and intakes of macro- and micronutrients.
Statistical methods
Intakes assessed by the two methods were compared by means of the paired t test when data were normally distributed and by means of the Wilcoxon signed rank test in cases of data with non-normal distribution. For normally distributed data Pearson's correlation coefficients were calculated, and for non-normally distributed data Spearman's rank correlation coefficient was applied(Reference Masson, McNeill and Tomany7). Furthermore, individuals were divided into quintiles according to intakes of food and nutrients, and the agreement between the two methods was assessed using cross-classification; proportions of individuals who were categorised in the same or an adjacent quintile were assessed, and weighted kappa coefficients of agreement between the methods were estimated(Reference Landis and Koch8). The following labels were assigned: κ < 0·00, poor agreement; κ = 0·00–0·20, slight; κ = 0·21–0·40, fair; κ = 0·41–0·60, moderate; κ = 0·61–0·80, substantial; κ = 0·81–1·00, almost perfect agreement. Gross misclassification was defined as the proportion of participants categorised into opposite lowest/highest quintiles by the two methods. Results were considered statistically significant at P < 0·05. All statistical analyses were carried out as described in the SAS Enterprise Guide version 4·1(9).
Results
Background information on the participants is presented in Table 1. The mean age was 38 (range 21–69) years for male participants and 39 (range 20–69) years for female participants, with a slight over-representation of younger men (25–34 years) and women aged 45–54 years (data not shown). Mean BMI was 24·0 and 23·5 kg/m2 for men and women, respectively.
Table 1 Baseline information on the seventy-two Danish participants

The study was carried out as a cross-over study; so, first, the potential influence of the order of completion of the two dietary methods (FD and WFR) on the results was examined. As the order of completion had no influence on the results regarding total energy intake, energy from fat, carbohydrate and protein, or any of the major food groups (results not shown), data from FD and data from WFR were pooled, and comparisons of the two methods were carried out as a whole.
Intakes of foods and food groups in both methods were predominantly right-skewed, and are thus presented as medians and interquartile ranges (Table 2). Statistically significant higher intakes of cereals, vegetables, meat and fish were seen in the weighed records compared with the food diary (Wilcoxon signed rank test), while intakes of fruit, sweets, coffee and tea were statistically significantly higher in the food diary. No statistically significant differences were observed for the rest of the food groups.
Table 2 Estimated intakes of food groups recorded in a pre-coded food diary over 4 d (FD) and a 4 d weighed food record (WFR) by seventy-two Danish adults aged 20–69 years
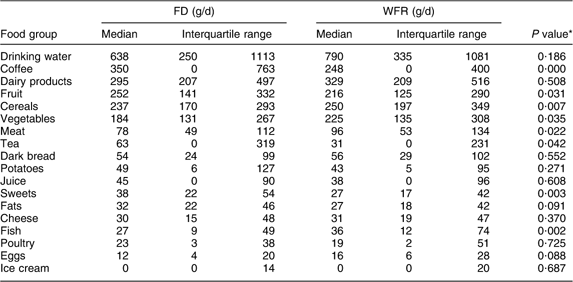
*Wilcoxon signed rank test. P values <0·05 are considered statistically significant.
Intakes of macro- and micronutrients were predominantly normally distributed, and are presented as energy-adjusted (per 10 MJ) means and standard deviations (Table 3). Total energy intake was slightly higher, although not statistically significantly so, in the WFR compared with the FD (Table 3). Overall, no statistically significant differences were observed for energy from total fat and carbohydrate, or from saturated, monounsaturated or polyunsaturated fat (paired t test). The WFR resulted in approximately 10 g higher protein intake compared with the FD, also leading to a higher percentage of energy from protein. There was a slightly lower, but not statistically significant intake of added sugar in the WFR compared with the FD. Concerning micronutrient intakes, no statistically significant differences were observed except for vitamin D and Zn, where the estimated intakes were slightly higher in the WFR compared with the FD (Table 3).
Table 3 Estimated daily mean intakes of macro- and micronutrients (energy-adjusted per 10 MJ), recorded in a pre-coded food diary over 4 d (FD) and a 4 d weighed food record (WFR) by seventy-two Danish adults aged 20–69 years

%E, percentage of energy intake; RE, retinol equivalents; α-TE, α-tocopherol equivalents; NE, niacin equivalents.
*Paired t test. P values <0·05 are considered statistically significant.
When examining cross-classification, dairy products, coffee, tea and drinking water showed the highest proportions of correctly classified individuals (Table 4). In general, cross-classification of food groups showed strengths of agreement ranging from fair (e.g. cheese and meat) to substantial (coffee and tea). Spearman's correlation coefficients ranged from 0·21 (poultry) and 0·18 (eggs) to 0·88 (coffee) and 0·78 (tea). Concerning intake of ice cream, a large proportion of the study participants had zero intake, which makes it impossible to rank individuals according to quintiles of intake, thus cross-classification was not performed for this food item.
Table 4 Spearman's correlation coefficients and classification of individuals by quintile of intakes of food groups estimated from a pre-coded food diary over 4 d and a 4 d weighed food record of seventy-two Danish adults aged 20–69 years

*κ < 0·00, poor agreement; κ = 0·00–0·20, slight; κ = 0·21–0·40, fair, κ = 0·41–0·60, moderate; κ = 0·61–0·80, substantial; κ = 0·81–1·00, almost perfect agreement(Reference Landis and Koch8).
Regarding nutrient intakes (Table 5) the macronutrients (energy, total fat, carbohydrate and protein) showed moderate agreement between the two methods. Pearson correlation coefficients ranged from 0·61 (fat) to 0·72 (dietary fibre). For the micronutrients agreements were slightly poorer, with κ values ranging from 0·14 (Se) to 0·44 (Fe and riboflavin). Pearson correlation coefficients ranged from 0·16 (vitamin D) to 0·67 (folate and Ca). The proportion of participants who were grossly misclassified was in general low (Tables 4 and 5).
Table 5 Pearson's correlation coefficients and classification of individuals by quintile of intakes of nutrients estimated from a pre-coded food diary over 4 d and a 4 d weighed food record of seventy-two Danish adults aged 20–69 years

RE, retinol equivalents; α-TE, α-tocopherol equivalents; NE, niacin equivalents.
*κ < 0·00, poor agreement; κ = 0·00–0·20, slight; κ = 0·21–0·40, fair, κ = 0·41–0·60, moderate; κ = 0·61–0·80, substantial; κ = 0·81–1·00, almost perfect agreement(Reference Landis and Koch8).
Discussion
Although differences in mean intakes of some foods and food groups between the two dietary assessment methods were found, there were generally consistent mean intakes of nutrients in the two methods. Higher correlation coefficients and better agreements were found for intakes of nutrients than for foods. Nutrient intakes are expected to be more evenly distributed over the days due to contribution from numerous foods, while variations in food intake are likely to be wider, due to a greater day-to-day variation(Reference Palaniappan, Cue and Payette10). A longer recording period is likely to reduce this problem, as more foods would be included. In the Danish National Survey of Diet and Physical Activity, the participants are asked to complete the pre-coded food diary for seven consecutive days in contrast to the 4 d in the present validation study, which is likely to increase the variety of foods eaten. Cross-classification of individuals according to macronutrient intakes showed that 70–85 % were classified within one quintile, with strengths of agreement ranging from moderate to fair, leaving the findings in good accordance with results of other validation studies(Reference Watson, Collins and Sibbritt11–Reference Vereecken, Covents and Matthys13). The pre-coded food diary is therefore an appropriate tool in classification of individuals according to high or low intakes of nutrients.
Pearson correlation coefficient for total energy intake was 0·71, in accordance with what was found in a pre-coded food diary validated against doubly labelled water(Reference Koebnick, Wagner and Thielecke14), slightly better than what was found in a study comparing an optical readable food record with a weighed food record(Reference Nydahl, Gustafsson and Mohsen15), and also somewhat better than the findings of a study comparing a pre-coded 7 d food record with an FFQ(Reference Brunner, Stallone and Juneja16). In another study it was found that energy intake was under-reported in a pre-coded diary, but that the method could be applied in ranking of individuals according to intake(Reference Andersen, Pollestad and Jacobs17). A pre-coded food diary also seems to be applicable among children, as the ranking of individuals according to intake assessed in a pre-coded food diary was found to be moderate, although more accurate among boys than girls(Reference Lillegaard, Loken and Andersen18). One study among elderly people showed good agreement between energy expenditure and reported energy by a pre-coded 3 d dietary record(Reference Luhrmann, Herbert and Gaster19). In a validation of a 7 d food record with pre-coded food types and portion sizes(Reference Braddon, Wadsworth and Davies20), proportions of individuals classified in the same quartile and Spearman correlation coefficients were of the same magnitude as found in the present study. Spearman correlation coefficients found in other validation studies of food diaries(Reference Bingham, Gill and Welch21, Reference Gariballa and Forster22) were in the same range as found in the present study, as well as the proportion of individuals classified in the same group of intake(Reference Bingham, Gill and Welch21). In a validation study of an FFQ against a weighed food record, correlation coefficients were of the same magnitude or slightly lower, which was explained by the seasonal variation in intake which was not detected in the FFQ(Reference Carlsen, Lillegaard and Karlsen23). Overall, the pre-coded food diary seems to give a reasonable estimate of the habitual diet, and may be a preferred tool compared with other methods of dietary assessment. The choice of food recording method is a challenge in nutritional studies. The FFQ has often been found to be appropriate in epidemiological studies due to low cost and low burden on the participants(Reference Willett and Hu24). However, FFQ have limitations due to assumptions on portion sizes and recipes and the fact that the participants have to recall dietary intake in the past(Reference Biro, Hulshof and Ovesen25). In a comparison of dietary assessment methods the 7 d food record was found to give the best estimates of dietary intake compared with FFQ and 24 h recall(Reference Bingham, Gill and Welch21).
In our study, the assessment of intake in the FD is partly based on assumptions on standard portion sizes. The slightly higher energy intake reported in the WFR could be due to a slight over-representation of younger men in the validation study, possibly leading to larger portion sizes and thereby higher food intake in general and perhaps also to a higher intake of meat, which could explain the higher protein intake as also detected in the study. When running the analyses on men and women separately, men had a relatively higher protein intake from the WFR compared with the FD than the women (data not shown), possibly due to too small portion sizes leading to underestimation of intake in this group of participants.
A poor agreement in classifying individuals regarding intake of eggs and fish was found. This was somewhat expected, since these food items are not eaten on a regular basis and often in small amounts. However, on a group level it was expected that the mean intake of these food items would be of equal size. A higher intake of fish in the WFR compared with the FD was found, more pronounced in men than women; the reason for this could be that the participants had to estimate portion sizes of fish from the pictures of meat, indicating that the pictures of meat applied in the survey may not be appropriate for fish dishes. Developing photo series to estimate portion sizes including pictures of both fish and meat, and increasing the range of the portion sizes, may improve the estimation of these food items. Although poor agreement was found regarding intake of eggs no statistically significant difference was found when comparing median intakes estimated from the two methods.
A higher intake of coffee and tea was observed in the FD compared with the WFR, and at the same time a good correlation was found when looking at cross-classification, e.g. individuals are correctly classified as having a high or low intake, but the assessment of the absolute intake may be skewed. This also points towards the need for adjustment of portion sizes of some food and drink items. In addition, emphasising varying sizes of different household measures (cups, mugs, etc.) in the pre-coded food diary may improve the accuracy of the dietary assessments.
Due to the setting of the study, the participants were not a representative group of the Danish population. Another limitation of the study design is the lack of an objective measure that is not dependent on the participants’ self-reported intake; however, it is difficult to identify appropriate biomarkers for intake of specific foods groups, e.g. fruit and vegetables. Both methods are prospective measures of the participants’ diet, i.e. in both methods intake assessment relies on the participants’ self-reported intake, and are thus prone to errors like under-reporting of total energy intake either as a change of eating habits in the recording period or due to omitting of recording foods and/or meals. In addition, completion of the WFR was probably a greater burden for the participants, as all food and drinks had to be weighed and noted down. This could explain the lower intake of sweets reported in the WFR, as sweets will often be a part of a snack meal which may more often be omitted or under-reported(Reference Heitmann and Lissner26, Reference Lafay, Mennen and Basdevant27). Finally, the recording length tested in the present study does not reflect the method applied in the National Survey, as diet and physical activity are usually recorded for seven consecutive days(Reference Biltoft-Jensen, Matthiessen and Rasmussen6). However, recording length was the same in the FD and the WFR, leaving the results comparable for relative validation.
The pre-coded food diary measures dietary intake prospectively, and does thus not rely on participants’ memory. In the Danish National Survey on Diet and Physical Activity participants are asked to record dietary intake for 7 d, and are enrolled during all months of the year, covering the potential seasonal variation in the whole population. Filling in a food diary each day for a short period rather than retrospectively reporting dietary intake in the previous year, as applied in many FFQ, is expected to give better estimates of intake as more details of the diet are captured. This method facilitates analyses on differences in dietary intakes on weekdays and weekend days, and on intakes on meal level. A limitation of this method is the potential changes in dietary habits, which are likely to occur. Finally, it has been reported that participants experience fatigue when recording diet for a whole week(Reference Biltoft-Jensen, Matthiessen and Rasmussen6), which may be a more burdensome task than filling in an FFQ, leading to potential under-reporting. However, when asking the participants about their experience with filling in the food diary, the majority found it ‘easy’ or ‘very easy’ to fill in the food diary, to find the food, drinks and meals they had been eating and drinking, and to use the photo series for portion size estimation (data not published). Overall, the method seems to be accepted well in the population.
In conclusion, dietary assessment by means of the pre-coded food dairy applied in the Danish National Survey of Diet and Physical Activity is appropriate in ranking individuals according to high and low intakes of foods and nutrients; however, absolute intakes should not be applied on an individual level and should be interpreted with caution.
Acknowledgements
This study received internal funding from the National Food Institute. None of the authors had any conflicts of interest. V.K.K. was involved in data analyses, interpretation of the results and writing the manuscript. M.-B.G. was involved in cleaning of the data, interpretation of the results and editing the manuscript. T.H.N. was involved in collection of data and cleaning of data. T.C. was involved in nutrient calculation of the data. S.F. was involved in designing the study, collection of data, nutrient calculation and editing the manuscript. A.B.-J. was involved in designing the study, collection of data, interpretation of results and editing the manuscript.


