


Population-based surveys frequently use short questions to assess lifestyle habits in order to identify patterns and habits quickly and easily, provide information that can be used to monitor the population over time, and identify potential lifestyle habits requiring intervention. In assessing dietary intake, various FFQ have been developed and validated for use in general adult and older child populations( Reference Willett, Sampson and Stampfer 1 – Reference Gwynn, Flood and D'Este 4 ); however, few short FFQ have been developed to assess the dietary habits of children of pre-school age.
Reliability and validity studies of FFQ have been conducted in pre-school children in Belgium and Canada to determine healthy eating scores( Reference Simpson, Keller and Rysdale 5 , Reference Huybrechts, De Backer and De Bacquer 6 ). In the Belgian study, an FFQ with forty-seven items was used to assess usual nutrient and food intakes over the past year for children aged 2–6 years and compared with food and nutrient intakes obtained using a 3 d food record (n 650)( Reference Huybrechts, De Backer and De Bacquer 6 ). In Canada, the NutriSTEP® (Nutritional Screening Tool for Every Preschooler) is a seventeen-item questionnaire with five questions focusing on food groups and the remainder on nutritional risk constructs such as physical growth, food and fluid intake, and physical activity among others, and it was used to derive an index( Reference Simpson, Keller and Rysdale 5 ). The NutriSTEP was tested for criterion validity and test–retest reliability against a 3 d dietary recall and was found to be valid (in terms of a score to define nutritional risk) and repeatable (κ ranging from >0·5 to >0·75 on most items; intra-class correlation coefficient (ICC) = 0·89). In another European study, the repeatability of a forty-three-item FFQ was assessed among 2–9-year-old children (n 258), but no assessment of validity was conducted( Reference Lanfer, Hebestreit and Ahrens 7 ).
In Australia, there have been a few reliability and validation studies conducted in older children of primary-school age( Reference Watson, Collins and Sibbritt 3 , Reference Gwynn, Flood and D'Este 4 ) but little research among populations of pre-school children. There was one Australian study which validated a twenty-eight-item diet survey among 4–16-year-old Australian children in which a longer 7 d food checklist was used to assess agreement, and this was subsequently used for a scoring system( Reference Magarey, Golley and Spurrier 8 ). International researchers have also conducted validity studies of shorter tools among school-aged children, including Baranowski et al. ( Reference Baranowski, Smith and Baranowski 9 ), Prochaska and Sallis( Reference Prochaska and Sallis 10 ), Rockett et al.( Reference Rockett, Berkey and Colditz 11 ), Vereecken et al.( Reference Vereecken, Rossi and Giacchi 12 ) and Lilliegaard( Reference Lillegaard, Øverby and Andersen 13 ), but these are limited in age range (3rd grade students, ages 12 years, 9–14 years, 11–12 years, and 9 and 13 years, respectively). This probably reflects the difficulty of obtaining accurate dietary data from young children, as it needs to be obtained by proxy and attention needs to be given to alternative carers, such as child-care services who may be providing food to the child outside the home( Reference Baranowski and Domel 14 ).
In summary, to date there has been no validity or repeatability assessment of short questions among children aged 2–5 years in Australia and very few have occurred internationally( Reference Simpson, Keller and Rysdale 5 – Reference Lanfer, Hebestreit and Ahrens 7 , Reference Vereecken, Covents and Maes 15 ). The purpose of the present study was to determine the reliability and validity of a seventeen-item FFQ which assessed the dietary intake and habits of children aged 2–5 years, as reported by their parents and pre-school carers.
Methods
Design
The present cross-sectional study of parents of pre-school children comprised a convenience sample of pre-school children, collected between September 2007 and April 2008. The study was approved by the University of Sydney Human Research Ethics Committee.
Participants
Ten pre-school centres located in metropolitan Sydney, NSW, Australia were approached to participate in the study and seven agreed. Within each of these seven pre-school centres, parents of children aged 2–5 years were invited to participate. Informed consent by parents was a requirement for participation.
Short FFQ
A seventeen-item FFQ was developed, based on previous questions commonly used in the NSW Government's Population Health Survey( Reference Quaine, Eyeson-Annan and Baker 16 , Reference Flood, Webb and Rangan 17 ). The questions related to food and beverage items that are associated with health, designed to assess usual intake, and included daily servings of fruit and vegetables, usual frequency of eating lean meat, processed meats, take-away food, snack foods (biscuits, cakes, doughnuts, muesli bars), potato crisps and confectionery, and cups of sugary drinks (soft drinks, cordials, and sports drinks), fruit juice, milk and water, frequency of eating in front of the television and requency of daily breakfast consumption (see Appendix). For the reliability study the short FFQ was administered by telephone on two occasions within a fortnight of each other.
Diet records
For the validity study, parents were asked to complete 3 d food records (FR) within two weeks after the administration of the second FFQ. Parents were contacted by research staff and provided with household measures and instructions on how to record everything their child ate or drank on two weekdays and one weekend day. Pre-school staff were also provided with instructions on how to complete the FR if the participating child was at pre-school on one or both of the weekdays.
Other measures
Parents of the children were asked to provide general demographic characteristics, including the child's sex, date of birth and postcode of residence. Two researchers visited each pre-school and measured the height (m) and weight (kg) of each child, using an electronic scale and portable stadiometer. These data were used to assess the plausibility of the reported energy intake data from the 3 d FR.
Statistical analysis
Data were analysed using the SPSS statistical software package version 15·0. The data from the FFQ were analysed using both continuous and categorical methods, because the data may be used in either way; for example, in population health monitoring, data from short FFQ are frequently reported in terms of those meeting recommended servings for fruit and vegetables( 18 ). For the reliability study, the short FFQ responses were categorised according to the distribution and frequency of responses. The proportion of parents reporting within the same response category, between surveys, was determined and weighted kappa values (κ w) were calculated using MedCalc statistical software version 10·0·1·0. The κ w values were characterised as showing poor agreement (<0·20), fair agreement (0·20–0·40), moderate agreement (0·41–0·60), good agreement (0·61–0·80) and very good agreement (0·81–1·00)( Reference Landis and Koch 19 ). Agreement between FFQ responses was also determined for the raw data using the ICC statistic, as described in Armitage et al. ( Reference Armitage, Berry and Matthews 20 ).
In order to conduct the concurrent validation of the seventeen-item FFQ, the 3 d FR were entered into the dietary software analysis package Foodworks Professional version 5 and the AUSNUT 1999 nutrient database( 21 ) was used for analysis. The average weight (g) of the food items from the FR was compared with the servings, frequency or cups reported in the first short FFQ. To calculate servings of fruit, the weight of all fruit was divided by 150 g, and to calculate servings of vegetables the weight of all vegetables was divided by 75 g, as used in the Australian Guide to Healthy Eating and reported in previous analyses of servings of fruit and vegetables( Reference Magarey, McKean and Daniels 22 ). This measure of concurrent validity assessed food items reported in the short FFQ compared with the more comprehensive FR, sometimes referred to as ‘direct’ validity in dietary data analysis( Reference Gibson 23 ). Additionally, indirect validity was investigated by examining selected nutrients for each short question. ‘Indirect’ validity compares the food items reported in the FFQ with the nutrient intake derived from the FR, similar to the method reported by the Australian Food and Nutrition Monitoring Unit( Reference Riley, Rutishauser and Webb 24 ). For example, given the known vitamin C content of juice and fruit, the total vitamin C intake of the diet is evaluated in relation to categories of responses for fruit and juice, providing an indication of indirect validity. The plausibility of the energy intake from the 3 d FR was determined using the Goldberg cut-offs for energy intake for a physical activity level of 1·60 (±95 % confidence limits), as described by Black( Reference Black 25 ). The food items from the FFQ were categorised into quartiles, to the nearest half or whole serving, frequency or cups, as applicable. Since many people may provide the same response (e.g. one serving daily, zero soft drinks), the numbers were not always distributed evenly across the four categories.
In addition, the validity of the data was assessed using the continuous data, comparing the servings, frequency or cups of food reported in the FFQ with the FR, using both a paired t test and the Spearman rank correlation coefficient. Using the FR as the criterion standard, we also estimated the sensitivity, specificity, positive predictive value and negative predictive value (with exact binomial confidence intervals) of the FFQ for the items of fruit and vegetables in relation to recommended servings (one serving or more for fruit, two or more servings for vegetables), as this comparison is frequently reported in state and national nutrition monitoring( 18 , Reference Morley, Scully and Niven 26 ).
Additionally, the average servings of fruit and vegetables and cups of milk and water were assessed using the Bland–Altman method( Reference Bland and Altman 27 ), where the mean of the two measurement methods ((first FFQ + FR)/2) was plotted on the x-axis and the difference (first FFQ − FR) was plotted on the y-axis. Any systematic difference between the two methods was also assessed using a regression test.
Three questions from the FFQ were not included in the validity assessment (breakfast consumption, take-away use and eating in front of the television) as these items were not consistently reported in the FR by parents.
Results
Seventy-seven parents of children aged 2–5 years participated in the reliability study and sixty-four parents participated in the validity study. The majority of parents interviewed were mothers (96 %) aged 25–45 years (92 %), with a tertiary education (90 %) and from English-speaking backgrounds (93 %). The mean age of the children was 3·6 (sd 0·94) years. The mean age and age range of children and their parents did not differ between those who participated in both the repeatability and validity studies; however, there were fewer parents with high school only education among the parents who provided the validity data (3 % v. 10 % in FR and FFQ, respectively).
Reliability
Table 1 reports the proportion within each response category and the κ w values for each FFQ item. The majority of items showed moderate to good agreement with κ w values ranging from 0·37 for red meat frequency to 0·85 for take-away food frequency. Similarly, the ICC for the raw data showed moderate to good agreement and ranged from 0·29 for red meat frequency to 0·82 for salty snack food frequency. Overall, eleven of the seventeen items showed good (fruit, hot potato chips, take-away food, eating in front of the television, milk, regular and diet soft drink, fruit juice and water) to very good (salty snacks, confectionery) agreement.
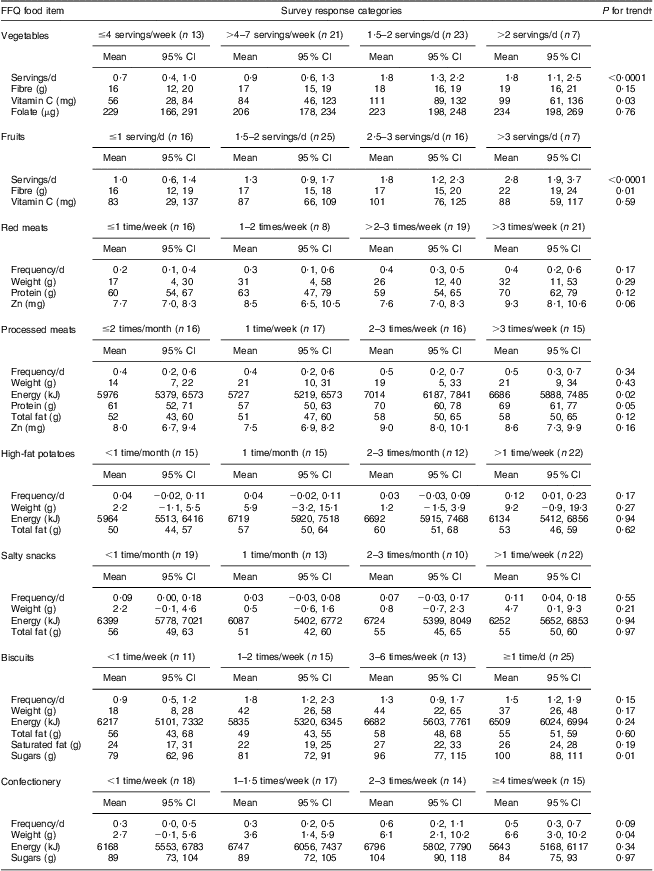
Table 1 Repeatability of the short FFQ among pre-school children (n 77) aged 2–5 years, metropolitan Sydney, Australia, September 2007–April 2008

†Percentage within same category.
‡Weighted κ(κw) was calculated for categorised data and intra-class correlation coefficient (ICC) was calculated for raw data.
§Includes soft drinks, syrups and sports drinks.
Validity
The concurrent validity of the short questionnaire is shown in Tables 2 (foods) and 3 (drinks), where the mean and 95 % confidence interval of the FR data are shown for a range of items, classified by FFQ category, based on responses to the first FFQ. The servings of fruit and vegetables from the FR indicated relatively good validity for servings reported by categories of the short FFQ, with P for trend <0·001 and mean servings similar to those described in the short questions. For example, those who reported consuming more than two servings of vegetables daily (FFQ) actually consumed a mean of 1·8 servings/d (FR), while those who reported consuming four or fewer servings of vegetables weekly actually consumed 0·7 servings/d (equivalent to 4·9 servings/week). There was a significant trend for increasing vitamin C intake among those reporting more servings of vegetables (P for trend = 0·03) and a significant trend for an increasing fibre intake among those reporting more servings of fruit (P for trend = 0·01). There was no significant trend of frequency or weight for short questions on red meat, processed meat, hot chips, potato crisps and snack foods. There was a significant trend for increasing weight of confectionery (P for trend = 0·04), with those reporting four or more servings of confectionery weekly (FFQ) consuming a mean of 6·6 g/d (FR), compared with a mean of 2·7 g/d among those who reported consuming confectionery less than once weekly.
Table 2 Relative validity: mean and 95 % confidence interval of 3 d food record data by category of food items from the short FFQ among pre-school children (n 64) aged 2–5 years, metropolitan Sydney, Australia, September 2007–April 2008
†One-way ANOVA with test for linearity.
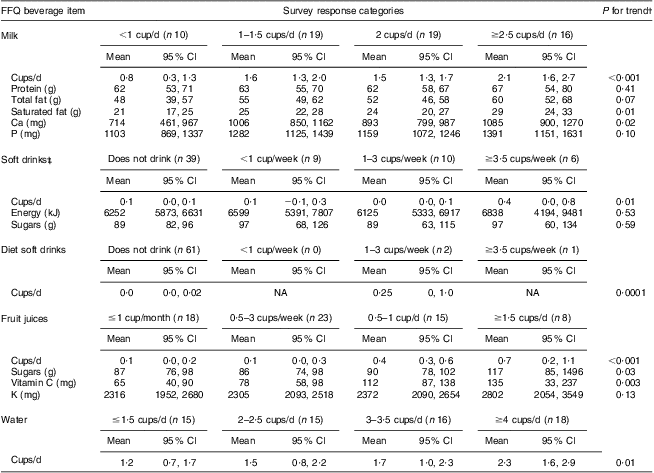
Table 3 Relative validity: mean and 95 % confidence interval of 3 d food record by category of beverages from the short FFQ among pre-school children (n 64) aged 2–5 years, metropolitan Sydney, Australia, September 2007–April 2008
NA, not applicable.
†One-way ANOVA with test for linearity.
‡Includes soft drinks, syrups and sports drinks.
There were significant increasing trends for indirect measures of validity in the following items: energy (P = 0·02) and protein intake (P = 0·05) with increasing frequency of processed meat consumption; and mean sugars consumption with increasing snack food consumption (P = 0·01).
Drinks tended to have good validity with means increasing as the reported cups consumed increased (Table 3). All drinks (milk, sugary drinks, fruit juices and water) had significant P values for trend. The beverage of milk had similar absolute quantities reported in the FFQ and the FR: among people reporting consumption of 2·5 cups or more of milk daily in the FFQ, the mean number of cups of milk from their FR was 2·1 cups/d, compared with 0·8 cups/d among those who reported consuming less than one cup daily (P < 0·001). However, the other drinks had significant P values for trend, but they did not equate well in absolute quantities: people who reported consuming four or more cups of water daily in the FFQ consumed 2·3 cups/d in the FR, compared with 1·2 cups/d among those who reported consuming less than 1·5 cups of water daily. Among those reporting increasing cups of milk, there was a significant P value for trend for Ca (P for trend = 0·02) and saturated fat intake (0·01); among those reporting increasing cups of juice, there was a significant P value for trend for total sugars (0·03) and vitamin C (0·003).
The mean and median amounts of food and beverage items reported in the FFQ and consumed in the FR are presented in Table 4. Fruit, fruit juice and water were significantly higher in the FFQ than the FR (P < 0·001), and processed meats and biscuits were significantly lower in the FFQ than the FR (P < 0·01). There was no significant difference between the FFQ and FR for vegetables, red meat, high-fat potatoes, confectionery, soft drinks (sugary and diet) and milk. Rank correlation coefficients were >0·5 for vegetables, fruit, diet soft drinks and fruit juice.
Table 4 Comparison of mean and median intakes, mean difference and rank correlation between the short FFQ and 3 d food record (FR) among pre-school children (n 64) aged 2–5 years, metropolitan Sydney, Australia, September 2007–April 2008

*P < 0·05, **P < 0·01, ***P < 0·001 based on paired t tests.
The sensitivity to identify two or more servings of vegetables from the FFQ was 83 % (95 % CI 52, 98 %) and the specificity was 63 % (95 % CI 49, 76 %), with positive predictive value of 34 % (95 % CI 18, 54 %) and negative predictive value of 94 % (95 % CI 81, 99 %). The sensitivity to identify one or more servings of fruit from the FFQ was 98 % (95 % CI 88, 100 %), specificity was 17 % (95 % CI 4, 41 %), positive predictive value was 75 % (95 % CI 62, 85 %) and negative predictive value was 75 % (95 % CI 19, 99 %).
Bland–Altman plots (Fig. 1) were constructed to describe the agreement between the two methods for servings of fruit and vegetables and cups of water and milk. All plots indicated a positive mean difference between the short FFQ and FR, since for these food items the short FFQ tended to provide a higher estimate of foods consumed than the FR. Most measurements fell within the 95 % limits of agreement as expected, and there were no significant linear trends for the fitted regression lines, indicating no systematic bias between the two methods. Because the responses for servings of fruit and vegetables and cups of milk and water from the seventeen-item FFQ tend to be integers, whereas the FR has a range of continuous data, the Bland–Altman plots tend to fall in diagonal lines.
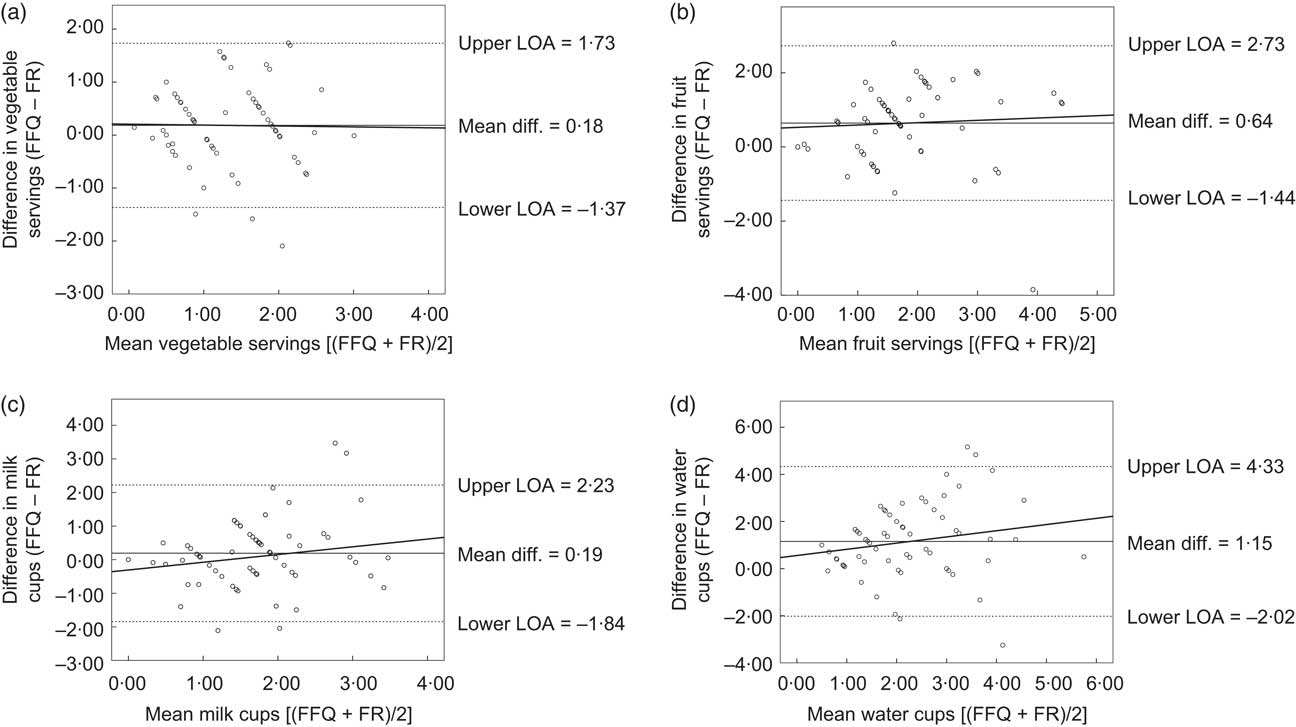
Fig. 1 Bland–Altman plots assessing the validity of the first FFQ v. the 3 d food record (FR) for intakes of vegetables, fruit, milk and water among pre-school children (n 64) aged 2–5 years, metropolitan Sydney, Australia, September 2007–April 2008. Plots show the mean difference (Mean diff.; ——), the 95 % limits of agreement (LOA; – – –) and the fitted regression lines (——) for: (a) servings of vegetables (difference vegetable servings = 0·21+−0·02 × mean vegetable servings (95 % CI −0.30, 0.27), P for linear trend = 0.91); (b) servings of fruit (difference fruit servings = 0·53 + 0·06 × mean fruit servings (95 % CI −0·21, 0·34), P for linear trend = 0·65); (c) cups of milk (difference milk cups = −0·31 + 0·30 × mean milk cups (95 % CI −0·21, 0·62), P for linear trend = 0·07); and (d) cups of water (difference water cups = 0·56 + 0·26 × mean water cups (95 % CI −0·09, 0·62), P for linear trend = 0·15)
Discussion
The present study investigated the repeatability and validity of a short FFQ proxy reported by parents of children of pre-school age to assess selected food consumption and behaviours in this age group. A range of food consumption habits had moderate to good repeatability and selected questions had good validity, especially fruit and vegetable servings and drinks. Water and sugary drinks did not perform well in terms of absolute quantity of intake; however, they were able to provide information about the ranking of foods and nutrients.
Although other questions did not perform well for direct validity, they were still able to provide significant indirect validity for selected nutrients, such as occurred with red meat (protein, Zn), processed meat (energy, protein and Zn) and snack foods (sugars). Likewise, in validity analyses undertaken of short questions as part of the Australian National Food and Nutrition Monitoring and Surveillance Project, among a group of 766 adults, those who reported more frequent consumption of red meat and processed meat consumed more meat in 3 d weighed food records and also had increasingly higher intakes of energy, protein, Zn, fat and saturated fat (P < 0·05)( Reference Riley, Rutishauser and Webb 24 ).
Information about the sensitivity and specificity of fruit and vegetable questions from the FFQ provides useful information to consider when FFQ data are used to report the proportion of people meeting recommended servings. The high sensitivity for both fruit and vegetables (83 % and 98 % respectively) indicates that the FFQ will detect most of those who meet the guidelines according to the FR. However, because the FFQ overestimates consumption of both, its specificity is quite low for vegetables (63 %) and poor for fruit (17 %) which we showed was very significantly overestimated by the FFQ (Table 4). As a result the FFQ will fail to identify many children who are not meeting the fruit guidelines (83 %). From the positive predictive values we see that if the FFQ indicates a child is meeting the vegetable guidelines there is a relatively low probability that he/she really is (34 %), while this probability is higher for fruit (75 %). On the other hand, the negative predictive values show that if the FFQ indicates a child is not meeting the vegetable guidelines then he/she very likely really is not (94 %), while the very wide confidence intervals for the negative predictive value for fruit (75 %) reflect the fact that the FFQ identified only four children who did not meet the fruit guidelines and three of them really did not.
The Bland–Altman plots for fruit, vegetables, water and milk indicated no bias as the mean intake increases or decreases. This shows that the FFQ is most useful when measuring and comparing dietary intakes of children at a population level, rather than at an individual level.
The current study of pre-school children provides useful information to support population health monitoring and, importantly, may be used in the assessment of diet in larger research programmes. Keeping detailed food records or undertaking 24 h recalls of dietary consumption can be burdensome for participants and resource-intensive for researchers, so it is appealing to have a simpler and shorter tool. Our findings have some similarities to a study of 4–16-year-old children in which a twenty-eight-item questionnaire, known as the Children's Dietary Questionnaire (CDQ), was tested for repeatability and relative validity( Reference Magarey, Golley and Spurrier 8 ). In that study (n 709), the repeatability values for fruit and vegetable intake and non-core foods were reasonable, but fat from dairy and sweetened beverages had poorer repeatability. The authors concluded that the relative validity of the CDQ, assessed using a 7 d frequency checklist completed by the carers and parents of the children, was suitable only to assess habits at a group level and was not suitable to measure change in individual intakes( Reference Magarey, Golley and Spurrier 8 ). In the case of the CDQ, the authors used a short frequency tool as a comparison dietary assessment method, rather than the more common method of food record or multiple 24 h recalls( Reference Cade, Burley and Warm 28 ). The CDQ was also used to score the diet habits, unlike the tool under investigation in the current research.
In the European study of 2–9-year-old children (n 258) of the Children's Eating Habits Questionnaire (CEHQ-FFQ), forty-three food items were included in the FFQ and the reproducibility of the FFQ was assessed, with reproducibility lowest for diet soft drinks (κ = 0·23, r = 0·32) and highest for sweetened milk (κ = 0·68, r = 0·76)( Reference Lanfer, Hebestreit and Ahrens 7 ). In our study, the food item with the poorest repeatability was red meat (κ w = 0·37, ICC = 0·27), with the best measure being the reported frequency of take-away foods (κ w = 0·85, ICC = 0·77). No assessment of validity was performed by the European study of 2–9-year-old children.
In the Belgian study of pre-school children( Reference Huybrechts, De Backer and De Bacquer 6 ), food items with Spearman rank correlation coefficient >0·5 between the FFQ and the diet record were fruit, milk products, cheese, sugared drinks and fruit juice, with similar in our own study for fruit and fruit juice but not for the other items. In the Canadian study of pre-school children, the FFQ was used to provide an overall score of diet quality to determine the nutritional risk in pre-schoolers, and this was validated and compared with results from 3 d dietary records/recalls( Reference Simpson, Keller and Rysdale 5 ). That study is not directly comparable to our study, in which we investigated the validity and repeatability of individual food items, rather than an overall score of diet quality.
There are some limitations to the present study. First, a number of the short diet questions did not perform well in terms of their relationship to a more detailed dietary assessment method, in particular questions about red meat, processed meat, hot chips, salty snacks (e.g. potato chips) and snack foods (includes biscuits, cakes, doughnuts, muesli bars). This could be due to a number of factors. The parents who participated in our study were mostly tertiary educated and generally the children recorded healthy diets, with a limited intake of energy-dense, nutrient-poor foods. It is likely that those who participated in the study were well motivated parents, who carefully provided mostly healthy foods for their children. The relatively small weights recorded of energy-dense nutrient-poor foods made it difficult to assess the validity of the categorical data from the questions. For example, in the salty snacks question, those who reported consuming salty snacks more than once weekly (22/64, 34 %) had a daily average intake of 4·2 g of salty snacks compared with 2·2 g of salty snacks among those who reported consuming less than once monthly. Both mean values were relatively low, limiting the interpretability of the findings. Additionally, some of the short questions required parents and carers to consider multiple factors at once, which may be difficult to calculate accurately and quickly. An example is the snack food question, where respondents are asked to report frequency of consumption of biscuits, cakes, doughnuts or muesli bars within the same question. It would probably be easier to answer this question if it included fewer different foods within the one question.
A second limitation is the relatively small total number of participants, which means for each category of response that there were fairly small numbers to compare, limiting the generalisability of the findings.
Third, given the FR was limited to 3 d, there may be less ability to capture accurate information about less frequently consumed food items, such as high-fat potatoes and salty snacks, and indeed food items which were consumed daily (e.g. fruit, vegetables, and beverages) produced a higher correlation between the FFQ and FR. It may be useful to consider recording more days in future analyses of validity in order to better capture habitual intake; however, this needs to be balanced against possible problems with increasing fatigue and boredom associated with recording( Reference Magarey, McKean and Daniels 22 ).
Conclusion
The present study of the repeatability and validity of a short FFQ among children aged 2–5 years, reported by their parents and pre-school teachers, indicated good to moderate repeatability for most questions and moderate validity for short questions about fruit and vegetable servings and different types of drinks consumed. Other questions about dietary habits, which asked about frequency of consumption, had poorer validity. This information is useful for interpreting short questions used in monitoring of food intake in populations, and also could be used in population-based research to assess response to interventions( Reference Wen, Baur and Simpson 29 ). It should be noted that the participating parents were mostly tertiary educated, with English as their first language, so these findings may not be representative of other subgroups in the population.
Acknowledgements
Sources of funding: The current research is related to work of the Healthy Beginnings Trial (HBT) funded by the Australian National Health and Medical Research Council (ID number: 393112); however the participants of the present study were not part of the HBT. Conflicts of interest: There are no conflicts of interest. Authors’ contribution: V.M.F. conceived the idea of the study, undertook the literature review, data analysis and interpretation, and wrote the original draft. V.M.F. and L.L.H. contributed to the study design and acquisition of data; J.M.S. provided advice on data analysis; L.M.W., L.L.H., J.M.S., C.R. and L.A.B. made significant comments on the draft. All authors have read and approved the final manuscript. Acknowledgements: The authors thank the research assistants who assisted with dietary data collection and data entry: Ms Kristy McDonald and Dr Jimmy Louie. They also thank Mr Aaron Thrift and Professor Jennifer Peat who provided advice about statistical analyses.
Appendix Young Children's Food and Drink Study Thank you for agreeing to participate in this study about short nutrition questions of young children. The following set of short questions will take approximately 10 to 15 min to complete. The answers are confidential and will only be seen by the survey team. No one else will have access to your information. We are interested to learn more about your pre-school child's usual eating habits. I'm going to read you a list of different food and drinks. Please tell me how much of these foods and drinks [child] usually consumes per day or per week.


