Latin America is facing a rapid transition in the nutritional status of its populations, which has been characterized by an important increase in the prevalence of overweight and obesity that affects all population groups, especially the youngest( 1 ). The first step in preventing and treating obesity is to identify it. The correct perception of one’s body weight can be a useful resource for the prevention and treatment of obesity( Reference Silveira Vieira, Dal Bosco and Grave 2 ). This is one of the reasons for the increasing interest in body image perception in the field of health, especially in children and adolescents.
Body image has been defined by Schilder as ‘the picture of our own body which we form in our mind’( Reference Schilder 3 ). Gardner argues that body image includes two components: one perceptive, which refers to the estimation of size and appearance of the body; and another attitudinal, which collects feelings and attitudes towards one’s body( Reference Gardner 4 ). According to Baile, body image is a complex psychological construct which refers to how the self-perception of the body generates a mental representation composed of a body perceptive scheme, emotions, thoughts and associated behaviours( Reference Baile 5 ). The perceptual component implies the accuracy of the estimation of the body shapes the attitude and feelings towards the body( Reference Jiménez-Flores, Jiménez-Cruz and Bacardi-Gascón 6 ). Self-perception can be classified as correct, underestimated or overestimated, and this could generate body satisfaction or dissatisfaction. Some authors consider that perceptual distortion is the alteration of the perception manifested by an inability to accurately estimate the body size( Reference Jiménez-Flores, Jiménez-Cruz and Bacardi-Gascón 6 ).
Dissatisfaction with body image may be due, among other things, to social factors (media)( Reference Thompson, Heinberg and Altabe 7 , Reference Tiggemann 8 ), culture( Reference Fuller-Tyszkiewicz, Skouteris and McCabe 9 ), friendships( Reference Dohnt and Tiggemann 10 ), family( Reference Monteiro, Novaes and Santos 11 ) and psychological factors( Reference Banfield and McCabe 12 ). Throughout life, body image is in permanent (de)construction. A distorted perception of body weight or body image can trigger negative psychosocial consequences and unhealthy behaviours( Reference Whitehead, Cosma and Cecil 13 ). An overweight perception is associated with increased risk of developing low self-esteem, depression and anxiety, conditions that may lead to eating disorders, alcohol intake and cigarette smoking( Reference Whitehead, Cosma and Cecil 13 ). On the other hand, a person with overweight who perceives his/her weight to be normal may become detached from the situation and lose time in taking the right actions to avoid obesity (e.g. dieting and exercising)( Reference Bodde, Beebe and Chen 14 , Reference Robinson, Hunger and Daly 15 ).
Figure-rating scales are among the instruments most frequently used for assessing body image in children( Reference Mulasi-Pokhriyal and Smith 16 , Reference Lombardo, Battagliese and Pezzuti 17 ). Gardner et al.( Reference Gardner, Stark and Jackson 18 ) developed a scale with thirteen figures in order to provide responders with enough options to choose from. They developed this instrument with constant increases among the figures through photography and video techniques, making them real and establishing a scale of analogous figures. Gardner’s scale overcame limitations of previous ones by providing a major number of figures. In addition, the scale shows the figures’ contour, avoiding race characteristics as hair and skin colour, making the instrument a reliable, valid and suitable scale to be used among different ethnic groups( Reference Gardner, Stark and Jackson 18 ).
In South America, several countries have validated different body image scales. In Brazil, a study carried out in adolescents of Florianópolis( Reference Adami, Schlickmann Frainer and de Souza Almeida 19 ) used a scale adapted from Childress et al. with eight figures( Reference Childress, Brewerton and Hodges 20 ) to evaluate body contour and correlate data for the contour identified by the child with the child’s BMI Z-score. Results showed that both males and females with larger BMI Z-scores chose larger body contours. In Valparaíso, Chile( Reference Lizana, Simpson and Yáñez 21 ), Body Silhouette Charts were applied and compared with the person’s real BMI in order to evaluate body image and to establish a possible correlation between the perceived weight in the body image and the real nutritional status in students from 6 to 13 years of age. More females than males underestimated their weight (62·5 v. 52·5 %) and 98·1 % of the individuals with obesity underestimated their weight, while the same behaviour was observed in 100 % of the children with an overweight condition. In Bucaramanga, Colombia( Reference Rueda-Jaimes, López Camacho and Flórez 22 ), the body image of adolescents was evaluated using the Gardner scale and the Standard Figural Stimuli, and the authors found good evidence of their validity and reliability when comparing with BMI.
In a recent review of the literature about body image in children, Neves et al.( Reference Neves, Cipriani and Meireles 23 ) found that the instrument used in 60·6 % of the studies reviewed was the silhouette scales. However, one of the main limitations was the use of non-validated collection instruments for the populations of interest. Most of the studies included in that review were carried out in the USA and Australia. In South America, Brazil is the country that has more publications, followed by Colombia and Chile. The authors recommended performing studies to create or validate scales for children, looking for a global understanding of infantile body image( Reference Neves, Cipriani and Meireles 23 ). At this point, to the best of our knowledge, there have been no multicentre studies comparing the reliability and validity of body weight and body image perception among children from South America.
Thus, the objectives of the present study in a South American population were to: (i) establish the reliability and validity of body weight perception reported by parents (in children aged 3–10 years) and self-reported by adolescents (aged 11–17 years); and (ii) establish the reliability and validity of a body image scale reported by parents (in children aged 3–10 years) and self-reported by adolescents (aged 11–17 years).
Materials and methods
Study design and participants
The South American Youth/Child Cardiovascular and Environmental (SAYCARE) Study is an observational, multicentre, feasibility study, which was carried out in seven South American cities (Buenos Aires, Lima, Medellín, Montevideo, Santiago, São Paulo and Teresina) designed to examine the reliability and validity of several nutritional, cardiovascular health, environmental, social and lifestyle methods. Six hundred and thirty-five children (3–10 years old) and four hundred adolescents (11–17 years old) were included in the analysis. A detailed description of the SAYCARE methodology has been published elsewhere( Reference Carvalho, Moreno and Silva 24 ).
A questionnaire about body weight and body image perceptions was completed by adolescents (11–17 years old) and children’s parents (3–10 years old). Only those aged 11 years or older answered the questions themselves. For the others, following the recommendation of Lanfer et al. ( Reference Lanfer, Hebestreit and Ahrens 25 ), it was the parent/caregiver who answered the questions.
Sample size calculations were performed to test the reliability and validity of body weight perception and body image perception. For both analyses, the sample size was calculated using Cronbach’s α=0·65, α=5 % and 1–β=80 %( Reference Gardner, Stark and Jackson 18 ). From these parameters, the necessary sample size estimated was 125 participants. Considering the possible loss of participants, a 20 % larger sample size was recruited for these analyses (n 150 for reliability).
Body weight was measured to the nearest 0·1kg using a digital scale (WISO W801; Barreiros, Brazil). Height was measured to the nearest 0·1cm using a stadiometer (Cardiomed WSC; Paraná, Brazil). Anthropometric measurements were done at least in duplicate; a third measurement was done when the difference between the first and the second measures was greater than 0·1 kg for body weight or 0·5cm for height. Measurements were carried out by two trained anthropometrists following the standard techniques described by Lohman et al.( Reference Lohman, Roche and Martorell 26 ).
Body weight perception was evaluated by asking to adolescents and children’s parents the following question with five answer options: ‘Do you think you/your child are/is: severely wasted, wasted, normal weight, overweight, obese?’ For testing reliability, this question was asked twice, two weeks apart (T1 and T2). For validation of the body weight perception, the answers were compared with the WHO BMI classification for children and adolescents, which has five categories: severely wasted, wasted, normal weight, overweight and obese( Reference de Onis, Onyango and Borghi 27 , 28 ).
The scale proposed by Gardner et al. ( Reference Gardner, Stark and Jackson 18 ) was used to evaluate body image perception. This scale consists of thirteen silhouettes developed using data from the US National Center for Health Statistics. The central silhouette corresponds to the median weight in the National Center for Health Statistics growth chart; there are six silhouettes to the right that increase the weight by 5 % each and six silhouettes to the left that decrease the weight by 5 % each (Fig. 1(a)). In order to test reliability, the Gardner scale was applied twice, two weeks apart (T1 and T2). The thirteen silhouettes were also compared with BMI Z-scores for validation. The central silhouette matched the Z-score range between −0·50 and 0·50; in the six silhouettes to the right that increased by 0·5 Z-score units each and in the six silhouettes to the left that decreased by 0·5 Z-score units each (Fig. 1(b)).
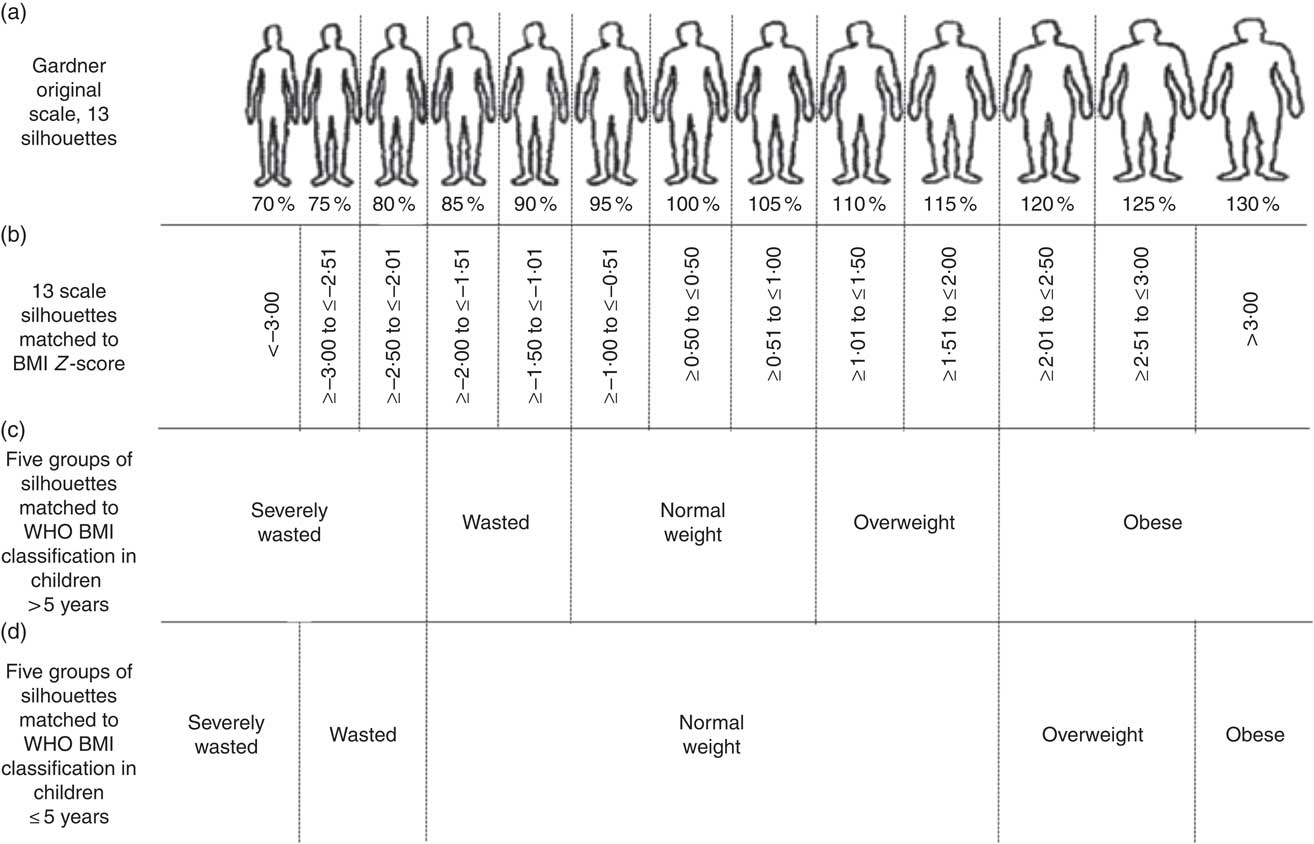
Fig. 1 Body image perception scale and matching BMI Z-score according to WHO classification: (a) Gardner’s original scale, thirteen silhouettes( Reference Gardner, Stark and Jackson 18 ); (b) thirteen scale silhouettes matched to BMI Z-scores; (c) five groups of silhouettes matched to WHO BMI classification in children aged >5 years; (d) five groups of silhouettes matched to WHO BMI classification in children aged ≤5 years
In a subsequent analysis, the data of the thirteen silhouettes from the Gardner scale were classified into five groups to match the BMI classification. For children older than 5 years of age, the silhouettes labelled less than 80 % were classified as severely wasted; silhouettes labelled 85 to 90 % were classified as wasted; silhouettes labelled 95 to 105 % were classified as normal weight; silhouettes labelled 110 to 115 % were classified as overweight; and silhouettes labelled higher than 120 % were classified as obese (Fig. 1(c)). For children who aged 5 years or younger, the silhouette labelled 70 % was classified as severely wasted; silhouettes labelled 75 to 80 % were classified as wasted; silhouettes labelled 85 to 115 % were classified as normal weight; silhouettes labelled 120 to 125 % were classified as overweight; and the silhouette labelled 130 % was classified as obese (Fig. 1(d)).
Statistical analyses
The SAYCARE questionnaire followed the universalistic methodology proposed by Herdman et al. ( Reference Herdman, Fox-Rushby and Badia 29 ). The reliability (test–retest reliability) between body weight perception and body image perception at two different times (T1 and T2) was evaluated using Kendall’s tau-c coefficient. The inter/intra-instrument reliability was evaluated with Cronbach’s alpha coefficient.
For validity, body weight perception and body image perception at T1 and the BMI classification data were analysed in the following two steps. First, weighted kappa coefficients (criterion validity) were interpreted according to Landis and Koch: κ values above 0·80 indicated almost perfect agreement, values between 0·61 and 0·80 indicated substantial agreement, values from 0·41 to 0·60 indicated moderate agreement, values from 0·21 to 0·40 indicated fair agreement, values between 0·00 and 0·20 indicated slight agreement, and κ values below 0·0 indicated poor agreement( Reference Landis and Koch 30 ). Second, a receiver-operating characteristic curve was applied to calculate the predictive validity and accuracy of T1 to predict excess body weight (overweight and obesity). The receiver-operating characteristic curve provides the whole spectrum of specificity/sensitivity values for all the possible cut-offs. The area under the curve (AUC) is determined from plotting sensitivity v. 1 – specificity. Taking into account the suggested cut-off points, the test can be non-informative/test equal to chance; less accurate (0·5 AUC ≤ 0·7); moderately accurate (0·7>AUC ≤ 0·9); highly accurate (0·9>AUC<1·0); or perfectly discriminatory (AUC=1·0)( Reference Swets 31 ).
The analyses were carried out in the statistical software packages IBM SPSS Statistics® for Windows, version 24.0 and Stata version 15.0. The criterion for statistical significance was a two-sided P<0·05.
Results
The total sample included in the present study comprised 635 children and 400 adolescents; 51 % were female. The mean BMI in both groups was appropriate for their age: 17·62 (sd 3·43) kg/m2 in children and 21·62 (sd 3·95) kg/m2 in adolescents, corresponding to a mean BMI-for-age Z-score of 0·72 (sd 1·22) and 0·55 (sd 1·10), respectively.
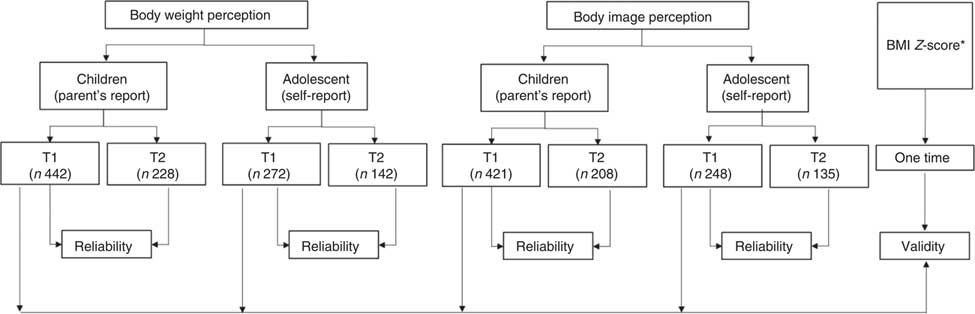
The numbers of adolescents and children’s parents who answered the questions about body weight perception and body image perception appear in Fig. 2. The samples do not have the same size for both variables because some of the participants did not respond to all the questions. A total of 442 parents and 272 adolescents answered the question about body weight perception at T1. The body image perception was evaluated among 421 parents and 248 adolescents who answered the question at T1. The number of participants decreased by T2 for both body image perception and body weight perception.
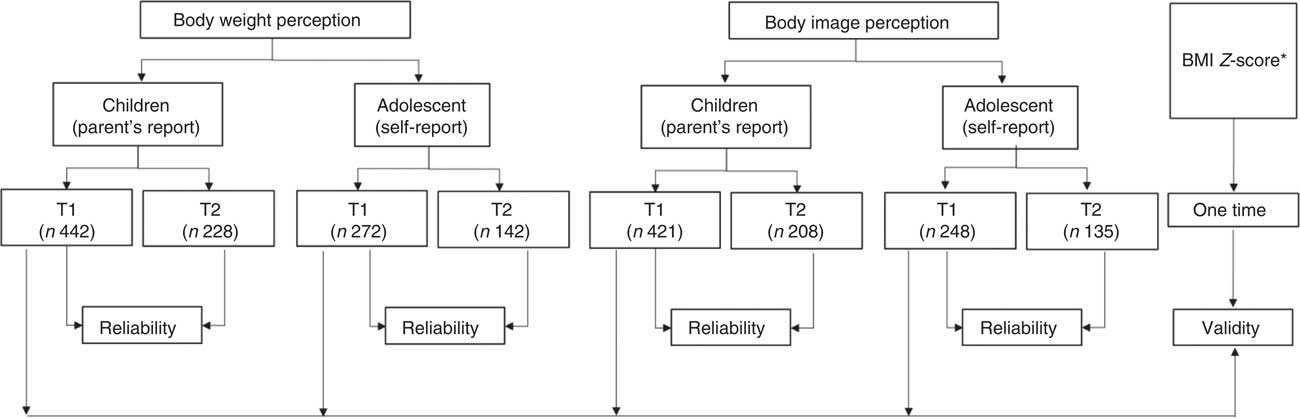
Fig. 2 Numbers of parents of children (aged 3–10 years) and adolescents (aged 11–17 years) participating in reliability and validity assessments of body weight and body image perception; South American Youth/Child Cardiovascular and Environmental (SAYCARE) Study (T1, time 1; T2, time 2 (two weeks later)). *BMI Z-score was classified according to the 2006 WHO references
The reliability of body weight perception was fair (κ=0·337) among children’s parents and substantial (κ=0·709) among adolescents (Table 1). The validity of body weight perception, when compared with BMI Z-score, was slight among children’s parents (κ=0·176) and fair among adolescents (κ=0·268; Table 2). Among children’s parents, validity of body weight perception was higher in those whose children were wasted (38·5 %) and had normal weight (68·9 %) than in those whose children were overweight (25·0 %) or obese (15·7 %; Table 2).
Table 1 Reliability of body weight perception among parents of children (aged 3–10 years) and adolescents (aged 11–17 years) from public and private schools and high schools from six South American countries (Argentina, Peru, Colombia, Uruguay, Chile and Brazil); South American Youth/Child Cardiovascular and Environmental (SAYCARE) Study
T1, time 1; T2, time 2 (two weeks later); τ c, Kendall’s tau-c coefficient; κ, kappa coefficient.
Table 2 Validity of body weight perception against BMI classification among parents of children (aged 3–10 years) and adolescents (aged 11–17 years) from public and private schools and high schools from six South American countries (Argentina, Peru, Colombia, Uruguay, Chile and Brazil); South American Youth/Child Cardiovascular and Environmental (SAYCARE) Study
τ c, Kendall’s tau-c coefficient; κ, kappa coefficient.
The reliability of body image perception was slight (κ=0·124) among children’s parents and moderate (κ=0·599) among adolescents (Table 3). Most of the children were perceived by their parents with silhouettes labelled 70 to 85 %. Adolescents, on the other hand, perceived their body image with silhouettes labelled 90 to 110 % (Table 3). The validity of body image perception, when compared with the BMI Z-score, was poor among children’s parents (κ=−0·018; P=0·147) and slight in adolescents (κ=0·023; P=0·251; data not shown).
Table 3 Reliability of body image perception (Gardner’s original scale, thirteen silhouettes( Reference Gardner, Stark and Jackson 18 )) among parents of children (aged 3–10 years) and adolescents (aged 11–17 years) from public and private schools and high schools from six South American countries (Argentina, Peru, Colombia, Uruguay, Chile and Brazil); South American Youth/Child Cardiovascular and Environmental (SAYCARE) Study
T1, time 1; T2, time 2 (two weeks later); τ c, Kendall’s tau-c coefficient; κ, kappa coefficient.
When the results from the Gardner scale were classified in five groups to match the BMI classification, their reliability was fair among children’s parents (κ=0·211) and substantial among adolescents (κ=0·732; Table 4). The validity of the five groups, when compared with BMI Z-score, was poor among children’s parents (κ=−0·011; P<0·001) and slight among adolescents (κ=0·083; P=0·029; data not shown).
Table 4 Reliability of body image perception (Gardner’s original scale, thirteen silhouettes( Reference Gardner, Stark and Jackson 18 ), regrouped into five groups) among parents of children (aged 3–10 years) and adolescents (aged 11–17 years) from public and private schools and high schools from six South American countries (Argentina, Peru, Colombia, Uruguay, Chile and Brazil); South American Youth/Child Cardiovascular and Environmental (SAYCARE) Study
T1, time 1; T2, time 2 (two weeks later); τ c, Kendall’s tau-c coefficient; κ, kappa coefficient.
Inter/intra-instrument reliability results for both age groups and both measurements (T1 and T2) showed a substantial stability of the administered tests and that the results were consistent. For children’s parents, Cronbach’s α=0·6386 (T1) and 0·6687 (T2); for adolescents, Cronbach’s α=0·5949 (T1) and 0·7687 (T2).
The results of predictive validity are shown in the online supplementary material, Supplemental Table 1. Body weight and body image perception for both age groups presented moderate accuracy (AUC≥0·722) to detect excessive body weight (overweight and/or obesity).
Discussion
According to the knowledge of the authors, the present study is the first multicentre one assessing the reliability and validity of body weight and body image perceptions among adolescents and children’s parents in South America. Reliability of body weight perception was fair in children’s parents and substantial in adolescents; validity of body weight perception was slight in children’s parents and fair in adolescents. Reliability of Gardner’s thirteen figures scale was slight in children’s parents and substantial in adolescents; validity of the scale was poor in children’s parents and slight in adolescents. After matching Gardner’s scale to the five BMI categories, the reliability improved in children’s parents and adolescents; however, validity was still poor in children’s parents and decreased in adolescents. The poor results in reliability and validity among children’s parents can be due to multiple aspects. First is the fact that it was the parents who answered the questionnaires; a decision based on other studies indicating that before the age of 8 years the correlations between children’s self-evaluations and their BMI are lower than in other age groups( Reference Lombardo, Battagliese and Pezzuti 17 ). Second, the self-report methodology can be affected by the caregivers/parents’ level of education; some studies suggest that with a lower level of parents’ education there is more error in the selection of the silhouettes that estimate their children’s weight( Reference Hudson, McGloin and McConnon 32 , Reference Chávez Caraza, Rodríguez de Ita and Santos Guzmán 33 ). Besides, there was a lack of control on who answered the questionnaires when they were sent to the children’s houses, and the perception of the child’s weight could be different if it was the mother or the father who answered the questionnaire( Reference Chávez Caraza, Rodríguez de Ita and Santos Guzmán 33 ). Finally, the use of Gardner’s scale with thirteen silhouettes( Reference Gardner, Stark and Jackson 18 ) could have made difficult to choose the same figure at two different times.
The results for validity of body weight perception in children’s parents were similar to those found in studies in Mexico( Reference Guevara-Cruz, Serralde-Zúñiga and Frigolet Vázquez-Vela 34 ) and Puerto Rico( Reference Rivera-Soto and Rodríguez-Figueroa 35 ), confirming there is low validity between parents’ perception of their child’s weight and the child’s real BMI (κ=0·164, Kendall’s τ c=0·124). Similar reports were presented by other studies from Chile( Reference Nuño, Hevia and Bustos 36 ) and Mexico( Reference Flores-Peña, Acuña-Blanco and Cárdenas-Villarreal 37 ), where the authors concluded that parents of children with overweight have a distorted body image of them and tend to perceive them to be thinner than they really are. In the study from Mexico, it was also found that only a small proportion of mothers of children with overweight or obesity were able to perceive their child’s weight correctly.
A study performed in Monterrey, Mexico( Reference Chávez Caraza, Rodríguez de Ita and Santos Guzmán 33 ) evaluated the BMI of 605 children and compared it with a scale of silhouettes. It found that 98·8 % of parents underestimated the nutritional status of 161 children with overweight or obesity. This underestimation by the parents can be considered a risk factor for the development and/or maintenance of overweight and obesity. Another study from Mississippi, USA( Reference McKee, Long and Southward 38 ) concluded that the stronger predictor of obesity in children was the difference between the children’s real BMI and the one perceived by their parents.
The poor results in terms of the validity of body weight and body image perceptions among children’s parents can be due to the distortion between a child’s real BMI and the one perceived by the parents, which seems to be modified by the child’s nutritional status( Reference Duchin, Mora-Plazas and Marin 39 ). In the present study, body weight and body image perceptions had higher validity among children with normal weight and the lowest validity was among children with obesity.
Reliability of body image perception through Gardner’s scale was substantial. These results are contrary to those from a study carried out in Bucaramanga, Colombia( Reference Rueda-Jaimes, López Camacho and Flórez 22 ), where the reliability of the Gardner scale was excellent (concordance of 0·93) among secondary-school students from public and private institutions. The differences in the results can be due to the facts that the questionnaires were applied differently, and also that the questionnaire was much longer in the present study, because, as mentioned before, the present study is part of a multicentre study that had different objectives; therefore, the participants’ willingness to answer the questions in a trustworthy manner could have been affected.
The validity of the scale of silhouettes among adolescents was poor. The reliability improved after grouping the scales into five categories of BMI; however, the validity was still poor when compared with BMI Z-scores. The previous result could be explained by the difference between men’s and women’s ideal body image, which is conditioned by cultural, social and psychological aspects. The study from Valparaíso, Chile( Reference Lizana, Simpson and Yáñez 21 ) found poor concordance for the validity between nutritional status, perceived with a seven-figure scale, and real BMI. Those concordances oscillated between 0·031 and 0·275, similar to the values found herein.
The methodology of the studies on body image perception among children and adolescents is diverse, and so are their results( Reference Côrtes, Meireles, Friche and de 40 ). This could happen because the body image construct is complex and it is influenced by individual, family, cultural and contextual aspects, all of them determining the children’s and adolescents’ own perception of their body weight, as well as the parents’ perception of their children’s body weight. This represents an aspect to consider when developing health promotion programmes and illness prevention programmes, as it is necessary that parents recognize from the first stages of life what is the normal weight for their children in order to control and prevent malnutrition, especially overweight among children and adolescents. Reducing overweight and obesity is relevant because it has been found that overweight in childhood tends to remain during adult life and brings health risk factors, especially for CVD( Reference Chávez Caraza, Rodríguez de Ita and Santos Guzmán 33 ).
As a limiting condition, it is important to acknowledge that the present study used a convenience sample and therefore it is not representative. Finally, given that the study was carried out in seven cities from six countries, there could be sociocultural conditions that are expressed through a different perception of body weight and body image.
Conclusion
The present study results allow us to conclude that body weight and body image perceptions have a higher reliability among adolescents than among children’s parents. Therefore, it is recommendable to perform studies comparing different methodologies of evaluation with children. The validity of body weight and body image perceptions compared with BMI Z-score was poor among adolescents and children’s parents. However, the validity of body weight perception was good when adolescents and children had normal weight or were wasted, and it was fair when both groups were overweight.
Supplementary material
To view supplementary material for this article, please visit https://doi.org/10.1017/S1368980018004020
Acknowledgements
Acknowledgements: All authors acknowledge each school dean/chair, the children, adolescents and their respective parents for their voluntary participation in SAYCARE Study. In addition, they acknowledge Mr Andrew Mello Silva for management of the SAYCARE database. Colombia acknowledges the undergraduate students Carolina Alzate-Echeverri, Luisa Fernanda Arroyave-Zuleta, Sarah Ortiz-Calderón and Paola Zapata, for helping collect information and data entry; also nutritionist Juliana Diaz for helping with general processes. Uruguay acknowledges nutritionists Verónica Bauza, Iliana Carlini, Sofía Deveras, Stefani Izzi, Alejandra Olivera and Sofía Petingi for helping collect information and data entry. Argentina acknowledges the undergraduate students Sabrina Diaz, Lucina Bavosa and Julieta Vacarezza, and nutritionists Luciana Suca, Jesica Puca, Rocío Marcé and Candela Lepera, for helping collect information and data entry. Financial support: The SAYCARE Study was supported mainly by the Brazilian Government from the National Counsel of Technological and Scientific Development (CNPq; grant number 471266/2013-2) and the São Paulo State Government from the São Paulo Research Foundation (FAPESP; grant number 2014/11468-6). The SAYCARE Study was also co-funded by other agencies in the other countries: (i) the Collaborative Projects Fund (RD number 501-2015-INSN-DG-OEA) granted by the Instituto Nacional de Salud del Niño, Lima, Perú; (ii) the Sustainability Strategy at the University of Antioquia 2014–2015, Research Group of Social and Economic Determinants of Health and Nutrition, and Demography and Health Research Group at the University of Antioquia, Medellín, Colombia, and Interuniversity Services Corporation (CIS) from University of Antioquia; (iii) the Secretary of University Extension and Student Welfare, University of Buenos Aires, Buenos Aires, Argentina; and (iv) the European Regional Development Fund (MICINN-FEDER) to the GENUD Research Group. The General Coordination of SAYCARE received several scholarships to develop the project: A.C.F.D.M. was given a postdoctoral scholarship from CNPq (grant number 313772/2014-2) and FAPESP (grant numbers 2014/13367-2 and 2015/14319-4). L.A.M. was given a scholarship as visiting professor from FAPESP (grant number 2015/11406-3). H.B.C. is in receipt of an advanced scientist scholarship from CNPq (grant number 300951/2015-9). E.S. is in receipt of a doctoral scholarship from Carolina Foundation. Conflict of interest: None. Authorship: L.I.G.-Z., S.L.R.-M., J.C.A., E.S., T.S.C., L.B.A., W.V.N.-J., L.A.M., A.C.F.D.M., H.B.C. and A.E.-R. were involved in the data collection. L.I.G.-Z., S.L.R.-M., J.C.A., E.S., A.E.-R. and L.A.M. were involved in the conducting, analysis and writing of the manuscript. All authors were involved in writing the paper and had final approval of the submitted and published versions. Ethics of human subject participation: The study was performed according to the Declaration of Helsinki and was approved by the Bioethical Review Board of the Research System from the University of Antioquia, Medellín, Colombia (certificate number 14-43-596, 28 May 2014). Informed consent was obtained from all participants and guardians of the children.