

Globally, the negative health consequences of malnutrition and infection are a leading cause of morbidity and mortality in children, contributing to 53 % of all deaths in children under 5 years of age(Reference Bryce, Boschi-Pinto and Shibuya1–Reference Black, Morris and Bryce4). Malnutrition is estimated to contribute to 45 % of measles deaths, 52 % in pneumonia, 57 % in malaria and 61 % in diarrhoea(Reference Bryce, Boschi-Pinto and Shibuya1–Reference Black, Morris and Bryce4). Few studies have been undertaken in school-aged children. Poverty, lack of health care, high infection burden, diets containing negligible amounts of animal-source foods (ASF) and deficiencies in macro- and micronutrients are contributing factors(Reference Black, Morris and Bryce4–Reference Black, Allen and Bhutta7). Severe protein–energy malnutrition and coexisting micronutrient deficiencies are associated with decreased immune function(Reference Scrimshaw and SanGiovanni8, Reference Neumann9). Children with severe protein–energy malnutrition often have high case fatality rates, particularly from measles, pneumonia, diarrhoea, malaria and tuberculosis(Reference Caulfield, de Onis and Blossner2, Reference Black, Morris and Bryce4).
Deficiencies of Fe, Zn, vitamin A and vitamin B12 can impair cell-mediated immunity and granulocyte function, resulting in disruption of anatomic barriers to pathogens(Reference Ross10–Reference Ekiz, Agaoglu and Karakas14). Multiple micronutrient fortification of milk has been shown to reduce instances of pneumonia, diarrhoea, measles and high fever(Reference Juyal, Osmamy and Black15). Fe and Zn supplementation decrease risk of severe diarrhoea and acute respiratory infections(Reference Baqui, Black and Arifeen16, Reference Baqui, Zaman and Persson17), and Zn and vitamin A in combination reduce persistent diarrhoea prevalence in children(Reference Rahman, Vermund and Wahed18). Vitamin A supplementation alone has been shown to decrease mortality(Reference Imdad, Herzer and Mayo-Wilson19, Reference Imdad, Yakoob and Sudfeld20), prevalence of various morbidities(Reference Haidar, Tsegaye and Mariam21, Reference Chowdhury, Kumar and Ganguly22), clinical malaria episodes(Reference Shankar, Genton and Semba23) and diarrhoea severity(Reference Long, Rosado and DuPont24), as well as prevent acute respiratory infections in infants and children(Reference Long, Rosado and DuPont24–Reference Humphrey, Agoestina and Wu26). However, other studies show no effect of vitamin A supplementation on incidence of acute respiratory infections and severity or diarrhoea morbidity(Reference Imdad, Herzer and Mayo-Wilson19, Reference Fischer Walker and Black27). Zn supplementation has been associated with improvements in cell-mediated immunity(Reference Sazawal, Jalla and Mazumder28, Reference Prasad29) and was effective in treating prolonged bouts of diarrhoea, pneumonia and malaria episodes in malnourished children(Reference Bhandari, Bahl and Taneja30–Reference Black36).
Fe and Zn deficiency may reduce chemotaxis and bactericidal function(Reference Oppenheimer37). Combined Fe and Zn supplementation in poorly nourished 6-month-old infants resulted in lower risk of developing severe diarrhoea and acute lower respiratory infection(Reference Baqui, Zaman and Persson17). Fe-supplemented Sri Lankan children (5–10 years old) experienced fewer upper respiratory infections (URI) and fewer total number of days sick compared with placebo children(Reference de Silva, Atukorala and Weerasinghe38). Fe supplementation can also increase morbidity depending on the host's Fe status. A systematic review of twenty-eight Fe supplementation studies documented increased risk for developing diarrhoea in Fe-supplemented children but not increased risk for developing overall infection(Reference Gera and Sachdev39). Fe administered to infants with severe protein–energy malnutrition and low transferrin has been associated with acute exacerbations of clinical malaria and increased morbidity from other infectious diseases, attributed to unbound free Fe which enhances bacterial multiplication(Reference Oppenheimer37). Fe and riboflavin deficiency may confer protection against clinical malaria, but the evidence is inconclusive(Reference Nyakeriga, Troye-Blomberg and Dorfman40–Reference Rivlin and Dutta42). Fe-supplemented pre-school children (aged 1–35 months) in an area with endemic malaria showed an increased risk of death or hospitalization from malarial adverse events(Reference Sazawal, Black and Ramsan43).
A wide variety of ASF (including blood, offal, fish, insects and molluscs) contain energy, complete protein and micronutrients such as bioavailable Fe and Zn, vitamin B12 and preformed vitamin A(Reference Murphy and Allen5). Several food-based ASF interventions have demonstrated reductions in morbidity, namely fever, respiratory and diarrhoeal infections and anaemia(Reference English, Badcock and Giay44–Reference Yeudall, Gibson and Kayira46). The current paper reports on the first cluster randomized, controlled feeding intervention to examine the effect of ASF compared with plant-based foods on morbidity outcomes among schoolchildren, an understudied group. It was hypothesized that children in the feeding groups receiving milk or meat would experience fewer and less severe morbidity episodes than children in the Plain Githeri group, receiving the isoenergetic maize/bean dish, and the Control group. Cluster randomization was chosen for practical reasons as it would have been impossible to prepare and deliver feedings to individual households or to prepare and deliver different feedings within the same school.
Experimental methods
The study was conducted in rural Embu District, Eastern Province, Kenya, 120 km north-east of Nairobi. The study area covered 60 km2 with gradients of altitude and rainfall, ranging from a semi-arid area at 1200 m to an area with greater rainfall at 1500 m. Distinguishable seasons generally included long rains from March to May, short rains from October to November, a warm dry season from January to March, and a cooler dry season from July to September. Universal compulsory primary school education exists in this area, so most children attend at least Standards 1 to 3 of primary school. In the study area households own several goats and chickens, but few own larger animals, and ASF is rarely consumed except for modest amounts of milk and eggs. There is occasional consumption of worms, termites and molluscs, but rarely fish. Intakes of total animal-source protein, protein from meat, fish and poultry, and vitamin A are extremely low(Reference Neumann, Bwibo and Murphy47). Diets contain high levels of fibre and phytate and poorly bioavailable Fe and Zn(Reference Neumann, Bwibo and Murphy47–Reference Murphy, Gewa and Liang49).
Study design
Twelve of eighteen schools in two sub-locations with ~2600 households were selected for cluster randomization (Fig. 1). Six schools were initially eliminated because of size and inaccessibility for food delivery due to impassable roads during rainy seasons. Thus, twelve schools were randomized to one of three feeding intervention groups or a Control group, with three schools per each feeding condition. Schools were ~3–5 km apart with little chance for exposure to each other as the study area was rural with scattered farms, with walking as the main mode of transportation. All Standard 1 classrooms at each school were assigned to the same feeding intervention or to the Control condition.
Trial profile

A second cohort of Standard 1 children was enrolled because a 6-week teacher's strike occurred six weeks after Cohort I enrolment, resulting in disruption of feedings and data collection, and because of a severe, worsening drought. Cohort II was enrolled exactly one year later, with schools assigned to the same feeding group as in Cohort I. Feeding for both cohorts occurred only when school was in session (three terms per year) and no feeding occurred during the one-month school vacations between terms. Feeding took place from September 1998 to December 2000 for Cohort I and from September 1999 to December 2001 for Cohort II.
Participants
The initial sample of Standard 1 children had 1078 children (554 in Cohort I; 524 in Cohort II). The final analytical sample was 902 children (130 were excluded due to missing data, five died, thirty-three left the study area, and eight were excluded from data collection due to mental or physical handicaps but fed with classmates). Data for children who left the study area remained in the analysis to the point that they moved.
Feeding intervention
The three supplemented groups received mid-morning ‘snacks’ at school each school day. The Control group participated in all measurements but did not receive an intervention feeding. School snacks for the intervention groups were based on githeri, a local stew of maize, beans and greens. For the Meat group, finely ground beef with 10–12 % fat was added to githeri. The Milk group received 250 ml of whole ultra-heat-treated (UHT) cow's milk plus githeri. The vitamin B12 content of UHT milk was measured and found comparable to that of pasteurized fresh milk. The Plain Githeri group received githeri with additional oil (Kimbo; Unilever, East African Industries, Nairobi, Kenya) rendering it isoenergetic with the other snacks. Oil was used in the preparation of all three snacks, but the greatest amount of oil was added to the Plain Githeri group (5·2 g/snack, compared with 3·6 g/snack in the Milk snack and 1·6 g/snack in the Meat snack). Midway through the study, the oil, which was not originally labelled by the manufacturer as fortified, was discovered to have been fortified with retinol (37 μg retinol/g fat).
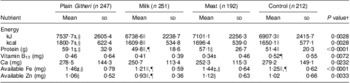
Snack ingredients were increased by ~25 % after four months as the children increased in size and because of a persistent drought and food shortages. Snacks contained approximately one-fifth of the recommended daily energy intake for age and gender. Nutrient composition of snacks is summarized in Table 1 and has been described previously(Reference Murphy, Gewa and Grillenberger48, Reference Murphy, Gewa and Liang49). Milk and beef were familiar and culturally acceptable foods. Children were observed eating the school snack. Their numbered containers were collected and leftovers measured, weighed and recorded. For more than 98 % of feeding sessions, snacks were completely consumed(Reference Gewa, Murphy and Bwibo50). Quality control procedures have been described previously(Reference Neumann, Bwibo and Murphy47).
Nutrient content of school snacksFootnote †
RE, retinol equivalents.
Modified from Neumann et al.(Reference Neumann, Jiang and Weiss64).
† The nutrient content presented in this table reflects the increase of 25 % of the initial recipe that occurred after 3 months of the study because of a prolonged drought and food shortage in the study area.
‡ Availability of the snack's Fe and Zn is assumed to be equal to the average availability across the day's intake (9 % and 13 % for Fe and Zn, respectively). If the snack is consumed alone, availability would be higher for the meat snack; available Fe would be ~0·53 mg and available Zn ~1·36 mg.The snack was consumed alone almost all of the time.
§ This value reflects the amount of vitamin A originally calculated based on the known ingredients using the WorldFood 2 Dietary Assessment Program and analyses of known ingredients by Medallion Laboratories. This value does not include the retinol from the commercial oil added to make snacks isoenergetic. This oil was not labelled as retinol-fortified by the manufacturer (Unilever, East African Industries, Nairobi, Kenya) until some time after the study began.
∥ This value reflects the amount of vitamin A from the oil. This oil was not labelled as retinol-fortified by the manufacturer until some time after the study began.
Child measures
Initial health histories and physical examinations were carried out by physicians. Splenomegaly, indicative of endemic malaria, was assessed by palpation (measured in cm below the mid-left costal margin). Nutritional status was assessed by anthropometry and by the presence of signs of nutritional deficiencies(Reference Gibson51). Due to funding limitations, serum biochemical analyses for vitamins A, B12, riboflavin, Fe and Zn were performed only at baseline and the end of year one for Cohort I. Analytical methods used have been fully described previously(Reference Siekmann, Allen and Bwibo52). Stool samples were examined for intestinal ova and parasites using the formal–ether sedimentation method and Lugol's stain(Reference Carter and Orgenes53). Hb was measured using the Hemocue apparatus(Reference Bridges, Darvin and Van Assendelft54). Malaria antigen dipsticks (Vision Biotech, Cape Town, South Africa) were used to detect Plasmodium falciparum malaria infection, the predominant type in the area, annually and whenever malaria was suspected(Reference Neumann, Bwibo and Siekmann55). Clinical diagnoses of typhoid were based on laboratory serologic confirmation tests at the health centre or hospital (Widal titre).
Morbidity assessment
Morbidity prevalence data were collected by home visits every month for eight months for Cohort I, then every other month thereafter for Cohort I and every second month for both years of Cohort II. Thus, there were fifteen morbidity data collection visits for Cohort I and twelve for Cohort II.
The child's caregiver was asked to describe the child's illness in her own words. Then a structured questionnaire was used to ask about signs and symptoms of illness in the child on the day of the home visit and in the six preceding days. If the child was ill at home, specified visual observations of the child were made and recorded. Forms contained signs and symptoms organized by general non-specific and specific categories, comprising an illness category or clinical diagnosis. Familiar vernacular terms for common diseases were used. Morbidity outcomes are listed in Table 2, consisting of signs and symptoms found in commonly prevalent conditions. Reduced activity, being bedridden, having anorexia and fever were included as indicators of severe illness.
Morbidity outcome variables
†Includes: malaria, fever, chills, diarrhoea with >3 watery stools per day, lower respiratory infection (pneumonia), typhoid, jaundice, and illnesses accompanied by reduced food intake and/or physical activity and being bedridden.
‡Indicators of severity.
The morbidity interview form was translated into the local language (Kiembu) and back-translated to English. Bilingual enumerators completed the forms in English to facilitate quality checks and data entry. The supervising nurse was consulted about puzzling findings or possible serious illness (i.e. pneumonia, dehydration, convulsions, etc.) and promptly visited the child to determine if a physician evaluation and possible health facility referral were needed.
Morbidity quality control measures included intensive preliminary and ongoing training of enumerators by the physician, clinical officer and supervisory nurse, and re-interviews by the lead enumerator and nurse several hours later on 5 % of interviews. Percentage agreement on specific findings and general categories of illness was 95 %. Medications and visits to a health facility were verified by available clinic or hospital cards. All forms were checked daily in the field by the lead morbidity enumerator for immediate correction of errors and/or missing data. Data were entered into a computer database. Ranges were printed out to enable checking for potential errors.
For health and ethical reasons, children with severe anaemia (Hb ≤ 7·0 g/dl in the absence of malaria) were initially treated with oral ferrous sulfate for 30 d and if they showed no positive Hb response after one month, were referred for further studies and treatment. Children with suspected malaria were referred to the health centre for testing and treatment. All children were ‘dewormed’ every 6–8 months with mebendazole (500 mg) to eradicate helminths. If a death occurred in a study child, the physician and/or nurse visited the home to carry out a ‘verbal autopsy’ and/or the clinic or hospital, to attempt to determine cause of death.
Household and family information
The household census, described previously(Reference Neumann, Bwibo and Murphy47), was conducted at baseline. A crowding score was calculated by dividing the number of people regularly living in the household by the number of rooms per household. Kitchens were classified as indoor or outdoor. Main water source and latrine type and usage were determined. The socio-economic status (SES) score, described in previous publications, was developed for the study population(Reference Neumann, Bwibo and Murphy47). Maternal literacy and writing level were assessed using graded material (Ministry of Education, Kenya). Maternal highest school grade completed was recorded.
Nutrition measures
Food intake and anthropometry, including quality control measures, were assessed at baseline and longitudinally according to methods described in detail elsewhere(Reference Neumann, Bwibo and Murphy47). Briefly, food intake was measured by semi-quantitative 24 h recalls from the mother and the child, if present. Data from three consecutive visits, 2–3 weeks apart, were averaged to provide usual food intake at baseline(Reference Neumann, Bwibo and Murphy47). Height, weight, head and arm circumferences, and triceps and subscapular skinfold thicknesses were measured by enumerators working in pairs, with results averaged(Reference Grillenberger, Neumann and Murphy56). Food intake and anthropometry were obtained monthly during the first year for Cohort I and every other month thereafter for both cohorts.
Statistical methods
ANOVA was used for continuous variables and a χ 2 test of independence was used for categorical variables to detect significant differences among feeding groups at baseline. The fifteen morbidity outcomes are all binary outcomes (present/absent) and repeated observations within a subject are correlated. Therefore a logistic model with subject-specific random intercepts, a particular example of a generalized linear mixed model (GLMM), was fit to each outcome with the SAS glimmix macro(Reference Weiss57). Age at baseline and gender were included in all models to adjust for differences in the mix of children across treatment groups. We included separate fixed intercepts for each school; feeding group intercepts were estimated as the average of the effects for the three schools for each feeding group; we also included feeding group by time interactions. Because there was a strong seasonal pattern in morbidity outcomes, we included sin(2π × time) and cos(2π × time) terms in all models to model seasonal effects with time measured in years; additional higher-frequency sine and cosine terms were not needed to fit the data well. We calculated pairwise comparisons among the feeding group slopes. The model estimated slopes on the logit scale for each treatment group and we also estimated pairwise differences between feeding group slopes. For all morbidities, we plotted the estimated probability of morbidity outcome (PMO) by treatment group for a male child with mean age and median random effect of 0 at times from baseline to 2 years.
Ethics
The study was conducted according to the Declaration of Helsinki. All procedures involving human subjects were approved by the UCLA Human Subjects Protection Committee, the Ethics Committee of the University of Nairobi, School of Medicine, and the Kenya Office of the President. Witnessed and formally recorded verbal informed consent was obtained from all parents. Oral witnessed assent from the children, teachers and principals was also obtained. Community leaders and members assented by voice vote at several community-wide meetings.
Results
Baseline findings
No significant differences between groups were seen for household SES, maternal reading level, school years completed by the mother or children's school attendance. Baseline characteristics of the children and baseline nutrient intake data for the children are presented in Tables 3 and 4. Mean age was 7·3 (sd 1·1) years. Baseline measures of anaemia and micronutrients are presented in Table 5. Children's immunization coverage was ~70 % for measles, polio, BCG (tuberculosis) and DPT (diphtheria, pertussis, tetanus). Eight per cent of families fetched drinking water from rivers and streams. Outdoor kitchens were used in 80·8 % of households. Crowding in the Cohort I sample was 2·3 (sd 1·2) persons per room(Reference Grillenberger, Neumann and Murphy58). Although 60 % of households had latrines, young children did not use these. Baseline stool examinations showed prevalence of Entamoeba hystolytica (21·4 %), Giardia lamblia (12·5 %), hookworm (2 %) and Ascaris spp. (3 %)(Reference Neumann, Bwibo and Murphy47). Few households had bed nets.
Baseline characteristics by study group (Cohorts I and II combined)
SES, socio-economic status.
†Based on the reading levels for each grade in the district primary schools.
‡Significantly different from the Meat group (P < 0·05).
§Significantly different from the Control group (P < 0·05).
∥Significantly different from the Plain Githeri group (P < 0·05).
¶Significantly different from the Milk group (P < 0·05).
Baseline daily nutrient intakes by study group (Cohorts I and II combined)
†P value of ANOVA testing the equivalence of means in the four intervention groups.
‡Significantly different from the Control group (P < 0·05).
§Significantly different from the Milk group (P < 0·05).
∥Significantly different from the Plain Githeri group (P < 0·05).
¶Significantly different from the Meat group (P < 0·05).
Baseline prevalence of anaemia and selected low micronutrient values by study group (Cohort I)Footnote †
Data from Siekmann et al.(Reference Siekmann, Allen and Bwibo52).
† Biochemical analyses were not performed for Cohort II due to funding constraints.
The baseline frequency of morbidities is summarized in Table 6. At baseline, 61·9 % of children had an illness, mainly infections, with 20·4 % having severe illness. The leading illness categories reported, in descending order, were URI (though with few cases of pneumonia), skin infections, poor appetite, reduced activity, fever, gastroenteritis (mainly diarrhoea), sore mouth and clinical malaria diagnosed and confirmed by testing in a health facility. Five children died during the study from malaria, hepatitis and presumed sepsis.
Baseline frequency of morbidity outcomes for all groups combined and by study group

†P value from χ 2 test for the equivalence of probabilities in the four intervention groups.
‡Severity based on illness type and accompanying chills, fever, reduced activity, being bedridden and reduced appetite.
§Mainly diarrhoea.
Baseline age and gender effects on morbidity
With increasing baseline age, the PMO for total illness and severe illness, malaria, poor appetite, reduced activity, URI and sore mouth showed statistically significant decreases (Table 7).
Parameter estimates by age and gender (boy) for baseline morbidity outcomes
*P ≤ 0·05, **P ≤ 0·01, ***P ≤ 0·001.
†Mainly diarrhoea.
Boys had significantly higher PMO rates than girls for total illness, sore mouth, skin infections and typhoid fever. In contrast, boys had significantly lower PMO for episodes of gastroenteritis and jaundice than the girls (Table 7).
Intervention findings
Seasonal effects
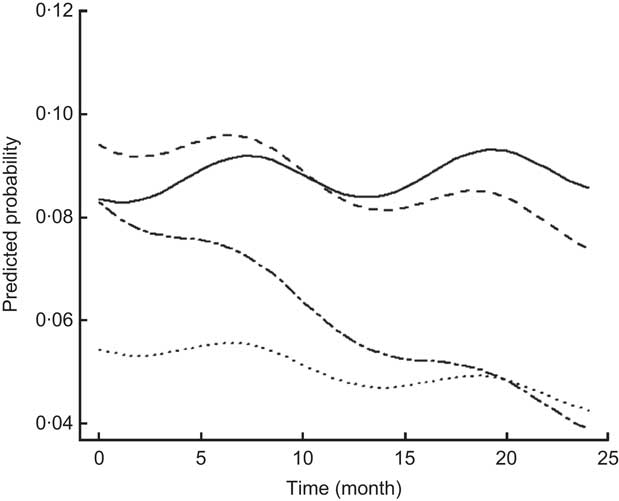
For most morbidity outcomes, significant and strong seasonal effects were apparent, with significant peaks and valleys. The peak for gastroenteritis prevalence was in March and early April, coinciding with the beginning of the rainy season (Fig. 2). The peaks for malaria (Fig. 3), poor appetite, fever and reduced activity were seen in March and April, coinciding with the long rains. For respiratory and ear infections, the peaks were noted in May (Fig. 4), coinciding with the beginning of the cold and drier season. Severe illness peaked in the rainy season (data not shown).
Estimated trends of gastroenteritis (mainly diarrhoea) over time (for boys at median age of 7·22 years old) according to study group (——, Control; – – –, Plain Githeri; — -—, Meat; ---, Milk)
Estimated trends of malaria over time (for boys at median age of 7·22 years old) according to study group (——, Control; – – –, Plain Githeri; — -—, Meat; ---, Milk)

Estimated trends of upper respiratory infection over time (for boys at median age of 7·22 years old) according to study group (——, Control; – – –, Plain Githeri; — -—, Meat; ---, Milk)

Morbidity outcomes by intervention group
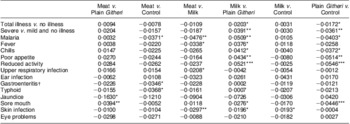
Rates of change in PMO for each morbidity outcome by feeding group are presented in Table 8. Except for sore mouth, which showed significant increases in all except the Plain Githeri group, every significant result showed a decrease in PMO. The only outcome that showed no significant decreases or increases was eye problems. The Meat group had a significant decrease in every morbidity outcome except sore mouth and eye problems. The Plain Githeri group showed significant decreases in total illness, severe illness, malaria, fever, chills, poor appetite, reduced activity and URI, but not in other morbidities. The Milk group showed significant decreases only for poor appetite and URI, as did the Control group. The Control group also showed significant decreases in fever and ear infection.
Slope estimates (time in months) on logit scale for morbidities by intervention group
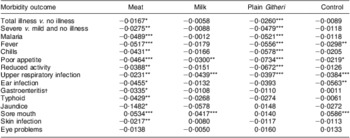
Negative values imply decreases in illness over time.
*P ≤ 0·05, **P ≤ 0·01, ***P ≤ 0·001.
†Mainly diarrhoea.
Differences in rates of change in PMO were seen by feeding group (Table 9). For most outcomes and for total and severe illness, the Plain Githeri and Meat groups showed the steepest statistically significant declines in slopes for PMO in comparison to the Milk and Control groups (Tables 9 and 10). The declines in the Plain Githeri group were not significantly different from those in the Meat group except for jaundice and sore mouth, where the Plain Githeri group fared better. The Meat group had significantly less malaria, gastroenteritis and typhoid than the Control group. The Milk group was not significantly different from the Control group except for skin infections, which were significantly fewer in the Control group. The Plain Githeri group had significantly less total illness, severe illness, malaria, chills, poor appetite, reduced activity and sore mouth than the Control group.
Pairwise comparisons of slopes between intervention groups for selected morbidity outcomes
Negative values mean that the first group of the pair had a higher rate of decrease in morbidity outcome. Positive values mean that the second group of the pair had higher rate of decrease in the morbidity outcome.
*P ≤ 0·05, **P ≤ 0·01, ***P ≤ 0·001.
†Mainly diarrhoea.
Summary of statistically significant changes in slopes for probability of morbidity outcomes
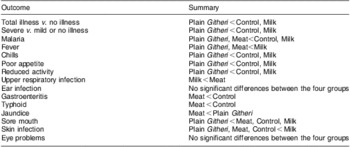
Here, ‘<’ means a greater decrease over time or ‘better’. For example, ‘Meat < Control’ for malaria means that the rate of malaria in the Meat group dropped faster than the rate in the Control group.
Discussion
We had hypothesized that children in the Meat and Milk groups would have the greatest reductions in PMO. The higher content of bioavailable Fe and Zn and vitamin B12 in the meat snack and the higher levels of vitamin A and B12 in the UHT milk were thought to promote improved cell-mediated immunity. The Meat githeri clearly conferred an advantage in reduction of gastroenteritis, typhoid, jaundice and clinical malaria with its accompanying symptoms (fever and chills). The greatest reduction in PMO for gastroenteritis and typhoid in the Meat group may be attributed to the greater concentrations of bioavailable Zn and Fe, and vitamin B12 in meat. Zn supplementation has been shown to prevent and successfully treat chronic diarrhoea (>2 weeks) in malnourished children(Reference Bhutta, Bird and Black31, Reference Fischer Walker and Black32, Reference Bhutta, Black and Brown59). In our sub-study of antibody titres to Helicobacter pylori and rotavirus, found to be the main causes of gastroenteritis in the area, the Meat group showed significant increases in protective IgM antibody responses(Reference Siekmann, Allen and Watnik60). This could also be a contributory mechanism by which the Meat group showed less gastrointestinal morbidity(Reference Siekmann, Allen and Watnik60). The reduction in clinical malaria in the Meat group may be related to improved Zn intake, which has been shown reduce the number of P. falciparum malaria febrile malarial episodes(Reference Shankar, Genton and Baisor35).
All groups showed declines in PMO for URI, and differences among the groups were not significant except for the Milk group decreasing significantly more than the Meat group. This may partly attributed to the higher vitamin A content in milk. The Control and Milk groups fared worse than the Plain Githeri group for total and severe illnesses and several morbidities. The Control group did not receive the additional energy and consumed lower amounts of protein, bioavailable Fe and Zn, vitamin B12, riboflavin and vitamin A than those receiving the school snacks.
The Plain Githeri group surprisingly showed a significantly greater decline in slopes for many morbidities compared with the Milk and Control groups, though not compared with the Meat group. A probable explanation is that the commercial cooking oil added to equalize the energy content of snacks was fortified with vitamin A by the manufacturer and not labelled initially. Children in all groups showed evidence of vitamin A deficiency at baseline (Table 5). All three feeding groups received some of this fortified oil to equalize the energy content, but greater amounts were added to the Plain Githeri snack (Table 1). The retinol-fortified oil was the most likely reason for the impressive decline in PMO in the Plain Githeri group.
Although seasonality is an important covariate for morbidity, all groups were similarly affected by seasonal trends. Gastroenteritis was most common during rainy seasons. Respiratory diseases were most prevalent in the cold months. More fever and chills were observed during rainy seasons, presumably due to malaria. Even though two of the Meat schools were located close to residual swamps, which are known as breeding sites for Anopheles mosquitoes, the Meat group showed a negative PMO slope for malaria and its accompanying signs and symptoms (Fig. 3).
The consistently higher rates of illnesses in boys compared with girls, particularly for mild illness, have been seen in a number of studies, including our previous Embu study(Reference Neumann and Bwibo61). Higher prevalence of mild illness was observed in school-aged boys than girls of the same age; however, girls were more likely than boys to have more severe illnesses(Reference Neumann, Bwibo and Sigman62). This may reflect the greater time boys spent out in the community. Girls spent more time at home. For severe illnesses, boys may be favoured and preferentially taken to a health facility or health-care provider for treatment compared with girls.
Strengths of the present study include its cluster randomized longitudinal design with repeated measures conducted in the two cohorts; strict quality control, training and supervision of local enumerators; and excellent rapport with the community and field staff. Weaknesses of the study include the small number of schools per group as schools had to be accessible by road and have a certain number of children. Study participants were not blinded to the group feeding assignment, but they were blinded to study hypotheses, as were teachers and field staff.
This is the first cluster randomized, controlled feeding intervention study to analyse the contribution of the addition of ASF, particularly meat, on morbidity outcomes in addition to the previously demonstrated cognitive, behavioural and body composition improvements(Reference Neumann, Bwibo and Murphy47, Reference Neumann, Murphy and Gewa63). An unexpected and important outcome was the positive impact of the addition of a considerable amount of retinol to the Plain Githeri snacks, which demonstrated the value of such fortification in reducing morbidity. These findings are relevant to school-aged children in economically disadvantaged countries where little or no school feeding occurs. School-aged children in these areas tend to be relatively neglected by public health efforts compared with the <5-year-old age group. School feeding is far from universal in such areas, and many children do not regularly attend school. Fortification of fats would be a reasonable approach to reduce morbidity in children, plus adding a wide variety of local ASF. Raising small animals and access to affordable fortified foods in local markets may also help to reduce child morbidity.
Acknowledgements
Sources of funding: This study was supported by the Global Livestock Collaborative Research Support Program (GL-CRSP), US Agency for International Development (DAN-1328-G-00-0046-00), with partial funding from the African Study Center (UCLA) and the National Cattleman's Beef Association (PCE-G-98-00036-00). Conflicts of interest: None. Authors’ contributions: C.G.N. was the Principal Investigator, was responsible for the study design, oversaw overall research activities, and helped guide the statistical analysis and writing of the manuscript. N.O.B. was the Kenyan Principal Investigator and directed the overall research activities in the field, particularly morbidity data collection. R.E.W. designed the statistical analysis and edited the manuscript. L.J. performed the statistical analysis and participated in the writing of the manuscript. Acknowledgements: The authors thank Suzanne Murphy and Connie Gewa for food intake data and analysis; Dr Don Guthrie, Emeritus Professor of Biostatistics at UCLA, for his involvement in the initial statistical design of the study; Natalie Drorbaugh and Maria Pia Chaparro for literature review, drafting and editing of the manuscript; and Jonathan Siekmann, Erin Reid McLean and Lindsay Allen for carrying out laboratory analyses. Most importantly, they wish to acknowledge the field staff (enumerators) and the excellent cooperation of the schools, children and families who participated in the study.


