


The worldwide obesity epidemic is evident in children belonging to economically developed countries, as well as in children belonging to countries undergoing such development. According to the International Obesity Taskforce, approximately 10 % of youth aged 5–17 years worldwide were overweight (OW) and 2–3 % were obese (OB) in the year 2000(Reference Lobstein, Baur and Uauy1). In a nationwide sample of adolescent secondary-school students in Botswana, 16 % of adolescents were OW/OB, with three OW/OB adolescents for every underweight one(Reference Wrotniak, Malete and Compher2). In this sample, OW/OB prevalence was higher among adolescents having a higher socio-economic status (SES) and among those from cities than among those from rural villages. These data suggest that initial efforts to prevent further increase in the prevalence of OW/OB must consider environmental and behavioural factors associated with increasing SES and urbanization as economic development continues.
The typical food intake patterns of adolescents in Botswana and whether these patterns have any relationship with OW/OB have not been published. In addition, the role that SES or urbanization plays in patterns of food consumption has not been examined in adolescents. It is critical to understand these behaviours as a first step towards designing interventions to prevent the expected further increases in OW/OB. Therefore, the purposes of the present study were:
1. to characterize the patterns of food intake of adolescent schoolchildren and the relationship of these patterns with OW/OB;
2. to evaluate the association of SES and location of residence (to reflect urbanization) with food patterns.
On the basis of studies from economically developed countries, we hypothesized that food patterns of breakfast skipping(Reference Rampersaud, Pereira and Girard3–Reference Cho, Dietrich and Brown8), limited meal frequency(Reference Koletzko and Toschke9), eating meals outside the home, excess snack foods(Reference Delisle10, Reference Kontogianni, Farmaki and Vidra11) and limited traditional food items(Reference Delisle10) would be associated with OW/OB. On the basis of data from economically developing countries(Reference Addo, Smeeth and Leon12–Reference Wright24), we hypothesized that children from a higher socio-economic background and from urbanized areas would be particularly affected(Reference Addo, Smeeth and Leon12–Reference Salazar-Martinez, Allen and Fernandez-Ortega15).
Methods
Study design
The protocol was approved by the Institutional Review Board (IRB) of the University of Pennsylvania and by the Botswana Ministry of Education (MOE). Parental consent and student assent were obtained from all participants before data collection using IRB- and MOE-approved consent forms in either English or Setswana as needed.
The present cross-sectional survey used a two-stage stratified sampling design to ensure nationwide data with adequate representation of student subgroups from sparsely populated educational regions and with adequate heterogeneity of urbanization levels among study sites. The first stage was structured on the basis of census districts, based on the most recent Botswana educational statistics(25), and the second was structured on the basis of secondary schools within districts, with approximately fifty students enrolled per school.
In Botswana, localities are defined largely on the basis of their levels of urbanization and population(26). Cities have the highest economic and physical infrastructural development and population density (80 000–200 000). Towns have planned infrastructure similar to that of cities, but much lower population (15 000–50 000). Urban villages have less-modern infrastructure compared with towns or cities; they maintain traditional physical elements and population ranges from 40 000 to 50 000. Rural villages maintain even more traditional physical elements compared with urban villages, with a population of <5000. From the possible 274 eligible secondary schools, seventeen secondary schools were randomly selected on the basis of the following criteria: fourteen urban schools (from seven cities, four towns and three urban villages) v. three rural schools (from rural villages) and twelve public-school v. five private-school settings (Table 1). No private schools exist in rural villages in Botswana. Within each school selected, a convenience sample of approximately fifty students was enrolled.
Table 1 Number of secondary schools by location and type of school
Sample size
The sample size was calculated using the population survey approach in STATCALC (EpiInfo, 2002; Centers for Disease Control and Prevention, Atlanta, GA, USA). Because the actual prevalence of OW/OB was unknown, prevalence was set at the worst case for a power of 50 %. Using a precision of 5 % and a 99 % confidence level, the calculated sample size was 661. Taking into account a non-response rate of 10 %, the target recruitment consisted of 728 adolescents.
Demographic variables
Two trained research assistants conducted all data collection sessions in school classrooms after standardization of measurement techniques during a pilot study. Participants self-completed a demographic survey including age, gender and school level. SES was evaluated on the basis of whether children attended tuition-free public or tuition-requiring private school(Reference Bermudez, Toher and Montenegro-Bethancourt27) and on the basis of a variable comprising household assets including television, refrigerator, electricity, water and toilet within the home, with low SES defined as 0–2 assets and high SES defined as 3–5(Reference Addo, Smeeth and Leon12, Reference Deleuze Ntandou Bouzitou, Fayomi and Delisle13, Reference Buttenheim, Wong and Goldman17, Reference Reddy, Resnicow and James19–Reference Sibai, Nasreddine and Mokdad21, Reference Clausen, Charlton and Holmboe-Ottesen28).
Anthropometric measurements
A single portable precision electronic scale (Tanita, Tokyo, Japan) and stadiometer (Seca, Hamburg, Germany), calibrated and maintained according to manufacturers’ guidelines, were transported to the sites. Anthropometric measures were taken in a semi-private section of the classroom or cafeteria by two trained enumerators. The enumerators had formulated a standardized technique during a pilot study with adolescents in one school. Body weight was measured to the nearest 0·1 kg in light clothing, and height was measured without shoes. Both height and weight were measured in triplicate and BMI was calculated as weight in kilograms divided by the square of height in metres (kg/m2). BMI was evaluated using the WHO reference data for age and gender, using Anthro Plus software to determine Z-scores (WHO, 2009). The WHO categories of thin (interpreted here as underweight; Z-score <−2), optimal BMI (Z-score = −2 to +1), OW (Z-score = +1 to +2) and OB (Z-score ≥+2) were used. Because of a scale malfunction at one site, BMI measures were available for only 667 students.
Food patterns
After undergoing training conducted by the research assistants, participants self-recorded their recall of food intake for the previous day using a survey form with columns for the following information: meal time; food items served; location of food consumption; and method of preparation (raw, baked, boiled or fried). Dietary recall records were reviewed by the research assistant along with the student. Eating breakfast was defined as a child having a meal before 07.00 hours, because some children may have left for school by this time. Meal frequency was defined as the total number of independent occasions during the day when a child consumed food or drink(Reference Kontogianni, Farmaki and Vidra11).
Fruits were considered as pieces of fresh fruit or fruit salad. Fruit juices, because there was no information about the actual content of fruit juice in them, were analysed separately. Vegetables included cabbage, coleslaw, pumpkin, boiled potatoes and spinach. A traditional Botswana diet was measured by the number of times students reported eating any one of the following food items: maize meal, sorghum porridge, samp (chopped corn), samp with beans, seswaa (beef), phane (caterpillar), spinach or pumpkin(Reference Maruapula and Chapman-Novakofski29–Reference Clausen, Charlton and Gobotswana32). A healthy diet was defined as students taking complex carbohydrates, protein foods that were not fried, vegetables, fruit and/or milk, with the total number of servings analysed as a continuous variable. Snack foods were described on the basis of their high fat and sugar content, with the number of servings as continuous variables. Savoury snacks included fried meat/cheese pies, fat cakes, French fries and potato chips. Sweet snacks were cake, ice cream, pudding, cookies and candy. Fizzy beverages were described separately.
Students were also asked to report the frequency with which they ate meals outside the home. Their responses to the frequency with which they ate out in restaurants, fast-food shops or from street vendors were then coded into students who ate out versus those who did not.
All available food records from the sample of 746 students were used for this current evaluation. Forty-two students had randomly missing food recalls, leaving 704 evaluable food records. In addition, because of a scale malfunction at one site, BMI measures were available for only 667 students.
Data analysis
Continuous variables are presented as mean and 95 % CI and categorical variables as frequencies and percentages. Differences in categorical variables by BMI, SES and residence groups were determined using the χ 2 test. ANOVA was used to compare the means of continuous variables (number and servings of food and food patterns) across the three BMI groups, as well as across four types of residences and SES variables, using the post hoc Scheffé test. Logistic regression was used to evaluate food patterns for prediction of BMI group. Statistical analyses were performed using the Statistical Package for the Social Sciences statistical software package version 18·0 (SPSS Inc., Chicago, IL, USA), with a statistically significant value of P < 0·05.
Results
The sociodemographic features of the 704 students with food records included a mean age of 14·9 (sd 1·36) years, with 272 boys (38·6 %) and 432 girls (61·4 %). In terms of SES, 492 (69·9 %) attended public and 212 (30·1 %) attended private schools, whereas 204 (29 %) had a limited number (two or fewer) and 480 (68·2 %) had a greater number (three to five) of household assets. In terms of residence, 224 (31·8 %) lived in cities, 150 (21·3 %) in towns, 182 (25·9 %) lived in urban villages and 148 (21·3 %) in rural villages.
Consumption of fresh fruit and vegetables was reported less frequently. Fresh fruits were not eaten by 84 % of children; one serving was reported by 12 %, two servings by 3 % and three servings by <1 % of students. Among those children who consumed fruit, apples were consumed by fifty-eight (51·0 %), oranges by thirty-six (31·8 %), bananas by twenty (17·7 %), naartjie (a citrus fruit) by seven (6·2 %) and fruit salad by seven (6·2 %). Vegetables were not eaten by 64 % of students. Of those who did consume vegetables, 81 % had one serving, 17 % had two servings and <1 % had three servings. Among those who consumed vegetables, cabbage was consumed by eighty-eight (34·7 %), coleslaw by sixty-six (26 %), spinach by sixty-two (24·5 %), salad by thirty-three (13 %), boiled potatoes by thirty-two (13 %) and pumpkin by twenty-one (8 %).
Food intake patterns and eating styles according to BMI category are reported in Table 2. Although many food items were not significantly different across BMI categories, children who were OW/OB ate more vegetables compared with those with optimal BMI (0·68 v. 0·37 servings, P = 0·012); they also consumed more savoury snacks (0·77 v. 0·55, P < 0·001) compared with underweight children. Although the traditional and healthy diet styles were not significantly different by BMI group, servings of snack foods were higher among OW/OB children than among underweight ones (1·55 v. 0·83 servings, P < 0·01).
Table 2 Food intake pattern and diet style of adolescent school students in Botswana, by BMI group

*Data are presented as n and %.
a,b,c,dMean values within a row with unlike superscript letters were significantly different at P < 0·05. Sample size for the BMI groups is 667.
Food patterns according to SES variables are reported in Table 3. Private-school students of higher SES reported that they ate out more often (97·7 % v. 78·0 %), ate more servings of fresh fruit (0·34 v. 0·13), savoury snacks (1·00 v. 0·41), sweet snacks (0·71 v. 0·40) and fizzy drinks (0·42 v. 0·11) and enjoyed greater snack-food servings (2·14 v. 0·92), all with P < 0·01, compared with public-school students of lower SES. Private-school students also reported fewer servings of milk (0·54 v. 0·77) and a traditional diet (0·39 v. 1·56) compared with public-school students (P < 0·01). When SES was defined on the basis of household assets, higher SES students were observed to eat out more often (89·6 % v. 71·7 %), eat more servings of fresh fruit (0·24 v. 0·10), fruit juice (1·31 v. 1·07), vegetables (0·47 v. 0·34), savoury snacks (0·69 v. 0·37), sweet snacks (0·57 v. 0·32) and fizzy drinks (0·27 v. 0·07) and enjoyed greater snack-food servings (1·55 v. 0·76), all with P < 0·01, compared with children with lower household assets. The children with higher assets skipped breakfast less often (23·2 % v. 32·7 %), drank less milk (0·63 v. 0·86 servings) and ate fewer servings of traditional foods (0·99 v. 1·68, P < 0·001) compared with children with lower household assets.
Table 3 Food intake patterns by socio-economic status
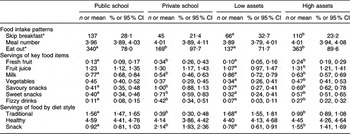
*Data are presented as n and %.
a,bMean values within a row with unlike superscript letters for public school v. private school and low assets v. high assets were significantly different at P < 0·05.
In the analysis of food patterns according to location of residence (Table 4), students living in cities reported eating out more often compared with those in towns (P = 0·02), urban villages (P = 0·004) and rural villages (P < 0·001). Fruits were eaten more often by adolescents in towns than by those residing in urban and rural villages (P < 0·001), but fruit juice servings did not vary significantly. Consumption of milk was reported more often in rural villages than in other locations (all P < 0·01). Servings of vegetables were reported significantly more often by students from cities than by those from towns and rural villages (both P < 0·001). Servings of savoury snacks were reported less often by children from rural villages than by those from other locations (all P < 0·05), but sweet snack servings did not vary by location of residence. Fizzy drinks were consumed more often in cities and towns than in villages (P < 0·05). Servings of traditional diet were reported less often by adolescents from cities than by those from other locations (P < 0·001), and servings of snacks were greater among students from cities than among those from rural villages (P < 0·01); however, healthy diet servings did not vary significantly by location of residence.
Table 4 Food intake patterns by location of residence
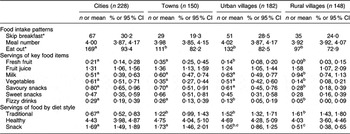
*Data are presented as n and %.
a,b,cMean values within a row with unlike superscript letters were significantly different at P < 0·05.
Logistic regression models predicting BMI group by food-style group are presented in Table 5. Only the snack-food diet was associated with increased risk of OW/OB, with OR 1·16 (95 % CI 1·02, 1·33; P = 0·028). This relationship was no longer statistically significant when controlled for school type as a measure of SES.
Table 5 Logistic regression model predicting risk of BMI on the basis of diet style

Discussion
The present analysis of the reported food intake behaviours of adolescents in Botswana secondary schools suggests that OW and OB children, especially those of higher SES and from more urban environments, have food patterns that are of concern with regard to their health. These children follow a snack-food pattern that has greater risk of OW/OB and combines eating out with more servings of high-energy snack foods and fewer servings of traditional foods.
SES is strongly linked to OW/OB among adolescents in Botswana. Students belonging to higher SES (private schools, higher assets) had significantly higher prevalence of OW/OB compared with those from public schools and with lower assets(Reference Wrotniak, Malete and Compher2). This pattern is similar to that observed in adolescents in Mexico(Reference Ullmann, Buttenheim and Goldman14, Reference Salazar-Martinez, Allen and Fernandez-Ortega15), India(Reference Goyal, Shah and Saboo16) and South Africa(Reference Kruger, Kruger and MacIntyre18, Reference Reddy, Resnicow and James19). In the USA, however, obesity among adolescents is more common in lower SES environments(Reference Grow, Cook and Arterburn33, Reference Voorhees, Catellier and Ashwood34). Further, these patterns of OW/OB are also concurrent with eating meals outside the home, with more servings of high-energy-density snack foods and fewer servings of traditional foods, an eating pattern that can certainly lead to OW/OB. Socio-economic factors, however, are challenging to separate from economic developmental effects, particularly in countries undergoing rapid economic development.
Nutritional transition has been described in five characteristic phases, which can be traced through Botswana's food pattern history(Reference Popkin35). The first phase is typically a hunter–gatherer society that prevailed in Botswana from approximately 17 000 BC to 1650 BC, during a late stone-age culture(Reference Parsons36). The second nutrition transitional phase is typified by modern agriculture, a shift that occurred with Botswana's shift to pastoralism centuries ago(Reference Parsons36). Cattle farming became a major economic driver, which continues to supply milk and lean beef for the population today. The receding famine phase of the nutritional transition is evidenced by the 3:1 ratio of OW/OB to underweight among adolescents in these data, and also by reports of adult OW/OB of 16 % in men and 38 % in women, concurrent with 19 % and 12 % of underweight(Reference Letamo37). The final phase of the nutritional transition, titled behavioural change(Reference Popkin35), in which intentional eating and physical activity behaviours may enable successful ageing even in the setting of high rates of chronic diseases, is yet to come in Botswana. The current description of food patterns in adolescents, however, may help to inform improved health behaviours.
In urban regions of Botswana, as economic development has already occurred, the energy cost of preparing meals has reduced relative to earlier times. At the time of Botswana's independence in 1966, most families were required to fetch water from some distance, gather firewood and fruits from the bush and crack maize or pound sorghum in order to prepare family meals. The energy cost of preparing meals was quite high, whereas energy intake was limited. At present, in urban areas, many food items are purchased as ready-to-prepare or ready-to-consume packs from stores, and family residences have running water and cooking stoves that do not require firewood. Individuals living in cities commonly use motorized transportation, rather than walking from place to place. Further, cities in Botswana have employment opportunities in thriving academic centres, in government, medical and social services and at other sites that require limited energy expenditure to accomplish the day's productivity(Reference Maruapula and Chapman-Novakofski29–Reference Maruapula and Chapman-Novakofski31). The overall energy balance equation may have shifted in such a way that the dominant nutritional challenge at present is not to maintain sufficient body weight but to prevent excess weight gain as patterns of infrastructural development and affluence have changed.
The associations of greater intake of key high-energy food items in more economically and infrastructurally developed parts of the country may imply greater access to these foods compared with less-developed areas. In the current data, adolescents from cities reported drinking milk less often and fizzy drinks more often compared with children from rural villages. In addition, servings of traditional Botswana foods were significantly higher in rural villages, whereas savoury snacks were eaten more often in cities. This overall pattern suggests the possibility that students in more economically developed parts of Botswana (cities) are substituting less healthy foods (fizzy drinks, savoury snacks) for more nutritious, historically traditional options (milk, traditional diet). As cities also have greater prevalence of OW/OB, these combined findings suggest that access to unhealthy foods may be problematic, especially in more developed areas. The adoption of more Western diet choices rather than healthier traditional diet choices has also been described in population groups of African origin living in Canada, Spain and West Africa, who are undergoing nutritional transition(Reference Delisle10). The authors suggest encouragement of culturally relevant, healthier traditional diet patterns as a health promotion stance.
Consumption of low-energy-density fruit and vegetables was not reported commonly in this sample. Most students reported eating ‘no’ vegetables (64 %) or fresh fruit (84 %), and multiple servings of either food group were rare. A meal pattern of adequate intake of starch, but limited fruit and vegetables, was also reported in older adults in Botswana(Reference Maruapula and Chapman-Novakofski29–Reference Clausen, Charlton and Gobotswana32). Since fruit and vegetables contain water, their energy density is relatively low and nutrient density is relatively high, and enhancing the intake of these foods is an accepted strategy to reduce overall energy intake(Reference Rolls38). Health messages that focus on the nutritional value of fresh fruit might be helpful in the prevention of obesity, especially if servings of fruit displace higher-energy-density snack foods. Even though vegetables were not eaten by most children, servings of vegetables were higher in adolescents with OW/OB and in those living in cities. It was reported that vegetables were prepared by not frying; however, traditional preparation methods include adding fat as seasoning. A paradoxical association of vegetables with higher prevalence of OW/OB in this data set might have occurred had the vegetables been prepared with added fat and/or had not displaced but had been additive to higher-energy-density snack foods. However, the servings of vegetables reported by adolescents were too limited to meet nutrient requirements, and therefore should be increased.
Some of the food patterns identified as being related to obesity in other cultures may be less important among adolescents in Botswana. Breakfast skipping has increased in US adults from 14 % in 1965 to 25 % in 1991, concurrently with rapid increases in obesity prevalence(Reference Rampersaud, Pereira and Girard3). Breakfast is skipped by 20 % of Tunisian adolescents(Reference Blouza-Chabchoub, Rached-Amrouche and Jamoussi4), 30 % of European and US adolescents(Reference Williams, O'Neil and Deast5–Reference Timlin, Pereira and Story7) and by 20 % of US adults(Reference Cho, Dietrich and Brown8). In US adolescents, eating breakfast was associated with a significantly lower BMI Z-score(Reference Timlin, Pereira and Story7). However, in these adolescents in Botswana the rate of breakfast skipping was 26 % and not related to OW/OB status. Breakfast skipping may be less important in Botswana because public schools provide a mid-morning tea for students, potentially replacing the missed early meal.
Greater meal frequency has been reported as being protective against OW/OB. Adolescents in Germany who consumed five or more meals per day had reduced odds of both OW (0·61) and OB (0·58) relative to those with three or fewer meals per day(Reference Koletzko and Toschke9). Adolescents in Greece reported a mean of four meals per day(Reference Kontogianni, Farmaki and Vidra11), although this pattern was statistically significant only when combined with a pattern that included breakfast consumption and greater intake of Mediterranean diet foods. Adolescents in Botswana reported a mean daily meal frequency of approximately four meals, but this pattern was not associated with adolescent BMI categories, SES or with location of residence.
The present study should be viewed in the light of its strengths and limitations. The sample's representation of urbanization and SES strata and the large sample size are important strengths that make the data especially useful for planning interventions. More girls than boys agreed to participate, likely because of the larger percentage of girls in Botswana schools, as found in the most recent data from 2006(25). However, data from more than 270 boys do not comprise a small sample. The fact that students were required to report only the previous day's food intake limits the risk of recall bias that would increase with greater time lapse since the consumption of food. Students completed the 24 h recalls after undergoing training conducted by the research assistant. However, there was limited direct supervision; hence, information on food items or preparation methods may be incomplete. Reporting only a single day's intake limits the ability to describe the variation in typical food intake between weekdays and weekends that was shown by others using 3 d dietary recalls or an FFQ (see http://riskfactor.cancer.gov/tools/children/review/pdf/ncs_chapter1.pdf). Although inaccurate portion size is less problematic in descriptions of food patterns than in those of nutrient intake, any important variation in portion size across BMI groups or residence locations is not evaluable. To assess the acceptability of reduced portion sizes for future interventions, it would be helpful to know whether fried meat pies or fat cakes that are sold commercially in cities are larger in size compared with those prepared by mothers in village homes. Since students did not report any servings of traditional wild fruits, we do not know whether encouragement of these choices would be acceptable or a sustainable option. Students reported that the vegetables served to them were generally prepared by boiling, but they were not asked to report any fat added in vegetable preparation. The current study was strengthened by the use of two SES variables that confirmed the same links with OW/OB. Most rural villages in Botswana do not have private schools, and in some towns private-school tuition may be paid by the parent's employer because the parent has limited income. Across all types of residence, assets vary as a function of disposable income.
In conclusion, at present, the prevalence of OW/OB among adolescents in Botswana is much higher than the prevalence of underweight, and students having higher SES who live in cities are especially at risk for obesity. Increases in OW/OB are likely to increase with expected improvements in socio-economic and infrastructural development over the next few years throughout more rural areas. Nutritional transition is clearly underway in Botswana, a country that could model an effective public health approach to obesity prevention for other economically developing African countries. These current data suggest that one approach towards obesity prevention in adolescents might focus on enhancing intake of fruits while limiting access to or portion sizes of snack foods. The most strategic long-term plan, however, will also include encouragement of traditional foods, including milk, as urbanization moves into more rural areas. Qualitative assessment of adolescents’ food choices and views on obesity and health may help in framing interventional components and educational messages.
Acknowledgements
The project was supported by the University of Pennsylvania and University of Botswana Research Funds. The authors have no conflict of interest to declare. C.C., J.C.J. and S.D.M. helped to obtain funding for the study; C.C., S.D.M., L.M., S.S., J.C.J., N.S., B.W. and S.J.R. contributed to the design and implementation of the study; C.C., S.J.R. and S.D.M. contributed to data analysis and interpretation. All authors contributed to writing and editing of the manuscript. The authors appreciate the assistance of Ms Anastacia Makwa and Mrs Duduetsang Semele.


