


Vitamins with antioxidant properties may be protective against CVD and cancer(Reference Witztum1–Reference Hennekens, Gaziano, Manson and Buring3). Antioxidants can reduce the oxidative modification of LDL to affect blood cholesterol levels(Reference Witztum1) and to prevent oxidative damage to cells, thereby reducing the risk of cancer(Reference Edes and Gysbers4–Reference Yoshikawa and Kokura8).
Higher serum levels of carotenoids such as α- and β-carotene have been associated with lower mortality from lung(Reference Ito, Wakai and Suzuki9, Reference Ito, Wakai and Suzuki10) and colorectal cancers(Reference Wakai, Suzuki and Ito11) among Japanese men. Vitamin C was reported to lower blood pressure levels(Reference Trout12) and was inversely associated with the incidence(Reference Yokoyama, Date, Kokubo, Yoshiike, Matsumura and Tanaka13) of and mortality(Reference Gale, Martyn, Winter and Cooper14) from stroke.
Intake of another major antioxidant vitamin, vitamin E, has been associated with reduced risks of CHD and stroke when used in high doses(Reference Stampfer and Rimm15–Reference Gaziano18), although vitamin E supplementation had no effect on mortality from CVD and all causes in clinical trials(Reference Miller, Pastor-Barriuso, Dalal, Riemersma, Appel and Guallar19, Reference Lee, Cook, Gaziano, Gordon, Ridker, Manson, Hennekens and Buring20). A clinical trial of approximately 30 000 Chinese adults demonstrated that a diet supplemented with β-carotene, vitamin E and Se reduced the risk of cancer by 13 %(Reference Blot, Li and Taylor21). These findings suggest potential benefits of antioxidant vitamins for the prevention of CVD and cancer.
In 2000, the Ministry of Science and Education revised the Japanese standard food composition table for the first time in 18 years, to reflect the increasing diversification of Japanese dietary habits. Vitamins A, C and E were included in the new table, so that trends for the intake of these vitamins could be evaluated using the existing database of dietary surveys.
In the present study, we investigated long-term trends in dietary intakes of vitamins A, C and E, according to population-based surveys in two Japanese communities between 1974 and 2001.
Methods
The subjects in the present study comprised men and women aged from 40 to 69 years, living in Ikawa town, Akita Prefecture, and Kyowa town (presently a district of Chikusei city), Ibaraki Prefecture. Ikawa is located near the Sea of Japan in the north, where nearly half of the town is forest and rice-crop agriculture is the main industry. Kyowa is on a plain area in the mid-eastern region of Japan; this area is predominantly horticultural with a mix of rice-crop agriculture and light industry.
The nutrition surveys were conducted by 24 h dietary recall in approximately 10 % of the participants in the annual cardiovascular risk surveys. Subjects aged over 70 years were excluded from the nutrition survey because the accuracy of recall-based data may decline with ageing. The participants in the cardiovascular risk surveys were recruited for the nutrition surveys, but were not pre-informed of the recruitment.
The surveys were conducted from 1974 to 2000 for Ikawa and from 1982 to 2001 for Kyowa. The survey data were collected during autumn in Kyowa and during spring in Ikawa. The nutrition survey term was stratified into seven time periods for Ikawa: 1974–1977, 1978–1981, 1982–1985, 1986–1989, 1990–1993, 1994–1997 and 1998–2000; and into four periods for Kyowa: 1982–1986, 1990–1993, 1994–1997 and 1998–2001. If a participant undertook the nutrition survey more than once during one survey period, we used the data from the earliest year in each survey period. The numbers of subjects by sex and time period in Ikawa and Kyowa are presented in Table 1.
Table 1 Trends for sex-specific age-adjusted mean dietary intakes of vitamins A, C and E in men and women aged 40–69 years in Ikawa and Kyowa, Japan

RE, retinol equivalents.
Intake of green tea was not taken into account; intakes of nutrients were evaluated in conditions before cooking.
Mean values were significantly different from those of the first survey: *P < 0·05, **P < 0·01, ***P < 0·001.
The 24 h dietary recall method involves trained dietitians interviewing the study subjects on what they had eaten during the 24 h prior to examination. The same dietitians were used over the survey periods where possible to avoid fluctuations in interviewing technique over time. New dietitians were carefully trained before interviewing for the survey. In the interviews, actualized food models, pictures of food materials and dishes, and/or real foods and dishes were shown to the participants to enable easy recall of their food intake. The same basic food models and interview forms were used throughout the surveys. Intake of green tea was included in the surveys from 1994. Rice and miso soup quantities were estimated by asking the subjects to put the usual amount of their intake into a bowl and this was then measured. We also investigated the intake frequencies of sixteen major foods and food groups per week to confirm that the foods included in the 24 h dietary recall were representative of the subject’s usual diet. Survey periods encompassing special events such as a festival or celebration were excluded from the surveys. The interview took approximately 30 min per subject. We did not ask about the use of vitamin supplements because supplement use has been uncommon during the survey periods.
Nutrient intakes were estimated based on fifth revised edition of the Standard Tables of Food Composition in Japan (22). The data were originally coded based on the fourth edition of the food composition tables between 1974 and 1999, and on the fifth edition between 2000 and 2001. Foods appearing for the first time in the fifth and fifth revised editions were rarely eaten by our study participants. The data on vitamins were total vitamin A (μg retinol equivalents (RE)/d), β-carotene (μg/d), vitamin C (mg/d) and α-tocopherol (μg/d) as vitamin E. It is possible that the amounts of vitamins A, C and E contained in the same foods may have changed from the 1970s to the present, but we have no data to support this possibility. Therefore, we used the data in the fifth edition throughout the surveys.
The food composition tables provide nutritional data after cooking only for selected foods. Thus, we evaluated all data in the pre-cooked state to investigate long-term trends, although this may have introduced a systematic overestimation of nutrient intakes.
For primary trend analyses, we did not include dietary intake of green tea because this intake was not surveyed prior to 1994. However, for the secondary analyses, we included vitamins A, C and E from green tea in the latest survey period, to estimate the true proportions of these nutrients in the total intakes. Persons who reported upper and lower 1 % of these vitamins were excluded from the analyses (n 528).
Sex-specific age-adjusted mean values and standard errors of vitamin A, C and E intakes were calculated by analysis of covariance for each survey period as described above. We also evaluated intakes of these vitamins by major food group. Differences in mean values from the earliest survey period were determined using Dunnett’s multiple comparison method. The SAS statistical software package version 9·13 (SAS Institute Inc., Cary, NC, USA) was used for statistical analysis. P values less than 0·05 were regarded as statistically significant throughout the surveys.
Results
The number of survey participants in each survey period was between 176 and 370 for men and between 132 and 325 for women in Ikawa, while the respective number in Kyowa was between 355 and 627 and between 433 and 572 (Table 1).
Age-adjusted mean (se) BMI (kg/m2) in the latest survey period (1998–2000 in Ikawa, 1998–2001 in Kyowa) was 23·9 (0·2) among men and 24·3 (0·2) among women in Ikawa, and 23·7 (0·1) among men and 23·5 (0·2) among women in Kyowa. The proportion of subjects who drank more than one alcoholic drink per week was 86 % among men and 9 % among women in Ikawa, and 74 % among men and 11 % among women in Kyowa.
Table 1 shows trends for sex-specific age-adjusted mean dietary intakes of vitamins A, C and E in the two communities. Mean intake of total vitamin A increased by 13 % among men and 40 % among women; β-carotene increased by 2 % among men and 31 % among women; and retinol increased by 56 % among men and 105 % among women from 1974–1977 to 1998–2000 in Ikawa. Among men and women in Kyowa, mean intake of total vitamin A increased by 13 % for men and 21 % for women; retinol increased by 16 % for men and 29 % for women, but β-carotene did not change between 1982–1986 and 1998–2001.
Mean intake of vitamin C increased by 23 % among men and 29 % among women from 1974–1977 to 1978–1981, and plateaued thereafter in Ikawa. In Kyowa, it decreased by 16 % among men, but did not change among women from 1982–1986 to 1990–1993.
Mean intake of vitamin E increased by 34 % among men and 33 % among women from 1974–1977 to 1982–1985, and plateaued thereafter in Ikawa. In Kyowa, mean intake of vitamin E did not change among men, but increased by 8 % among women from 1982–1986 to 1998–2001.
Table 2 shows trends for sex-specific age-adjusted mean dietary intakes of vitamins A, C and E by food group in the two communities. Mean intake of β-carotene from green/yellow vegetables, a primary food source, increased among men from 1974–1977 to 1982–1985, and plateaued thereafter in Ikawa, whereas that from fruits and algae decreased among men and women from 1974–1977 to 1998–2000 in Ikawa. In Kyowa, mean intake of β-carotene from fruits decreased among men, but did not change substantially among women from 1982–1986 to 1990–1993.
Table 2 Trends for sex-specific age-adjusted mean dietary intakes of β-carotene, retinol, vitamin C and vitamin E by food group in men and women aged 40–69 years in Ikawa and Kyowa, Japan

Intake of green tea was not taken into account; intakes of nutrients were evaluated in conditions before cooking.
Mean values were significantly different from those of the first survey: *P < 0·05, **P < 0·01, ***P < 0·001.
Mean intake of retinol from fish/shellfish increased among men and women from 1974–1977 to 1998–2000 in Ikawa, and did not change substantially among men and women from 1982–1986 to 1990–1993 in Kyowa. Mean intake of retinol from, eggs, milk/dairy products and fats/oils increased among men and women from 1974–1977 to 1998–2000 in Ikawa. In Kyowa, mean intake of retinol from milk/dairy products increased from 1982–1986 to 1990–1993, and then plateaued thereafter.
Mean intake of vitamin C from green/yellow and other vegetables, primary food sources, increased among men and women from 1974–1977 to 1982–1985 and plateaued thereafter in Ikawa, while that from fruits tended to decrease after the 1980s. In Kyowa, mean intake of vitamin C from green/yellow and other vegetables and fruits did not change substantially among men and women from 1982–1986 to 1998–2001.
Mean intake of vitamin E from green/yellow and other vegetables and fats/oils increased among men and women from 1974–1977 to 1982–1985, and plateaued thereafter in Ikawa, while intake from these foods did not change substantially among men and women in Kyowa.
The proportions of β-carotene intake according to food group in the latest survey period (1998–2001 for Ikawa, 1998–2000 for Kyowa) are shown in Fig. 1. The major food sources for β-carotene intake were green/yellow (92–93 %) and other vegetables (1–2 %) and fruits (1–2 %) among men and women in Ikawa, with 68–72 %, 3 % and 20–25 %, respectively, among men and women in Kyowa. The retinol intake comprised 30–41 % from fish/shellfish, 19–22 % from eggs and 19–28 % from milk/dairy products among men and women in Ikawa. The respective proportions in Kyowa were 21–34 %, 24–27 % and 20–24 %.
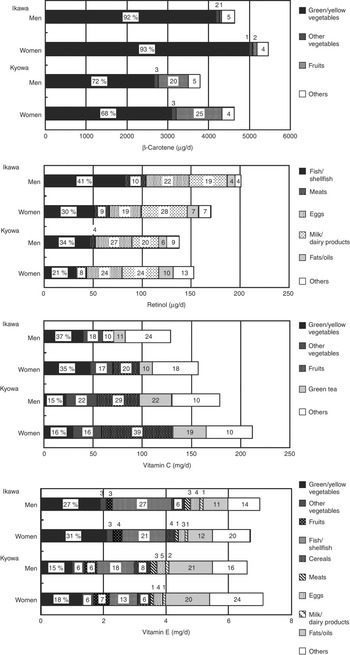
Fig. 1 Sex-specific age-adjusted mean dietary intakes of β-carotene, retinol, vitamin C and vitamin E by food group, in men and women aged 40–69 years in Ikawa and Kyowa, Japan, in the latest survey period (1998–2000 in Ikawa, 1998–2001 in Kyowa). The numbers in bars are the proportions of the vitamin intakes by food group
Vitamin C intake consisted of 35–37 % from green/yellow vegetables, 17–18 % from other vegetables, 10–20 % from fruits and 10–11 % from green tea among men and women in Ikawa. The respective proportions in Kyowa were 15–16 %, 16–22 %, 29–39 % and 19–22 %.
The vitamin E intake comprised 27–31 % from green/yellow vegetables, 3 % from other vegetables, 21–27 % from fish/shellfish and 11–12 % from fats/oils among men and women in Ikawa. The respective proportions in Kyowa were 15–18 %, 6 %, 13–18 % and 20–21 %.
Discussion
The present study of long-term nutritional trends in Japan revealed that both men and women in Ikawa had increased dietary intakes of β-carotene and vitamin C, primarily from green/yellow and other vegetables; increased intake of retinol from fish/shellfish, eggs, milk/dairy products and fats/oils; and increased intake of vitamin E from green/yellow and other vegetables, milk/dairy products and fats/oils between the 1970s and the 1990s. In Kyowa, mean intake of retinol from fish/shellfish and milk/dairy products increased among men and women; while mean intake of vitamin C from fruits decreased among men between the 1980s and the 1990s.
Ikawa comprises areas of plains and mountains where people have traditionally worked mainly on rice farms. New factories for heavy industry were founded in the late 1970s and many farmers changed to work in these factories. According to local government statistics, 67 % of the population worked on farms and 12 % in factories in 1975, but this had changed to 41 % and 42 %, respectively, by 1980. Consequently, the mean income of people in this community increased from the 1970s to the 1980s, which improved eating habits in terms of nutrition. In contrast, Kyowa is located on the plains where a large percentage of people worked on fruit and vegetable farms or for light-industry companies; there have been no substantial changes in industry since the 1980s.
Mean intakes of vitamins A, C and E in Ikawa and Kyowa were similar to those of the national samples in Japan. According to the national nutritional survey(23, 24), the daily per capita intake of total vitamin A increased from 1974 (552 μg RE) to 2001 (981 μg RE). The daily per capita intake of vitamin C remained over 100 mg: 120 mg in 1974 and 106 mg in 2001. The daily per capita intake of vitamin E was 8.5 mg in 2001(24).
For ages 30–69 years, the Estimated Average Requirement for total vitamin A is 500–550 μg RE/d for men and 450 μg RE/d for women, and that for vitamin C is 55 mg/d for both sexes. The Adequate Intake of vitamin E is 8–9 mg/d for men and 8 mg/d for women(25). Therefore, mean intakes of vitamins A and C in the present study samples were higher than the Estimated Average Requirement except for slightly lower vitamin A in Kyowa men. Mean intake of vitamin E was lower than the Adequate Intake among men and women in both communities.
Mean daily intakes of vitamins C among Americans according to the National Health and Nutrition Examination Survey (NHANES) in 1999–2000(Reference Ervin, Wright, Wang and Kennedy-Stephenson26) were 107 mg among men aged 40–59 years, 110 mg among men aged ≥60 years, 91 mg among women aged 40–59 years and 99 mg among women aged ≥60 years. The respective intakes of vitamin E were 10.4 mg, 9.2 mg, 9.1 mg and 7.6 mg. Mean intakes of vitamin A could not be compared with the US data because of different methods of calculation. That report and the present findings suggest that the mean intake of vitamin C around 2000 was similar for men and higher for women, and that the mean intake of vitamin E was lower for both sexes of the Japanese samples than for the US samples.
The strength of the present study lay in the 24 h dietary recall method used in the surveys, with a sample large enough to statistically estimate sex-specific long-term trends. However, our study has several limitations. First, we evaluated nutrient intakes only for raw foods because there was no systematic database available to assess nutrient loss by cooking. Since the survival proportion of vitamins C in vegetables following cooking is approximately 50–90 %(22), dietary intake of vitamin C may be overestimated systematically in the present study. Second, we did not have data on vitamin supplements in addition to dietary intake. However, this limitation is unlikely to have a large impact on the prediction of risk trends for CVD because the use of vitamin supplements may be low in these communities as vitamin supplements have been available for purchase in convenience stores only since 2004.
In summary, we investigated long-term trends in dietary intakes of vitamins A, C and E among Japanese middle-aged adults in two rural communities. Increases occurred for vitamins A, C and E between the 1970s and the 1990s except for decreased vitamin C among Kyowa men. The lower mean intake of vitamin E than the Adequate Intake should be considered a potential public health issue for the prevention of CVD.
Acknowledgements
Conflicts of interest: There are no conflicts of interest.
Funding: The study was supported by a Grant-in-Aid for Research B (11470103 in 1999 to 2001) and Research A (14207019 in 2002 to 2005) from the Japan Society for the Promotion of Science.
Author contributions: Y.K. analysed the data and wrote the first draft. H.I. designed the study, chaired the steering committee, managed the study and edited the manuscript. S.I. and K.M. assisted in conducting the analysis design and preparing the manuscript. M.I., M.O., K. Yokota, S.M., T.Y., M. Kishi and M. Kurokawa participated in the field surveys. M.U. and E.M. analysed the data. K. Yamagishi, T.T. and S.S. managed the surveillance, analysed and edited the manuscript. T.S. was a member of the steering committee who monitored and managed the study.


