


In the last few decades, the global food system has changed significantly. Ultra-processed foods, characterized as ready-to-eat foods that are manufactured with substances from industrial processing (chemical additives, colorants, flavourings), are more readily available in the food supplies of high- and middle-income countries( Reference Monteiro, Moubarac and Cannon 1 ). Recent cross-sectional studies using individual-level consumption data have reported that ultra-processed foods contribute 25–60% of total energy intake in the USA( Reference Steele, Baraldi, Louzada and da 2 ), Canada( Reference Moubarac, Batal and Louzada 3 ), Brazil( Reference Louzada, da, Ricardo and Steele 4 ), France( Reference Julia, Martinez and Allès 5 ), Mexico( Reference Marrón-Ponce, Sánchez-Pimienta, Louzada and da 6 ) and Chile( Reference Cediel, Reyes, Louzada and da 7 ). In the USA, these foods account for a strikingly high percentage (90%) of the energy from added sugar( Reference Steele, Baraldi, Louzada and da 2 ).
High consumption of ultra-processed foods raises health concerns. As ultra-processed foods contain little or no whole foods, these foods are nutritionally poor, with high amounts of fat, added sugar and energy, and low amounts of micronutrients and fibre( Reference Steele, Baraldi, Louzada and da 2 , Reference Moubarac, Batal and Louzada 3 , Reference Julia, Martinez and Allès 5 , Reference Martínez Steele, Popkin and Swinburn 8 ). A systematic review reported a direct association between these types of foods, such as sugar-sweetened beverages or sweetened/salted snacks, and body fat in children and adolescents( Reference Costa, Del-Ponte and Assunção 9 ). In addition to low nutritional quality, ultra-processed foods and their packaging contain compounds that can pose health risks( Reference Heindel, Blumberg and Cave 10 – 12 ). Compounds such as acrylamide, polycyclic aromatic hydrocarbons, heterocyclic amines and furans may be present in ultra-processed foods as they can be generated during heating, a commonly used food processing technique( Reference Nerín, Aznar and Carrizo 13 , Reference Birlouez-Aragon, Morales and Fogliano 14 ). Exposure to chemicals such as phthalates and bisphenol A, which are used in food packaging as plasticizers, is also possible( Reference Stahlhut, van Wijngaarden and Dye 15 , Reference Liu, Lehmler and Sun 16 ).
Furthermore, previous studies which classified foods using predefined criteria on degree of processing have shown elevated risk of chronic diseases with high consumption of ultra-processed foods. A longitudinal study of Brazilian children showed that ultra-processed food intake was associated with dyslipidaemia( Reference Rauber, Campagnolo and Hoffman 17 ). In adults, cross-sectional studies have shown an increased odds of obesity with higher consumption of ultra-processed foods( Reference Louzada, da, Baraldi and Steele 18 – Reference Juul, Martinez-Steele and Parekh 20 ). A prospective cohort of university students in Spain reported a dose–response relationship between ultra-processed food consumption and a higher risk of incident obesity and hypertension( Reference Mendonça, de, Pimenta and Gea 21 , Reference Mendonça, de, Lopes and Pimenta 22 ). In addition, a recent population-based study from France found that a 10% increase in ultra-processed foods in the diet was associated with a higher risk of overall cancer and breast cancer( Reference Fiolet, Srour and Sellem 23 ). These studies suggest that there are adverse health outcomes associated with ultra-processed food intake, but all of these studies are limited in that they are either cross-sectional or had a relatively short follow-up period (5–9 years).
To address these gaps, we investigated the association between ultra-processed food intake and all-cause mortality and CVD mortality using data from a nationally representative sample of US adults with over 20 years of follow-up. We focused on CVD mortality given the previously reported associations between ultra-processed foods and CVD risk factors( Reference Mendonça, de, Pimenta and Gea 21 , Reference Mendonça, de, Lopes and Pimenta 22 ). We also aimed to examine sociodemographic and nutritional characteristics according to different levels of ultra-processed food consumption.
Methods
Study population
We conducted prospective analyses on adult participants (aged ≥20 years) from the Third National Health and Nutrition Examination Survey (NHANES III, 1988–1994). NHANES III used a multistage, stratified, clustered, probability sampling design to identify a nationally representative sample of non-institutionalized civilians in the USA( 24 ). Participants completed a household interview, laboratory measurements and physical examinations( 24 ). Details of the survey design have been published previously( 24 ).
In the present study, we included adults with no missing information on ultra-processed food intake and mortality (n 18779). Since dietary intake often changes after diagnosis of a clinical condition, we excluded adults with a chronic disease, such as heart disease (self-reported diagnosis of heart attack, stroke or IHD; n 1728), cancer (self-reported diagnosis of cancer; n 609), diabetes (self-reported diagnosis of diabetes, diabetes medication use or fasting glucose ≥126 mg/dl; n 3701) or chronic kidney disease (estimated glomerular filtration rate (eGFR) <60 ml/min per 1·73 m2; n 843), at baseline. The final sample size was 11898 (see online supplementary material, Supplemental Fig. 1).
Dietary assessment and classification of ultra-processed foods
At baseline, trained interviewers administered an eighty-one-item FFQ, which assessed participants’ usual intakes of foods and beverages consumed in the past month, and a 24 h dietary recall( 24 ). Since portion size was not assessed on the FFQ, we used data from participants’ 24 h dietary recalls to examine intakes of total energy, macronutrients and micronutrients. The NHANES III Nutrition Methodology Working group, which is comprised of a group of experts from academia, government agencies and industry, recommended the use of an FFQ to rank participants by their food intake( 24 ).
We used the NOVA classification to categorize each reported food item on the FFQ into one of the following categories representing levels of processing: (i) fresh or minimally processed foods; (ii) processed culinary ingredients; (iii) processed foods with salt, sugar or oil; or (iv) ultra-processed foods containing predominantly industrial substances and few whole foods (see online supplementary material, Supplemental Table 1)( Reference Moubarac, Batal and Louzada 3 , Reference Monteiro, Cannon and Moubarac 25 , 26 ). The first category represents foods that are obtained directly from plants or animals that have undergone alterations to increase shelf life or storage. These types of alterations can range from removing inedible parts, refrigerating, freezing, vacuum packaging, drying, crushing, grinding, filtering to pasteurizing. The second category represents substances that are extracted from nature or foods from the first category, which may be used in the kitchen as culinary ingredients. The third category represents foods that have undergone simple alterations such as adding oil, sugar, salt or other items from the second category to foods in the first category. These alterations are usually made to improve sensorial qualities or extend the durability of foods in the first category. The fourth category represents foods containing substances that are not typically used in culinary preparation such as hydrogenated oils, hydrolysed protein or emulsifiers, and have few whole foods. Ultra-processed foods contain industrial substances to mimic sensorial qualities of whole foods and create foods that are highly palatable.
The focus of our study was on the fourth level of processing. After food items were classified by NOVA category, we summed the frequency of ultra-processed food intake per day for each participant and then divided the participants into quartiles based on their frequency of consumption per day.
Nutrient analyses
We used three methods to examine the nutritional characteristics of individuals reporting different frequencies of ultra-processed food consumption. For all methods, we used participants’ 24 h dietary recall data. First, we examined nutrient density across quartiles of frequency of ultra-processed food intake. We expressed macronutrients (protein, carbohydrates, total fat, saturated fat, monounsaturated fat, polyunsaturated fat) and added sugars as percentage of energy, and fibre, cholesterol and micronutrients as grams, milligrams or micrograms per 4184 kJ (1000 kcal). All nutrient estimates except for added sugars were assigned by the National Center for Health Statistics using the US Department of Agriculture food composition database( 24 ). To derive estimates on added sugar intake, we used the Pyramid Servings Database developed by the National Cancer Institute. This database provides estimates of added sugars in all food items reported in NHANES III 24h dietary recalls( 27 ).
Second, we used the Nutrient-Rich Foods (NRF) index, a score which ranks the nutritional quality of a food. NRF score has been associated with overall diet quality( Reference Fulgoni, Keast and Drewnowski 28 ) and has been inversely associated with all-cause mortality in a European cohort( Reference Streppel, Sluik and van Yperen 29 ). Details on development, validation and calculation of the score have been published previously( Reference Fulgoni, Keast and Drewnowski 28 , Reference Drewnowski 30 ). Briefly, NRF9.3 is calculated based on nine nutrients to encourage (protein, fibre, vitamins A, C and E, Ca, Fe, Mg and K) and three nutrients to limit (saturated fat, added sugar and Na). A higher NRF9.3 food score indicates higher nutritional quality of a food. We additionally excluded pregnant and lactating women for this analysis (n 267), as micronutrient intakes differ during this period. For each participant, we summed the NRF9.3 food scores, divided by total energy intake, and expressed the NRF9.3 index score per 418 kJ (100 kcal).
Lastly, we used the Healthy Eating Index (HEI)-2000, a 100-point score based on the US Dietary Guidelines for Americans( 31 ), to assess diet quality across quartiles of ultra-processed food intake.
Outcome ascertainment
From baseline through 31 December 2011, participants’ vital status and cause-of-death information were followed by the National Center for Health Statistics. Vital status was determined by probabilistic matching of participants to the National Death Index based on identifying information, including social security number, name, sex and date of birth( 32 ). Thus, only participants with insufficient information on these matching criteria were lost to follow-up. Details of the linkage methods have been reported previously( 32 ). We calculated follow-up time (number of days) as the time from NHANES examination until the date of death or the end of follow-up on 31 December 2011. We defined death due to CVD as those with a primary cause of death listed as I00–I69 in the International Classification of Diseases and Related Health Problems, 10th edition( 33 ).
Covariates
Participants self-reported the following covariates: age (continuous), sex (male or female), race/ethnicity (non-Hispanic White; non-Hispanic Black; Mexican American; other), total energy intake (continuous), education level (less than high school; high school; more than high school), income (poverty-income ratio: <130%; 130–<350%; ≥350%), health behaviours including smoking (current smoker; former smoker; never smoker), alcohol consumption (quartiles) and physical activity (continuous).
Participants reported frequency of engaging in any moderate or vigorous physical activity such as walking, jogging, running, bicycling, swimming, aerobics, lifting weights, dancing or gardening in the past week. For each activity, an intensity rating (a metabolic equivalent of task, MET) was assigned( Reference Ainsworth, Haskell and Whitt 34 ). We multiplied the frequency and intensity of any physical activity performed in the past week.
Participants’ height (centimetres) and weight (kilograms) were measured using standardized methods( 24 ). We calculated BMI from this information and categorized it as underweight (<18·5 kg/m2), normal weight (18·5–<25·0 kg/m2), overweight (25·0–<30·0 kg/m2) or obese (≥30·0 kg/m2). Baseline hypertension was defined as systolic blood pressure ≥140 mmHg, diastolic blood pressure ≥90 mmHg or self-reported use of antihypertensive medication. Serum total cholesterol was assessed using enzymatic methods that were previously described( Reference Allain, Poon and Chan 35 ). We calculated eGFR using the 2009 Chronic Kidney Disease Epidemiology Collaboration equation after calibrating serum creatinine measurements to reference values at the Cleveland Clinic Research Laboratory( Reference Levey, Stevens and Schmid 36 , Reference Selvin, Manzi and Stevens 37 ). We used serum total cholesterol and eGFR as continuous variables. The percentages of participants with missing covariates were low (range: 0–8%). We conducted the analyses among participants with no missing information.
Statistical analyses
We examined participants’ baseline characteristics and nutritional characteristics according to quartiles of frequency of ultra-processed food intake. We used weighted χ 2 tests for categorical variables and weighted ANOVA for continuous variables( Reference Rao and Scott 38 ).
We performed three Cox proportional hazards models, with length of follow-up time as the time metric, to calculate hazard ratios (HR) and 95% CI for the association between frequency of ultra-processed food intake and all-cause mortality and CVD mortality. Model 1 adjusted for demographic characteristics (age, sex, race/ethnicity) and total energy intake. Model 2 adjusted for covariates in Model 1 as well as socio-economic factors (poverty level, education level) and health behaviours (smoking status, physical activity, alcohol intake). In order to test the mediating effect of BMI, hypertension status, total cholesterol and eGFR, secondary analysis was carried out adjusting for these variables in addition to covariates in Model 2 (Model 3). We considered Model 2 as our main result because Model 3 includes factors that may be along the causal pathway. We tested for a linear trend across quartiles using the median value within each quartile.
As sensitivity analyses, we additionally controlled for diet quality scores, as ultra-processed food consumption can be a marker of an unhealthy dietary pattern and to examine the mediating role of diet quality on the association between ultra-processed foods and mortality. In addition, we excluded the first two years of follow-up for all participants to minimize the possibility that deaths were due to an underlying health condition at baseline. We repeated the analyses excluding processed meats (bacon, sausage and processed meats) from ultra-processed food intake to confirm that the observed associations were not due to consumption of processed meat, which has a strong and direct association with mortality( Reference Schwingshackl, Schwedhelm and Hoffmann 39 ). Analyses were conducted using the statistical software package Stata version 13.0.
Results
In the overall sample, participants consumed ultra-processed foods a mean of 4 times/d (range: 0–29·8 times/d). A total of 0·06% of the analytic sample consumed no ultra-processed food on a daily basis. Those in the highest quartile consumed ultra-processed foods more than 5 times/d.
Those in the highest quartile of frequency of ultra-processed food intake were more likely to be younger, male, non-Hispanic White and current smokers, and were less likely to have less than a high school education or to have a household income more than 350% of poverty level (P≤0·01 for all comparisons; Table 1). Those in the highest quartile were more likely to have lower serum total cholesterol (P=0·02) and higher eGFR (P<0·001).
Table 1 Baseline participant characteristics, according to quartile of frequency of ultra-processed food intake, of adults aged ≥20 years (n 11898), Third National Health and Nutrition Examination Survey (NHANES III, 1988–1994)Footnote *
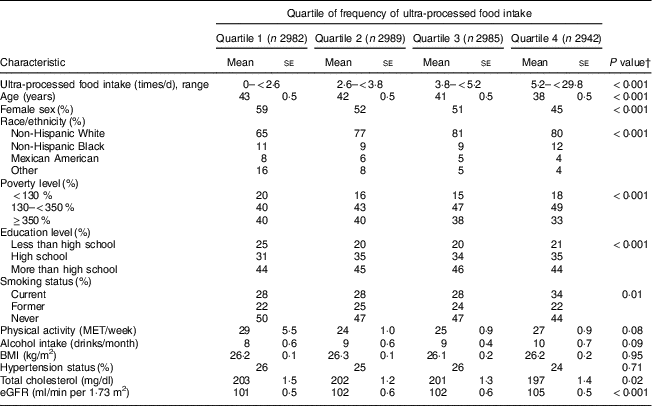
MET, metabolic equivalent of task; eGFR, estimated glomerular filtration rate.
* Values presented are means and their se for continuous variables, and as percentages for categorical variables.
† We tested for differences in baseline characteristics using weighted χ 2 tests for categorical variables and weighted ANOVA for continuous variables.
Participants in the highest quartile of frequency of ultra-processed food intake had significantly higher intakes of total energy, total fat, saturated fat, monounsaturated fat and added sugar, and lower intake of protein (P<0·001 for all comparisons; Table 2). Intakes of fibre, cholesterol and almost all micronutrients were significantly lower among participants in the highest quartile. Those in the highest quartile had lower scores for nutritional quality using NRF9.3 (P<0·001) and diet quality using HEI-2000 (P=0·001).
Table 2 Nutritional characteristics, according to quartile of frequency of ultra-processed food intake (times/d) from participants’ 24h dietary recalls, of adults aged ≥20 years (n 11 898), Third National Health and Nutrition Examination Survey (NHANES III, 1988–1994)
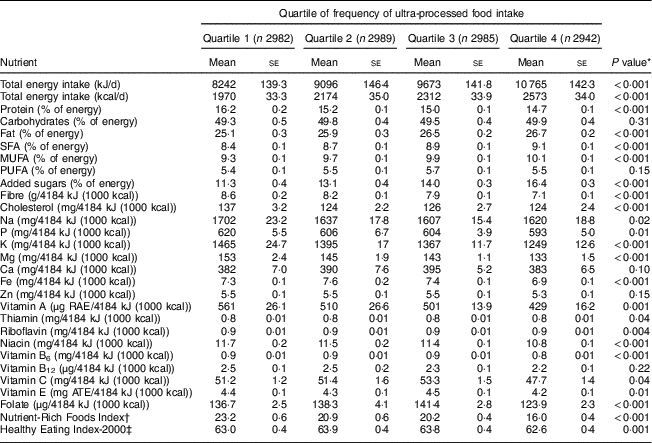
RAE, retinal activity equivalent; ATE, α-tocopherol equivalent.
* We tested for differences in nutritional characteristics using weighted ANOVA.
† After excluding pregnant and lactating women, the Nutrient-Rich Foods Index was calculated based on nine nutrients to encourage (protein, fibre, vitamin A, vitamin C, vitamin E, Ca, Fe, K, Mg) and three nutrients to discourage (saturated fat, added sugar, Na):
 $$\mathop{\tf="Helvitica_font_italic" \sum}\limits_{\tf="Helvitica_font_italic" i{\tf="Helvitica_font_roman" \equals}\tf="Helvitica_font_roman" 1}^{\tf="Helvitica_font_italic" i{\tf="Helvitica_font_roman" \equals}\tf="Helvitica_font_roman" 9} {\left\tf="Helvitica_font_roman" ( {{{{\rm nutrient \it \;i}} \mathord{\left/ {\vphantom {{{\rm nutrient }i} {{\rm recommended daily value for nutrient }i}}} \right. \kern-\nulldelimiterspace} {{\rm recommended {\hskip3pt} daily{\hskip3pt} value{\hskip3pt} for{\hskip3pt} nutrient{\hskip3pt} }\tf="Helvitica_font_italic" i}}} \right\tf="Helvitica_font_roman" )} {\tf="Helvitica_font_roman" \times}\tf="Helvitica_font_roman" 100{\tf="Helvitica_font_roman" \minus}\mathop{\sum}\limits_{\tf="Helvitica_font_italic" i{\tf="Helvitica_font_roman" \equals}\tf="Helvitica_font_roman" 1}^{\tf="Helvitica_font_italic" i{\tf="Helvitica_font_roman" \equals}\tf="Helvitica_font_roman" 3} {\left( \rm{{{nutrient} \it \;i\mathord{\left/ {\vphantom {{nutrient{\rm }i} {maximum daily value for nutrient }}} \right. \kern-\nulldelimiterspace} \rm{maximum\; daily\; value \;for \;nutrient\; }}\it i} \right)} {\times}100.$$
‡ Healthy Eating Index-2000 can range from 0 to 100.
Over a median follow-up of 19 years, 2451 deaths due to any cause occurred and 648 deaths were due to CVD. In Model 2, those in the highest quartile of frequency of ultra-processed food had a 31% higher risk of death compared with those in the lowest quartile (HR = 1·31; 95% CI 1·09, 1·58; P-trend across quartiles=0·001; Table 3). When potential mediating variables were included in the model (Model 3), the association did not change substantially (HR=1·30; 95% CI 1·08, 1·57; P-trend=0·001).
Table 3 Hazard ratios (HR) and 95% CI for all-cause mortality, according to quartile of frequency of ultra-processed food intake (times/d), among adults aged ≥20 years (n 11898), Third National Health and Nutrition Examination Survey (NHANES III, 1988–1994)
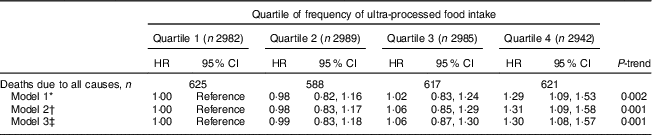
* Model 1 was adjusted for age, sex, race/ethnicity and total energy intake.
† Model 2 was adjusted for the variables in Model 1 plus poverty level, education level, smoking status, physical activity and alcohol intake.
‡ Model 3 was adjusted for the variables in Model 2 plus BMI, hypertension status, total cholesterol and estimated glomerular filtration rate.
No significant associations were observed for frequency of ultra-processed food intake and CVD mortality in Model 2 or Model 3 (Table 4).
Table 4 Hazard ratios (HR) and 95% CI for CVD mortality, according to quartile of frequency of ultra-processed food intake (times/d), among adults aged ≥20 years (n 11 898), Third National Health and Nutrition Examination Survey (NHANES III, 1988–1994)
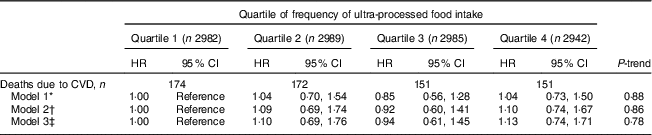
* Model 1 was adjusted for age, sex, race/ethnicity and total energy intake.
† Model 2 was adjusted for the variables in Model 1 plus poverty level, education level, smoking status, physical activity and alcohol intake.
‡ Model 3 was adjusted for the variables in Model 2 plus BMI, hypertension status, total cholesterol and estimated glomerular filtration rate.
Results were similar in sensitivity analyses after additionally adjusting for diet quality scores (all-cause mortality: P-trend=0·001; CVD: P-trend=0·54), after excluding the first two years of follow-up (all-cause mortality: P-trend=0·007; CVD: P-trend=0·88) and after excluding bacon, sausage and processed meats from ultra-processed food intake (all-cause mortality: P-trend=0·02; CVD mortality: P-trend=0·45) in Model 3.
Discussion
Among US adults without chronic disease at baseline, we observed a significant association between higher frequency of ultra-processed food intake and higher risk of all-cause mortality over a median follow-up of 19 years. This association remained significant after adjusting for demographic and socio-economic confounders, health behaviours and clinical factors. We found that a diet that is high in ultra-processed foods consists of a high amount of fat, added sugar and total energy and is low in overall diet quality, protein, fibre and micronutrients.
Our study builds on previous longitudinal studies which used the NOVA framework to study the association between ultra-processed food intake and chronic conditions. These studies reported adverse health outcomes in association with ultra-processed food consumption including obesity, hypertension and cancer at mid-life (40 years of age or older at follow-up)( Reference Mendonça, de, Pimenta and Gea 21 – Reference Fiolet, Srour and Sellem 23 ). To the best of our knowledge, the present study is the first which examined the association between ultra-processed food intake and mortality. Our findings suggest that the adverse health risks associated with ultra-processed food consumption, which were observed in previous studies in mid-life, may lead to a shorter lifespan.
There are several pathways through which ultra-processed foods may increase the risk of all-cause mortality. Participants in the highest quartile of frequency of ultra-processed food intake consumed higher amounts of total energy, total fat, saturated fat and added sugar, and lower amounts of protein, micronutrients and fibre. Low dietary fibre and micronutrients may contribute to earlier death by increasing the risk of major chronic conditions and damaging mitochondrial function( Reference Yang, Zhao and Wu 40 , Reference Ames 41 ). In addition, those in the highest quartile had poor overall diet quality and nutritional quality. In epidemiological studies, diet quality has been shown to be a strong predictor of incident chronic conditions such as diabetes, CVD, cancer and all-cause mortality( Reference Streppel, Sluik and van Yperen 29 , Reference Chiuve, Sampson and Willett 42 – Reference Lassale, Gunter and Romaguera 44 ). However, when we further adjusted for diet quality scores, the results on ultra-processed food intake and all-cause mortality did not change. This suggests that diet quality may not be a strong mediator of the association between ultra-processed food intake and mortality and there may be other bioactive compounds in ultra-processed foods that can increase the risk of death( Reference Fiolet, Srour and Sellem 23 ).
Ultra-processed food intake may elevate the risk of all-cause mortality by increasing exposure to contaminants and environmental chemicals. For example, acrylamide is formed during heating( Reference Nerín, Aznar and Carrizo 13 ), and this compound is considered by the US Environmental Protection Agency and the National Toxicology Program as a neurotoxin and carcinogenic( 45 ). Furthermore, environmental chemicals that are present in food packaging, such as phthalates and bisphenol A, have been shown to be associated with adverse health outcomes( Reference Zota, Phillips and Mitro 11 , Reference Rudel, Gray and Engel 46 , Reference Varshavsky, Morello-Frosch and Woodruff 47 ). Phthalates and bisphenol A are endocrine disruptors that are associated with diabetes and obesity in cross-sectional studies( Reference Stahlhut, van Wijngaarden and Dye 15 , Reference Liu, Lehmler and Sun 16 , Reference James-Todd, Stahlhut and Meeker 48 ). Examining environmental chemicals in ultra-processed foods was beyond the scope of our study, and chemical exposure biomarkers were not available at NHANES III. Further investigation on environmental chemicals in ultra-processed foods and health outcomes is necessary to test these hypotheses.
Given the association between ultra-processed food consumption and CVD risk factors( Reference Mendonça, de, Pimenta and Gea 21 , Reference Mendonça, de, Lopes and Pimenta 22 ), the null association with CVD mortality in our study was surprising. However, it is known that cause-of-death information is often inaccurate on death certificates for CVD( Reference Ravakhah 49 , Reference Smith, Scott and Wagner 50 ). In our data set, the most common cause of death was other causes. It is possible that deaths were coded as ‘other’ if the underlying cause of death was not apparent. In addition, individuals with CVD may be less likely to die from this condition since there are many effective treatments for reducing CVD risk factors such as blood pressure and cholesterol. We had a smaller number of cause-specific (cardiovascular) deaths and therefore less power to detect significant associations. Additional research investigating the association of ultra-processed food intake with CVD events and mortality is needed.
Another surprising result was a lower intake of Na at higher reported frequency of ultra-processed food intake. Given the common notion that processed foods are the largest sources of Na intake( Reference Brown, Tzoulaki and Candeias 51 ), we expected to find higher Na intake in this group. However, similar to our results, a cross-sectional study that used two dietary recalls from NHANES 2009–2010 found lower Na intake among those in the highest quintile of ultra-processed food consumption( Reference Martínez Steele, Popkin and Swinburn 8 ). In contrast, a study in France – which used a specific module to include Na naturally present in foods, salt added during food preparation and at the table, and validated it against urinary Na excretion – showed that Na intake was the highest among those in the highest intake quartile of ultra-processed foods( Reference Fiolet, Srour and Sellem 23 ). Lower Na intake observed in our study may be due to not accounting for salt added during preparation or at the table in NHANES III or possibly underestimation of this nutrient in the food composition database.
Strengths of our study include the use of nationally representative data of US adults, long-term follow-up period, minimal loss to follow-up (0·1%), predefined criteria to classify food items by degree of processing, and comprehensive nutrient analyses considering overall nutritional quality and diet quality.
Several limitations need to be considered. The FFQ that was used in the present study was not designed to answer the research question on food processing. Thus, several ultra-processed foods such as mass-produced breads were not included. Further, there is potential for misclassification. For example, we classified breads as processed foods, but consumption of mass-produced breads, which is considered an ultra-processed food, may be more common than consumption of artisanal breads or handmade breads. We did not use participants’ 24h dietary recall data to rank participants by ultra-processed food consumption because the 24h dietary recall does not represent usual intakes of foods and beverages( Reference Willett 52 ). Only 5% of the participants completed a second 24h dietary recall in this data set, making it difficult to reliably distinguish between those who consumed ultra-processed foods frequently, infrequently and never( Reference National Cancer Institute 53 , 54 ). Moreover, in NHANES III, the 24h dietary recall does not provide detailed descriptions of foods and beverages. This is problematic, particularly for recipe foods, because the data set does not have detailed ingredient lists and focuses mainly on fats used for cooking and fat content of protein foods. Unfortunately, the 24h dietary recall does not provide better information than the FFQ in NHANES III to classify foods according to different levels of processing. The classification of foods by processing level using the 24h dietary recall would require making assumptions about ingredients, which would be subjective and may lead to misclassification.
Another limitation is that no validation study was conducted for the specific FFQ used in NHANES III. However, similar questionnaires of varying length have been validated( Reference Willett, Sampson and Stampfer 55 , Reference Subar, Dodd and Guenther 56 ). In addition, there was a similar trend of demographic characteristics and macro- and micronutrient intakes according to quartiles of ultra-processed food intake when we compared them with studies that used a semi-quantitative FFQ and series of 24h dietary recalls( Reference Mendonça, de, Pimenta and Gea 21 – Reference Fiolet, Srour and Sellem 23 ). This suggests that the FFQ used in our study ranked participants into different quartiles reasonably well. Because frequency of ultra-processed food consumption is not necessarily the only or best proxy for dietary contribution of ultra-processed foods, it is important for future studies to confirm our findings using quantitative estimates of absolute intake instead of frequency of consumption of ultra-processed foods. Next, information bias may be a limitation. Participants may have under-reported ultra-processed food intake at baseline because of social stigma and this could have led to an underestimation of the associations. However, information bias may not be a concern in our data because participants were not specifically asked about ultra-processed food consumption. Participants reported their dietary intakes using an FFQ, and we used prespecified criteria to classify foods according to different levels of processing. Another limitation is that the NHANES III was conducted several decades ago and thus food intake assessed in this cycle does not reflect the current US food supply. Participants’ dietary intake was measured only at baseline, because repeated assessment was not available in this data set. Considering that the modern food supply has shifted to include more ultra-processed foods than in 1988–1994( Reference Monteiro, Moubarac and Cannon 1 ), it is important to replicate our findings in more recent settings where there are repeated measurements of diet to better understand the association between ultra-processed foods and long-term health outcomes. Lastly, even though we controlled for the most important confounders including sociodemographic characteristics, health behaviours and potential risk factors for mortality, there is a possibility of residual confounding due to unmeasured or incorrectly measured covariates.
In addition to these considerations, it may be important to consider the issue of self-selection in future studies, because it is possible that those who were more at risk for death had poorer self-care in general, beyond their dietary choices. However, when we examined additional variables in the NHANES III, we did not find evidence that those in the highest quartile of ultra-processed food intake had poorer self-care. The NHANES III did not assess factors that may have influenced participants to consume ultra-processed foods (i.e. knowledge of potential adverse health outcomes associated with ultra-processed food consumption, perceived convenience, taste and price of ultra-processed foods, or the food environment), which can provide important information to address self-selection. Future studies on ultra-processed foods and health outcomes should consider collecting this information.
Conclusion
In conclusion, we found an elevated risk of all-cause mortality in association with higher frequency of ultra-processed food intake in a nationally representative sample of US adults. Given the consistent results on elevated health risk of ultra-processed food intake, future dietary guidelines might consider making a recommendation about degree of food processing. More longitudinal studies with dietary data reflecting the modern food supply are needed to confirm our results.
Acknowledgements
Financial support: C.M.R. was supported by a Mentored Research Scientist Development Award from the National Institute of Diabetes and Digestive and Kidney Diseases (grant number K01 DK107782). The National Institute of Diabetes and Digestive and Kidney Diseases had no role in the design, analysis or writing of this article. Conflict of interest: All authors have indicated they have no conflicts of interest or financial disclosures relevant to this article. Authorship: H.K. drafted the manuscript and analysed the data. E.A.H. assisted with statistical analyses, interpreted the data and provided critical feedback. C.M.R. designed the research and was involved in all aspects of the manuscript from analyses to writing. All authors read and approved the final manuscript. Ethics of human subject participation: All data were obtained from secondary sources and available publicly. No protocol approval was necessary.
Supplementary material
To view supplementary material for this article, please visit https://doi.org/10.1017/S1368980018003890


