


In 2011, 42·3 % of US lake acreage and 36 % of river miles were under active fish advisories due to contamination( 1 ). Contamination of inland and offshore waters is not unique to the USA, with similar reports in Europe prompting the development of EU-wide marine and water framework directives( Reference Borja, Elliott and Carstensen 2 ). As environmental contaminants (e.g. methylmercury, polychlorinated biphenyls and contaminants associated with oil spills such as polycyclic aromatic hydrocarbons) can accumulate in the tissues of fish and other aquatic organisms, seafood can be a source of contaminant exposure and potential risk to human health( Reference Thompson and Boekelheide 3 ). Concurrent with these advisories, dietary recommendations by the US Department of Agriculture, the National Health and Medical Research Council of Australia and similar governing organizations from thirty-four European countries include fish consumption as a regular part of a healthy balanced diet( 4 – Reference Montagnese, Santarpia and Buonifacio 6 ). This is based on known physiological benefits of n-3 PUFA, specifically EPA and DHA, that help to mitigate CVD( Reference Kris-Etherton, Harris and Appel 7 ). Determining whether health risks associated with specific patterns of seafood consumption may outweigh health benefits depends in part on accurate assessment of seafood consumption( Reference Guthrie 8 ). Regardless, the ability to accurately determine dietary behaviours and mass amounts of seafood consumed in different communities, or in vulnerable populations, is important for discerning both nutritional health benefits as well as potential contaminant exposures.
Individuals and communities that frequently consume seafood, and/or typically consume large portions of seafood, could potentially receive the greatest health benefits, but could also be at higher risk of exposure if contaminants are present in edible portions of seafood at levels of concern to human health. Accurate assessment of seafood consumption patterns is therefore essential to discern benefit to risk ratios and develop meaningful risk assessment tools. Intake evaluation must include the type(s) of seafood as well as the frequency and amount typically consumed. Estimating the portion size of various consumed foods has historically been a significant limitation of dietary studies performed outside a laboratory and cause for criticism of nutrition research( Reference Ayala 9 – Reference Lee, Kang and Wong 11 ). Limitations of dietary assessment in a community setting include error in subjective recall of both frequency and portion of foods and beverages consumed, balanced against the impracticality of ongoing objective quantitative assessment methods such as plate waste or weighed food record analyses( Reference Martins, Cunha and Rodrigues 12 ).
Efforts to improve the accuracy of self-reported dietary intake data include the development of standardized surveys and survey methods such as the multi-pass method for 24 h recalls and the use of food models and photographs to aid portion estimations( Reference Conway, Ingwersen and Vinyard 13 , Reference Subar, Crafts and Zimmerman 14 ). When added to food intake recall methods, such as FFQ or food diaries, photographic guides improve accuracy of food portion size estimates as compared with mental recollection alone and generate data comparable to weighted plate waste measures in a variety of populations( Reference Lucas, Niravong and Villeminot 15 – Reference Nelson and Haraldsdottir 20 ). As ‘seafood’ is a term used to describe a heterogeneous group of fish and shellfish, and population consumption of seafood varies by geographic region, visual guides may be particularly useful when assessing seafood intake. To our knowledge, previous small- and large-scale surveys of seafood intake have not incorporated the use of seafood-specific photographic guides or models to improve the accuracy of respondents’ portion estimates. Other methods to improve accuracy, like plate waste analysis and the use of participant’s plate photographs or food diaries, are less practical for field implementation in understanding consumption patterns for potentially vulnerable populations and for applications for risk assessment in response to environmental disasters. The present study validated the use of a novel seafood photographic portion guide that depicts fish and shrimp portions for accuracy against actual plated seafood portions.
Methods and participants
Development of fish and shrimp photographic portion guide
Fresh tilapia filets (Oreochromis spp.) and white shrimp (Litopenaeus spp.) tails were prepared by one of the authors and digitally photographed using a tripod and dual perspective lighting. Both tilapia and white shrimp are consumed in the Gulf of Mexico coastal study region of interest. More importantly, pilot studies indicated that these products satisfied the ability to produce generic fish and shrimp photographic portions that participants could identify with. Portions of broiled fish or sautéed shrimp were arranged on a plate with a piece of toast and lemon wedge providing a relative scale between portions. On average fish and shrimp mass decreased by 7 and 11 %, respectively, due to cooking. Nevertheless, data evaluated in the present study compared cooked photographic portions with cooked plated portions, and assumed similar water loss in cooking between the seafood prepared for photography v. portioning the reference plates.
Photographic guides were printed on waterproof paper between laminated front- and end-pages, and spiral-bound. Each page contained a single photograph of plated fish or shrimp without reference to weight. Images of plated fish and shrimp were presented in order of amount plated in 2 oz increments. English mass units (ounces), rather than metric units, were used to accommodate ease of regional translation. Each image consistently featured the same ceramic plate with a reference piece of toast and garnished lemon wedge. Images varied only by the amount of fish or shrimp on the plate (Fig. 1). The photographic portion guide consisted of seven photographs of freshly broiled fish in portion sizes ranging from 2 to 14 oz, and eight pictures of sautéed shrimp in portion sizes ranging from 2 to 16 oz.
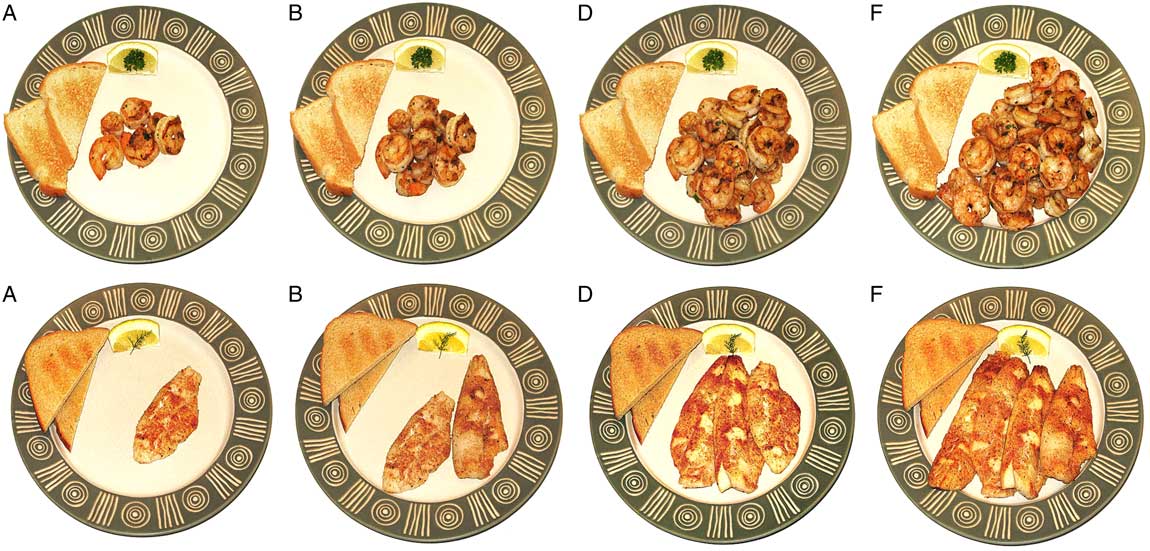
Fig. 1 Shrimp and fish portion images from the photographic seafood portion guide. Participants selected the image that best represented their typical portion. Letters for shrimp (top row) and fish (bottom row) correspond to portion sizes of: A=2oz, B=4oz, D=8oz and F=12oz. A high-resolution, complete version of this seafood portion guide is available for referenced downloading in the online supplementary material to this paper
Study design and participants
Adult participants (≥25 years of age) were recruited for the present portion guide validation study via campus signage and approved email listservs on a university campus. Data were collected from 108 adults: fifty-four participants for the fish study and fifty-three participants for the shrimp study. Studies were conducted at the University of Florida Sensory Taste Panel Laboratory according to guidelines laid down in the Declaration of Helsinki, and all procedures involving human subjects were approved by the Institutional Research Board of the University of Florida (IRB #2003-U-0491). Participants were asked to engage in a seafood taste analysis study and were not told specifically that the use of photographs to estimate portion size was the primary aim of the study. Assessments for the photographic portion guide for fish and shrimp were conducted on separate days with a separate cohort of participants. All procedures were identical for both studies, except for the focus on fish v. shrimp. Participants received a nominal incentive ($US 25) for their time and contribution to the study.
Photographic portion guide validation procedures
Participants in the fish and shrimp studies provided informed consent and were assigned a unique identification number. In the Sensory Taste Panel Laboratory, participants first completed the Reference Meal step of the study. In this step, participants were asked to examine plates that contained freshly cooked fish or shrimp of varying portion sizes and to select the plate that most closely represented the amount they typically consume. For the fish component of the study, seven plates (ranging from 2 to 14 oz) were labelled with the letters A to G from which to choose. For the shrimp component of the study, eight plates (ranging from 2 to 16 oz) were labelled with the letters A to H from which to choose (see online supplementary material). Since the validation study sought generic responses for typical fish and shrimp intake amounts, only one type of fish/shrimp was used for preparing cooked reference plate portions; and participants were asked to choose the plated portion that, on average, best matched what they typically consumed, regardless of the type of fish or shrimp they typically consume. Other fish species known to be significant sources of desirable fatty acids often vary in colour, such as salmon, but are commonly prepared and served in this same manner.
Participants were next escorted to a computer station in a separate area in the Sensory Taste Panel Laboratory to complete the validation step. In this step, participants completed standard demographic questions followed by sensory analysis questions regarding the flavour, texture and appearance of the cooked seafood provided, as well as frequency of consumption in the last 12 months. Participants were then provided with a printed copy of the photographic portion guide and asked to select the image that best represented, on average, the amount of fish or shrimp they might typically consume in a plated meal. Participant selections from the photographic potion guide were compared with their respective selections from plated reference portions.
Statistical analyses
A χ 2 test of goodness-of-fit was performed with α set at 0·05 to discern data distribution from fish and shrimp studies. Participant portion size selections from photographic portions and from plated reference portions were compared using a two-sided t test with α set at 0·05. Correlations (variance) between photographic v. plated portion selections were examined using linear regression with α set at 0·05. Bland–Altman plots with 95 % confidence intervals were used to evaluate bias and agreement between the photographic portion guide responses and plated reference portion responses( Reference Bland and Altman 21 , Reference Carkeet 22 ).
Results
Over half of the participants in each study were female and Caucasian. Additional participant characteristics are shown in Table 1. A χ 2 test of goodness-of-fit demonstrated that participant responses for fish (χ 2 (3,n54)=4·21, P=0·24) and shrimp (χ 2 (4,n53)=7·39, P=0·12) were normally distributed. In the fish study there was no significant difference between photographic portion selections (6·59 (sd 2·65) oz (186·8 (sd 75·1) g)) and reference plate portion selections (7·04 (sd 2·63) oz (199·6 (sd 74·6) g); t(106)=0·87, P=0·384). Similarly in the shrimp study, there was no significant difference between photographic portion selections (6·88 (sd 3·40) oz (195·0 (sd 96·4) g)) and reference plate portion selections (6·06 (sd 2·65) oz (171·8 (sd 75·1) g); t(106)=1·42, P=0·159). Portions selected using the photographic guide predicted plated reference portions for both fish (F(1,50)=78·877, P<0·001; R 2=0·600) and shrimp (F(1,50)=182·018, P<0·001; R 2=0·780) based on linear regression analysis. Bland–Altman plot analyses indicated a 97·5 % probability that at least 95 % of the estimation differences observed in the fish study lay between the bounds of −0·44±3·53 oz ((–12·5±100·1 g); i.e. limits of agreement, with 95 % CI −4·77, 3·89 oz (–135·2, 110·3 g)); differences observed in the shrimp study lay between the bounds of 0·77±3·53 oz ((21·8±100·1 g) with 95 % CI −3·48, 5·18 oz (–98·7, 146·9 g)). These plots also revealed a significant +0·77 oz (+21·8 g) sampling bias in mean photographic portion guide responses relative to plated reference portion responses for shrimp but not for fish (bias=−0·44 oz (–12·5 g); Fig. 2).
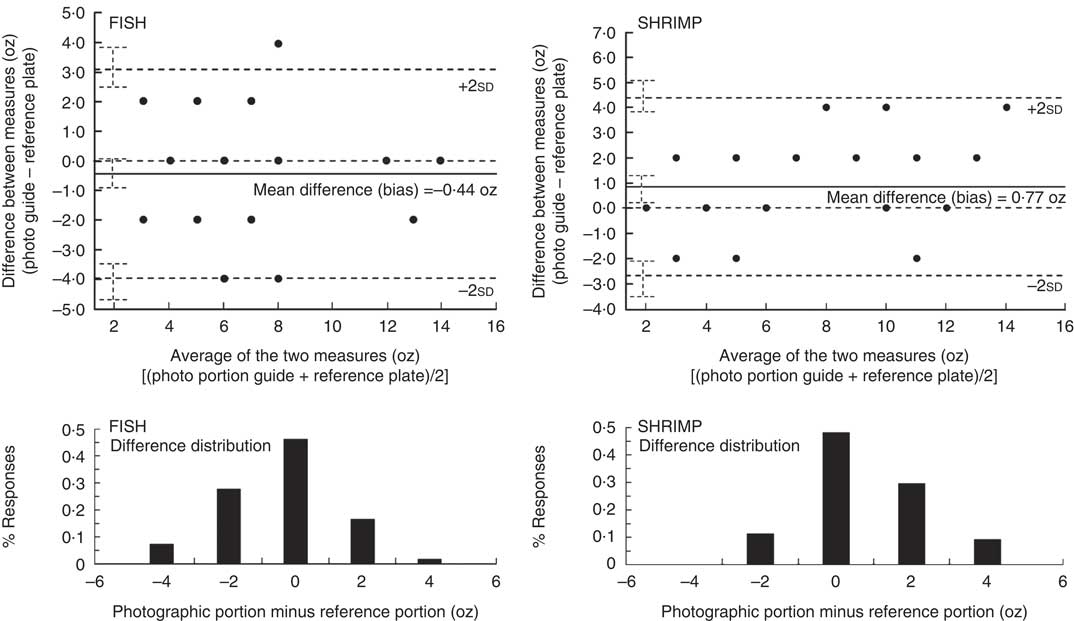
Fig. 2 Top: Bland–Altman plots comparing the photographic portion guide and the plated reference portion responses to estimate ‘typical’ participant intake mass (oz) for fish and shrimp. The 95 % CI of the limits of agreement (dashed lines indicating ±2sd of the mean difference) estimates the magnitude of possible sampling error. The mean difference (solid lines) for the two methods indicates sampling bias; the 95 % CI of the mean difference includes the line of equality (zero) for fish data, but not for shrimp data. Bottom: Distribution plots of differences between participant selections from the photographic portion guide and their plated reference portion. Histograms, supported by χ 2 goodness-of-fit, indicated fish and shrimp data had a normal distribution
Table 1 Gender, age and racial characteristics of the study participants*: adults aged 25–64 years, south-eastern USA

* Data presented are the numbers of participants in each demographic category.
Discussion
The present study validated the utility of a photographic guide for assessing typical portion sizes for fish and shrimp consumed by adults. Data accuracy in the study was comparable to or better than that of other reports using photographs for estimating food portions( Reference Mahaffey, Clickner and Jeffries 23 – Reference Ovaskainin, Paturi and Reinivuo 25 ). Accuracy in assessing fish and shellfish intake is required to discern how seafood consumption can impact health benefits as well as health risks associated with environmental disasters and contaminants( Reference Rotkin-Ellman, Wong and Solomon 26 – Reference Kane 28 ).
Forty-six per cent of respondents in the fish study, and 48 % of respondents in the shrimp study, accurately represented their plated reference portion using the photographic portion guide. Ninety-three per cent of respondents in the fish study, and 91 % of respondents in the shrimp study, represented their plated reference portion ±2 oz (±56·7 g) using the photographic portion guide. Data from both fish and shrimp studies showed positive correlation between the two methods for both fish and shrimp estimates. Such descriptive statistics, however, do not address agreement between the two methods. Bland–Altman plot analyses address potential bias between the mean differences for the two evaluation methods and provide an estimate for an agreement interval, within which 95 % of the differences of the photographic portion guide, compared with the plated reference portions, fall( Reference Giavarina 29 ). These differences ultimately provided acceptable agreement between the two methods from a practical standpoint. Bias in both the fish and shrimp studies was less than 1 oz (28·3 g; Fig. 2). Nevertheless, the 95 % CI for mean differences in shrimp study data (+0·77 oz (+21·8 g)) indicated a systematic difference between the methods, indicating a subtraction correction of 0·77 oz (21·8 g) from shrimp portion guide estimates would be expected to provide data more comparable to the ‘gold standard’ plated reference portions. Bias observed in both studies did not appear associated with low v. high portion size preferences.
Use of generalized photographs, food models and common measuring tools to estimate portion sizes in dietary intake studies may not be optimal to support seafood consumption given the heterogeneity of shape and thicknesses among seafood types and portions. Further, portion size over- and underestimation can vary considerably between different foods, as not all foods are equal for consumers to accurately estimate portion sizes( Reference Robinson, Morritz and McGuiness 16 ). Since most individuals consume mixed diets, minor overestimation of some foods may be nullified by minor underestimations of others when assessing overall dietary intake. As the use of a photographic portion guide to assess seafood consumption is simple, and can provide estimation accuracy comparable to weighed food intake( Reference Williamson, Allen and Martin 18 ), specific methods such as this should be considered and utilized.
Quantifying seafood intake and assessing changes in patterns of seafood intake over time are largely dependent on accurate portion estimation. The 2010 Deepwater Horizon oil spill in the Gulf of Mexico provides an example where refinements in risk assessment methods were needed to protect public health, particularly Gulf coast residents who consume substantially higher amounts of regional seafood than the general population( 30 – Reference Thoradeniya, de Silva and Arambepola 32 ). In conducting risk assessment, as well as discerning health benefits of individual foods, more accurate measures of intake are paramount. Researchers and public health officials concerned with both exposure and health benefits of other food types also recognize the challenges in collecting accurate food-specific intake data and the usefulness of specific food photograph guides, particularly in community settings( Reference Lombard, Steyn and Burger 33 , Reference Amougou, Cohen and Mbala 34 ). Hence, intake assessment methods must be feasible and affordable for use in communities as well as in busy clinical settings where time and resources may be limited.
This validation work was a first step to optimize assessment accuracy of fish and shrimp intake in a community setting using the photographic portion guide. Participants in the present study included a diverse adult population from a single community in the south-eastern USA. Application of the photographic guide for different populations in other geographic regions should include piloting and validation efforts to consider cultural differences and commonly consumed seafood types. Photographs included in this guide were broiled fish and sautéed shrimp. Since reference plates shown to participants in each trial were presented solely in the same manner, usefulness of the guide in estimating portion sizes when these foods are prepared using other methods, such as added to soups or stews, was not evaluated as part of the current validation study. Other fish species known to be significant sources of desirable fatty acids are often prepared in this same manner. These limitations should be recognized when using the guide in its current form in conjunction with food intake survey questions in any population of interest.
Accurate seafood intake data drive decision making for consumption advisories and implementing risk assessments associated with seafood consumption. This photographic guide is a novel contribution for others to use (without adaptation, citing this paper) in conducting nutrition studies and collecting accurate seafood portion estimates in support of community and public health.
Acknowledgements
Financial support: This work was supported by the National Institute of Environmental Health Sciences (NIEHS; grant number U19 ES020683). The NIEHS had no role in the design, analysis or writing of this article. Conflict of interest: None. Authorship: A.E.M. and A.S.K. designed the study. A.E.M., A.A.-R. and A.S.K. carried out the study. A.E.M. and A.S.K. analysed the data, and A.E.M., A.A.-R. and A.S.K. wrote the manuscript. All authors reviewed and approved the final manuscript. Ethics of human subject participation: This study was conducted according to the guidelines laid down in the Declaration of Helsinki and all procedures involving human subjects were approved by the University of Florida Institutional Review Board (IRB #2003-U-0491). Written informed consent was obtained from all subjects.
Supplementary material
To view supplementary material for this article, please visit https://doi.org/10.1017/S1368980017000945


 Open access