


Given the influence that food can have on the development, prevention and treatment of diseases, having a thorough knowledge of a population’s food habits is of vital importance. However, measurements of dietary intake are difficult to perform and are thus considered as one of the major methodological challenges within the field of nutritional epidemiology(Reference Rodríguez, Fernández and Pastor1).
Currently, semiquantitative FFQ (SFFQ) are considered to be an important method of obtaining data on the long-term habitual intake patterns of large populations(Reference Herrán, Gamboa Delgado and Prada2). The main objective of SFFQ is to assess diet over long periods of time. They have been used for research on epidemiology and non-communicable diseases, as well as in studies focused on specific foods or nutrients(Reference Willett3). In addition, the SFFQ is considered to be a relatively inexpensive, quick and easy-to-implement method that can provide in-depth insights into food and nutrient intake and dietary patterns(Reference Rodríguez, Fernández and Pastor1,Reference Chinnock4) .
Unlike qualitative FFQ, SFFQ include specific portion sizes in their questions or items on food intake frequency(Reference Willett3) and they also require weighted responses regarding these portions. Their overall aim is to obtain estimates of nutrient intake, which may help to identify dietary deficiencies or excesses.
However, because a SFFQ that has been developed in a particular society and culture may not be applicable elsewhere, first it must be validated in the population for which it has been designed(Reference Rodríguez, Fernández and Pastor1,Reference Martin-Moreno, Boyle and Gorgojo5) , given that validity is a continuous variable which may range from no validity to very high(Reference Willett3). Besides, because SFFQ responses are based on memories of previous eating habits, administering them to children and the elderly may be particularly problematic. Hence, they are generally and should preferably be administered to healthy adults when validating the instrument for use on the general population(Reference Martin-Moreno, Boyle and Gorgojo5).
Because of the considerable variety of available SFFQ, it may be challenging to select the best one for a context. Thus, this systematic review of SFFQ validation studies to assess food intake in adults is intended to serve as an up-to-date reference tool that will help researchers to validate SFFQ or choose those best suited to the needs of whatever specific studies they wish to conduct on particular populations.
Methods
This study is a systematic review that followed criteria for the search and selection of articles stipulated by the Preferred Reporting Items for Systematic Reviews and Meta-Analyses (PRISMA) statement(Reference Moher, Liberati and Tetzlaff6). Also, the protocol for this study was registered in the International Prospective Register of Systematic Reviews (PROSPERO) with registration number CRD42017064716.
Literature search
Two authors (E.S.-R. and M.F.B.-O.) performed a systematic search in the PubMed bibliographic index for articles in four languages. Individual searches (twelve in total) paired all possible combinations of the multi-word terms ‘semiquantitative food frequency questionnaire’, ‘semi-quantitative food frequency questionnaire’ and ‘semiquantitative food-frequency questionnaire’ with ‘validity’ and ‘validation’. Each of these searches was performed using both the ‘all fields’ and the ‘title/abstract’ retrieval categories. Results included articles published up to the date of the last search (31 January 2020).
Study selection
Articles were chosen based on six inclusion criteria: (1) be original SFFQ validation articles; (2) analyse nutrient intake, with or without energy or food groups analysis, and without an exclusive focus on specific nutrients (e.g. folic acid or Fe); (3) include healthy adults with no particular nutritional needs (pregnant women, athletes, etc.); (4) include individuals without cognitive impairment (when elderly subjects are studied); (5) include analyses with correlation coefficients (Spearman’s, Pearson’s and intraclass); (6) be published in English, Spanish, French or Portuguese. Exclusion criteria were studies that (1) validate SFFQ designed for specific diseases (e.g. cancer) or conditions (e.g. post-myocardial infarction); (2) report only food group analyses; (3) describe data only in tertiles, quartiles or quintiles without reporting correlation coefficients and (4) include data reported in a previous paper.
Abstracts obtained using these search criteria were assessed for eligibility according to inclusion criteria and retrieved through the University of Guadalajara’s virtual library and databases, open access links or Google Scholar. If a full-text paper could not be retrieved through these means, it was obtained by contacting the paper’s corresponding author or through the payment of applicable fees. Related articles identified when searching full-text papers were also retrieved, after confirming their adherence to the inclusion criteria and their presence in PubMed. The full text of these studies was also assessed for eligibility. Any doubts about the eligibility of studies were resolved through discussions with a third author (B.V.). Table 1 shows criteria for participants, outcomes and study design (PICOS statement: population [P], outcomes [O] and study design [S]; intervention [I] and comparator [C] are non-applicable since we did not search for clinical trial data).
Table 1 PICOS (participants, intervention, comparator, outcome, study design) criteria for study selection

SFFQ, semiquantitative FFQ.
Data extraction
Independent data extraction from articles was performed by four authors (E.S.-R., M.F.B.-O., G.M.-O. and M.B.A.-M.) in a non-blinded way, into an Excel form for evidence synthesis.
For each SFFQ, the following characteristics were analysed: author and year of publication, country in which the questionnaire was developed, geographical region, number and sex of participants, minimum and maximum ages or age range (difference between the extremes), number of items, number of response categories, visual support to identify portion sizes and how SFFQ were administered (by interview or self-administration). For the analysis of data used in the validation, the following was recorded: validation methods (records and recalls) and the number of times they used; units of analysis (energy, nutrients and food groups) with the lowest and highest correlation coefficient values that were produced (Pearson’s, Spearman’s, intraclass and Rosner’s); and the specific values for energy, carbohydrates, proteins, fat and nutrients that were mentioned most frequently across studies (Ca, Fe, etc.). To determine which nutrients were most frequently reported, a matrix was created in Excel into which the nutrients reported in the studies were captured and where the seven most mentioned nutrients were highlighted. Regarding reproducibility, the intervals between questionnaire administrations and correlation coefficients (Pearson’s, Spearman’s, intraclass and Rosner’s) were identified.
Quality assessment
Risk of bias analysis was conducted applying elements of three tools: Newcastle–Ottawa scale for cohort studies(Reference Wells, Shea and O’Connell7), the Cochrane evaluation tool(Reference Higgins and Green8) and some aspects considered in the Strobe statement(Reference von Elm, Altman and Egger9). The Newcastle–Ottawa scale was used to assess: the representativeness of the sample (not volunteers); the assurance of exposure (data obtained from the instruments used to validate the SFFQ were mainly through reminders or records, not self-reporting); whether the analyses were controlled by at least one additional variable (e.g. energy); the method used to assess the results of the SFFQ (preferably by interview); the duration of the follow-up to validate the tool (ideally 6–12 months) and whether it was representative of the habitual diet; and the number of dropouts during the follow-up phase (ideally <30 % of the population) with explanations of the reasons. Cochrane’s tool was used to assess the risk of notification bias (considered as low when the results were consistent with those described in the methodology section). Finally, based on the Strobe Statement, some aspects of the methodology (description of the location, dates, recruitment periods, and eligibility criteria; a detailed description of the SFFQ application method; the way in which the sample size was determined; a description of how variables were addressed in the analysis) and the results (description of participant characteristics and confounding variables and reports of other analyses such as de-attenuation) were evaluated. A total of fourteen factors related to the risk of bias were assessed in each of the studies.
Results
Study selection
Using the above-described search strategy, we initially found 741 articles. After deleting duplicates, this number was reduced to 222. Of these, a total of sixty articles were selected from the bibliographic search, excluding two(Reference Katsouyanni, Rimm and Gnardellis10,11) which reported data described in previous papers(Reference Gnardellis, Trichopoulou and Katsouyanni12,Reference Willett, Reynolds and Cottrell-Hoehner13) (duplicate data). We added another two articles, which appeared as related articles during full-text searches. We included these articles, which were retrieved from the Internet because they had been published in journals cited in PubMed and met our inclusion criteria. A total of sixty articles were thus included in the analysis. The flow chart for the selection of the articles is shown in Fig. 1.

Fig. 1 Flow chart of the selection process for studies
Studies’ and participants’ characteristics
Table 2 shows the characteristics of the included validation studies. The selected studies had been published in six geographical categories: twenty-five in Europe(Reference Martin-Moreno, Boyle and Gorgojo5,Reference Gnardellis, Trichopoulou and Katsouyanni12,Reference Klipstein-Grobusch, Den Breeijen and Goldbohm14–Reference Grootenhuis, Westenbrink and Sie36) , seventeen in the Americas(Reference Willett, Reynolds and Cottrell-Hoehner13,Reference Dehghan, del Cerro and Zhang37–Reference Macedo-Ojeda, Vizmanos-Lamotte and Márquez-Sandoval52) , eleven in Asia(Reference Bowen, Bharathi and Kinra53–Reference Aoun, Daher and Osta63), five in Oceania(Reference Barrett and Gibson64–Reference Beck, Houston and McNaughton68), one in Africa(Reference Zack, Irema and Kazonda69) and one article had origins in both Asia and Europe(Reference Gunes, Imeryuz and Akalin70). The publication periods of the articles found were as follows: fifteen were published from 1985 to 1995(Reference Martin-Moreno, Boyle and Gorgojo5,Reference Gnardellis, Trichopoulou and Katsouyanni12,Reference Willett, Reynolds and Cottrell-Hoehner13,Reference Porrini, Gentile and Fidanza21,Reference Ramón, Micaló and Benítez22,Reference Rothenberg25,Reference Tjønneland, Overvad and Haraldsdóttir27,Reference Fidanza, Gentile and Porrini33,Reference Grootenhuis, Westenbrink and Sie36,Reference Rimm, Giovannucci and Stampfer39,Reference Willet, Sampson and Stampfer42,Reference Feskanich, Marshall and Rimm46,Reference Lee, Lee and Wang50,Reference Longnecker, Lissner and Holden51,Reference Horwath66) ; nineteen were published from 1996 to 2005(Reference Klipstein-Grobusch, Den Breeijen and Goldbohm14,Reference Masson, MCNeill and Tomany16,Reference Moreira, Sampaio and Almeida17,Reference Ocké, Bueno-de-Mesquita and Pols20,Reference Roddam, Spencer and Banks23,Reference Schröder, Covas and Marrugat26,Reference Bonifacj, Gerber and Scali30,Reference Fregapane and Asensio-García34,Reference Friis, Kjaer and Stripp35,Reference Nath and Huffman38,Reference Rodríguez, Méndez and Torún40,Reference Shatenstein, Nadon and Godin41,Reference Hernández-Avila, Romieu and Parra47–Reference Kumanyika, Tell and Shemanski49,Reference Chen, Ahsan and Parvez54,Reference Ke, Toshiro and Fengyan57,Reference Tokudome, Imaeda and Tokudome60,Reference Smith, Mitchell and Reay67) ; and twenty-six were published from 2006 to January 2020(Reference Knudsen, Hatch and Cueto15,Reference Mullie, Clarys and Hulens18,Reference Nöthlings, Hoffmann and Bergmann19,Reference Babíc, Sindik and Missoni24,Reference Van Dongen, Lentjes and Wijckmans28,Reference Gazan, Vieux and Darmon29,Reference Dumartheray, Krieg and Cornuz31,Reference Fernández-Ballart, Piñol and Zazpe32,Reference Dehghan, del Cerro and Zhang37,Reference Yuan, Spiegelman and Rimm43–Reference Denova-Gutiérrez, Ramírez-Silva and Rodríguez-Ramírez45,Reference Macedo-Ojeda, Vizmanos-Lamotte and Márquez-Sandoval52,Reference Bowen, Bharathi and Kinra53,Reference Bijani, Esmaili and Ghadimi55,Reference Jayawardena, Byrne and Soares56,Reference Park, Noh and Song58,Reference Sudha, Radhika and Sathya59,Reference Yang, Kim and Hwang61–Reference Fayet, Flood and Petocz65,Reference Beck, Houston and McNaughton68–Reference Gunes, Imeryuz and Akalin70) .
Table 2. Characteristics of the population and of the SFFQs validated in the studies included in the review, ordered chronologically.
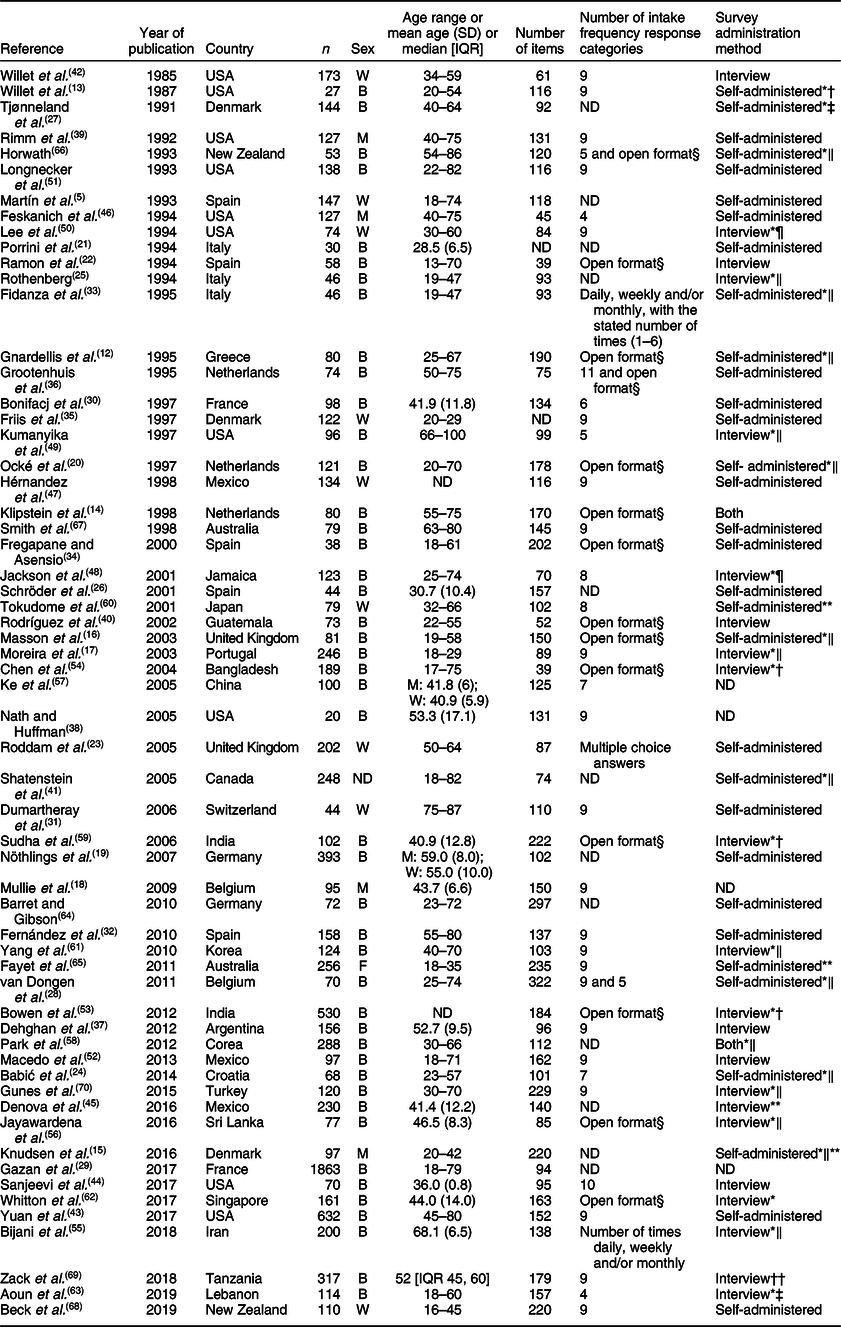
IQR, interquartile range; W, women; B, both; M, men; ND, not described.
*Visual support material was used.
†Household or utensil-based measurements.
‡Food models and photographs.
§Times per day, week, month, never, etc., with non-specific ranges.
‖Photographs.
¶Food models.
**Electronic format.
††Black and white plates and food portions drawings.
The study with the fewest participants was that by Nath and Huffman(Reference Nath and Huffman38), which was conducted on twenty Cuban immigrants to the USA. The largest sample, found in a study from France, consisted of 1863 participants(Reference Gazan, Vieux and Darmon29). No justification was found for the sample sizes used in the validations.
More than half of the studies (81·1 %) included men and women(Reference Gnardellis, Trichopoulou and Katsouyanni12–Reference Klipstein-Grobusch, Den Breeijen and Goldbohm14,Reference Masson, MCNeill and Tomany16,Reference Moreira, Sampaio and Almeida17,Reference Nöthlings, Hoffmann and Bergmann19–Reference Ramón, Micaló and Benítez22,Reference Babíc, Sindik and Missoni24–Reference Van Dongen, Lentjes and Wijckmans28,Reference Bonifacj, Gerber and Scali30,Reference Fernández-Ballart, Piñol and Zazpe32–Reference Fregapane and Asensio-García34,Reference Grootenhuis, Westenbrink and Sie36–Reference Nath and Huffman38,Reference Rodríguez, Méndez and Torún40,Reference Yuan, Spiegelman and Rimm43,Reference Denova-Gutiérrez, Ramírez-Silva and Rodríguez-Ramírez45,Reference Jackson, Walker and Cade48,Reference Kumanyika, Tell and Shemanski49,Reference Longnecker, Lissner and Holden51–Reference Chen, Ahsan and Parvez54,Reference Jayawardena, Byrne and Soares56–Reference Sudha, Radhika and Sathya59,Reference Yang, Kim and Hwang61,Reference Barrett and Gibson64,Reference Horwath66,Reference Smith, Mitchell and Reay67,Reference Gunes, Imeryuz and Akalin70) ; 13 (24·5 %) had exclusively women participants(Reference Martin-Moreno, Boyle and Gorgojo5,Reference Knudsen, Hatch and Cueto15,Reference Roddam, Spencer and Banks23,Reference Dumartheray, Krieg and Cornuz31,Reference Friis, Kjaer and Stripp35,Reference Willet, Sampson and Stampfer42,Reference Sanjeevi, Freeland-Graves and George44,Reference Hernández-Avila, Romieu and Parra47,Reference Lee, Lee and Wang50,Reference Tokudome, Imaeda and Tokudome60,Reference Whitton, Ho and Tay62,Reference Fayet, Flood and Petocz65,Reference Beck, Houston and McNaughton68) ; three studies (5·7 %) had only men(Reference Mullie, Clarys and Hulens18,Reference Rimm, Giovannucci and Stampfer39,Reference Feskanich, Marshall and Rimm46) and one (1·9 %) did not mention the sex of participants(Reference Shatenstein, Nadon and Godin41).
Of the total number of articles, forty-three reported minimum and maximum ages. Among them, twenty-two had minimum ages in the 18–25 range(Reference Martin-Moreno, Boyle and Gorgojo5,Reference Gnardellis, Trichopoulou and Katsouyanni12,Reference Willett, Reynolds and Cottrell-Hoehner13,Reference Knudsen, Hatch and Cueto15–Reference Moreira, Sampaio and Almeida17,Reference Ocké, Bueno-de-Mesquita and Pols20,Reference Babíc, Sindik and Missoni24,Reference Van Dongen, Lentjes and Wijckmans28,Reference Gazan, Vieux and Darmon29,Reference Fidanza, Gentile and Porrini33–Reference Friis, Kjaer and Stripp35,Reference Rodríguez, Méndez and Torún40,Reference Shatenstein, Nadon and Godin41,Reference Sanjeevi, Freeland-Graves and George44,Reference Jackson, Walker and Cade48,Reference Longnecker, Lissner and Holden51,Reference Macedo-Ojeda, Vizmanos-Lamotte and Márquez-Sandoval52,Reference Aoun, Daher and Osta63–Reference Fayet, Flood and Petocz65) , while three articles reported minimum ages of 13(Reference Ramón, Micaló and Benítez22), 16(Reference Beck, Houston and McNaughton68) and 17 years(Reference Chen, Ahsan and Parvez54). The majority of papers (31 of 43) reported maximum ages between 42 and 75 years(Reference Martin-Moreno, Boyle and Gorgojo5,Reference Gnardellis, Trichopoulou and Katsouyanni12–Reference Masson, MCNeill and Tomany16,Reference Ocké, Bueno-de-Mesquita and Pols20,Reference Ramón, Micaló and Benítez22–Reference Babíc, Sindik and Missoni24,Reference Tjønneland, Overvad and Haraldsdóttir27,Reference Van Dongen, Lentjes and Wijckmans28,Reference Fidanza, Gentile and Porrini33,Reference Fregapane and Asensio-García34,Reference Grootenhuis, Westenbrink and Sie36,Reference Rimm, Giovannucci and Stampfer39,Reference Rodríguez, Méndez and Torún40,Reference Willet, Sampson and Stampfer42,Reference Sanjeevi, Freeland-Graves and George44,Reference Feskanich, Marshall and Rimm46,Reference Jackson, Walker and Cade48,Reference Lee, Lee and Wang50,Reference Macedo-Ojeda, Vizmanos-Lamotte and Márquez-Sandoval52,Reference Chen, Ahsan and Parvez54,Reference Park, Noh and Song58,Reference Tokudome, Imaeda and Tokudome60,Reference Yang, Kim and Hwang61,Reference Aoun, Daher and Osta63,Reference Barrett and Gibson64,Reference Beck, Houston and McNaughton68,Reference Gunes, Imeryuz and Akalin70) . The maximum age was 100 years(Reference Kumanyika, Tell and Shemanski49).
Quality of the studies
Most studies met at least half of the risk of bias and quality criteria that were assessed, and nine studies met less than half of the established criteria. The studies that met most of the criteria were Klipstein et al. (Reference Klipstein-Grobusch, Den Breeijen and Goldbohm14), Chen et al. (Reference Chen, Ahsan and Parvez54), Ocké et al. (Reference Ocké, Bueno-de-Mesquita and Pols20), Gunes et al. (Reference Gunes, Imeryuz and Akalin70) and Whitton et al. (Reference Whitton, Ho and Tay62), in which twelve of the fourteen criteria were met.
An analysis of all risk of bias and quality factors shows that the least frequently reported criterion in these studies is the sample size (five of sixty articles). Another aspect that should be improved is the representativeness of the sample, since about half of the studies have volunteer subjects (twenty-seven of sixty), and four studies do not explain how sample selection was carried out. Furthermore, twelve studies do not describe the eligibility criteria for subjects and/or the selection methods used, and twenty-four do so incompletely; twenty-five contain incomplete descriptions of locations, dates, subject recruitment periods and other related information. Finally, twenty-one studies do not describe the reasons for follow-up losses, a factor that may compromise their quality (see Supplemental Table 1a and Table 1b in the supplementary material).
Characteristics of the semiquantitative FFQ
Table 2 also shows the number of items in each SFFQ. The lowest number of items was thirty-nine in two studies(Reference Ramón, Micaló and Benítez22,Reference Chen, Ahsan and Parvez54) , while the highest was 322(Reference Van Dongen, Lentjes and Wijckmans28). Two articles omitted the number of items studied(Reference Porrini, Gentile and Fidanza21,Reference Friis, Kjaer and Stripp35) .
Regarding the number of response categories for intake frequency, 21 studies (35 %) used nine categories(Reference Willett, Reynolds and Cottrell-Hoehner13,Reference Moreira, Sampaio and Almeida17,Reference Mullie, Clarys and Hulens18,Reference Dumartheray, Krieg and Cornuz31,Reference Fernández-Ballart, Piñol and Zazpe32,Reference Friis, Kjaer and Stripp35,Reference Dehghan, del Cerro and Zhang37–Reference Rimm, Giovannucci and Stampfer39,Reference Willet, Sampson and Stampfer42,Reference Yuan, Spiegelman and Rimm43,Reference Hernández-Avila, Romieu and Parra47,Reference Lee, Lee and Wang50–Reference Macedo-Ojeda, Vizmanos-Lamotte and Márquez-Sandoval52,Reference Yang, Kim and Hwang61,Reference Fayet, Flood and Petocz65,Reference Smith, Mitchell and Reay67–Reference Gunes, Imeryuz and Akalin70) . Some studies included non-specific response options (Van Dongen et al.(Reference Van Dongen, Lentjes and Wijckmans28) had 5–9 response categories depending on food group section; Fidanza(Reference Fidanza, Gentile and Porrini33) had three categories combined with a ‘number of times’ frequency). Other articles(Reference Rodríguez, Fernández and Pastor1,Reference Gnardellis, Trichopoulou and Katsouyanni12,Reference Klipstein-Grobusch, Den Breeijen and Goldbohm14,Reference Masson, MCNeill and Tomany16,Reference Ocké, Bueno-de-Mesquita and Pols20,Reference Ramón, Micaló and Benítez22,Reference Roddam, Spencer and Banks23,Reference Fidanza, Gentile and Porrini33,Reference Fregapane and Asensio-García34,Reference Bowen, Bharathi and Kinra53–Reference Jayawardena, Byrne and Soares56,Reference Sudha, Radhika and Sathya59,Reference Whitton, Ho and Tay62) included direct questions about intake frequency (options: never/rarely; number of times per month/week/day). Also, eleven did not describe such data(Reference Martin-Moreno, Boyle and Gorgojo5,Reference Knudsen, Hatch and Cueto15,Reference Nöthlings, Hoffmann and Bergmann19,Reference Porrini, Gentile and Fidanza21,Reference Rothenberg25–Reference Tjønneland, Overvad and Haraldsdóttir27,Reference Gazan, Vieux and Darmon29,Reference Shatenstein, Nadon and Godin41,Reference Denova-Gutiérrez, Ramírez-Silva and Rodríguez-Ramírez45,Reference Park, Noh and Song58,Reference Barrett and Gibson64) .
Several studies used visual support tools to enable participants to easily identify food intake amounts: seventeen studies mentioned the use of photographs(Reference Gnardellis, Trichopoulou and Katsouyanni12,Reference Knudsen, Hatch and Cueto15–Reference Moreira, Sampaio and Almeida17,Reference Ocké, Bueno-de-Mesquita and Pols20,Reference Babíc, Sindik and Missoni24,Reference Rothenberg25,Reference Van Dongen, Lentjes and Wijckmans28,Reference Fidanza, Gentile and Porrini33,Reference Shatenstein, Nadon and Godin41,Reference Kumanyika, Tell and Shemanski49,Reference Bijani, Esmaili and Ghadimi55,Reference Jayawardena, Byrne and Soares56,Reference Park, Noh and Song58,Reference Yang, Kim and Hwang61,Reference Horwath66,Reference Gunes, Imeryuz and Akalin70) ; four used household measures(Reference Willett, Reynolds and Cottrell-Hoehner13,Reference Bowen, Bharathi and Kinra53,Reference Chen, Ahsan and Parvez54,Reference Sudha, Radhika and Sathya59) ; two used photographs and food models as visual aids(Reference Tjønneland, Overvad and Haraldsdóttir27,Reference Aoun, Daher and Osta63) ; two SFFQ used food models(Reference Jackson, Walker and Cade48,Reference Lee, Lee and Wang50) ; one used drawing of plates and different portion sizes(Reference Zack, Irema and Kazonda69) and one mentioned using visual aids but it did not specify which ones(Reference Whitton, Ho and Tay62). The other articles did not say whether visual support for answering the SFFQ was provided(Reference Rodríguez, Fernández and Pastor1,Reference Martin-Moreno, Boyle and Gorgojo5,Reference Klipstein-Grobusch, Den Breeijen and Goldbohm14,Reference Mullie, Clarys and Hulens18,Reference Nöthlings, Hoffmann and Bergmann19,Reference Porrini, Gentile and Fidanza21–Reference Roddam, Spencer and Banks23,Reference Schröder, Covas and Marrugat26,Reference Gazan, Vieux and Darmon29–Reference Fernández-Ballart, Piñol and Zazpe32,Reference Fregapane and Asensio-García34–Reference Rimm, Giovannucci and Stampfer39,Reference Willet, Sampson and Stampfer42–Reference Hernández-Avila, Romieu and Parra47,Reference Longnecker, Lissner and Holden51,Reference Macedo-Ojeda, Vizmanos-Lamotte and Márquez-Sandoval52,Reference Ke, Toshiro and Fengyan57,Reference Tokudome, Imaeda and Tokudome60,Reference Barrett and Gibson64,Reference Fayet, Flood and Petocz65,Reference Smith, Mitchell and Reay67,Reference Beck, Houston and McNaughton68) .
Most SFFQ were self-administered (thirty-two of sixty). Of these, three were sent to participants as electronic forms(Reference Knudsen, Hatch and Cueto15,Reference Tokudome, Imaeda and Tokudome60,Reference Fayet, Flood and Petocz65) ; twenty-one questionnaires were administered through interviews(Reference Rodríguez, Fernández and Pastor1,Reference Moreira, Sampaio and Almeida17,Reference Ramón, Micaló and Benítez22,Reference Rothenberg25,Reference Dehghan, del Cerro and Zhang37,Reference Willet, Sampson and Stampfer42,Reference Sanjeevi, Freeland-Graves and George44,Reference Denova-Gutiérrez, Ramírez-Silva and Rodríguez-Ramírez45,Reference Jackson, Walker and Cade48–Reference Lee, Lee and Wang50,Reference Macedo-Ojeda, Vizmanos-Lamotte and Márquez-Sandoval52–Reference Jayawardena, Byrne and Soares56,Reference Sudha, Radhika and Sathya59,Reference Yang, Kim and Hwang61–Reference Aoun, Daher and Osta63,Reference Zack, Irema and Kazonda69,Reference Gunes, Imeryuz and Akalin70) ; two were administered combining interview and self-administered formats(Reference Klipstein-Grobusch, Den Breeijen and Goldbohm14,Reference Park, Noh and Song58) ; four did not mention the way the questionnaire was administered(Reference Mullie, Clarys and Hulens18,Reference Gazan, Vieux and Darmon29,Reference Nath and Huffman38,Reference Ke, Toshiro and Fengyan57) .
Validity of the analysed semiquantitative FFQ
Table 3 shows the main results of the validation analyses of the reviewed studies: unit of analysis (nutrients, energy and/or food groups), reference method, types of correlation coefficients used with minimum and maximum values, the time interval between the SFFQ and the comparison method, and the time interval between repeated assessments of reference method. Table 4 shows the specific correlation coefficients for energy and macronutrients.
Table 3 Validity of the analysed semiquantitative FFQ (SFFQ), ordered chronologically
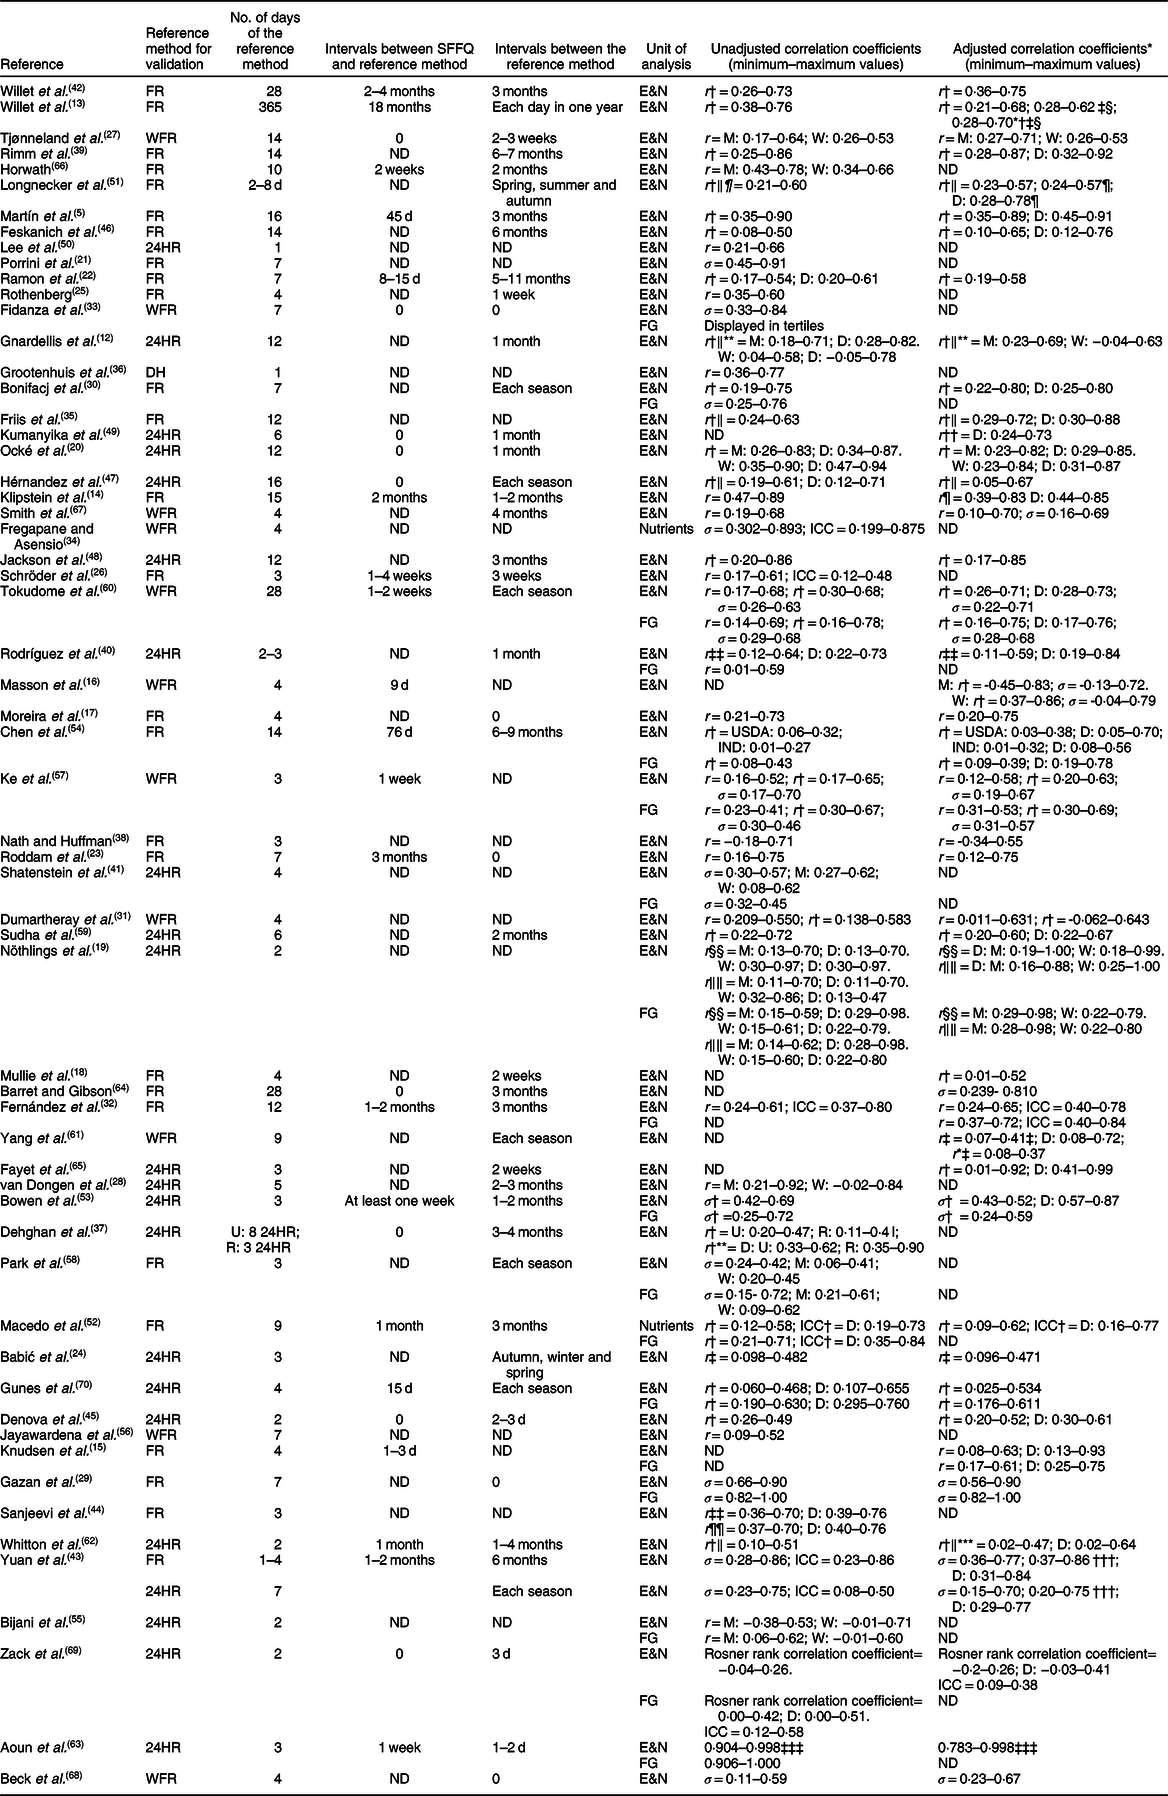
FR, food record; E&N, energy and nutrients; r, Pearson correlation coefficient; WFR, weighed food record; M, men; W, women; D, de-attenuated; 24HR, 24-hour recall; ND, not described; σ, Spearman’s rank correlation coefficient; FG, food groups; DH, diet history; ICC, intraclass correlation coefficient; USDA, Nutrient database from United States Department of Agriculture; IND, Indian Nutrient Database; U, Urban; R, Rural.
*Adjusted by energy, if not otherwise stated.
†With logarithmic scale transformation.
‡Adjusted only by sex.
§Adjusted only by age.
‖Coefficients from the second SFFQ reported.
¶Adjusted by energy, sex and age.
**It is not clear whether the de-attenuated coefficient was for crude or energy-adjusted values.
††Adjusted only by sex and age.
‡‡With logarithmic scale transformation for some nutrients.
§§Fitted portion size.
‖‖Predefined portion size.
¶¶Assuming uniform intake of multiple foods in a line in the FFQ.
***Adjusted for ethnicity, age and sex.
†††Energy density method (divides the nutrient portion by total energy intake).
‡‡‡Pearson o Spearman’s was used depending on normality distribution.
Table 4 Results of energy and macronutrient validity for the analysed studies, ordered chronologically
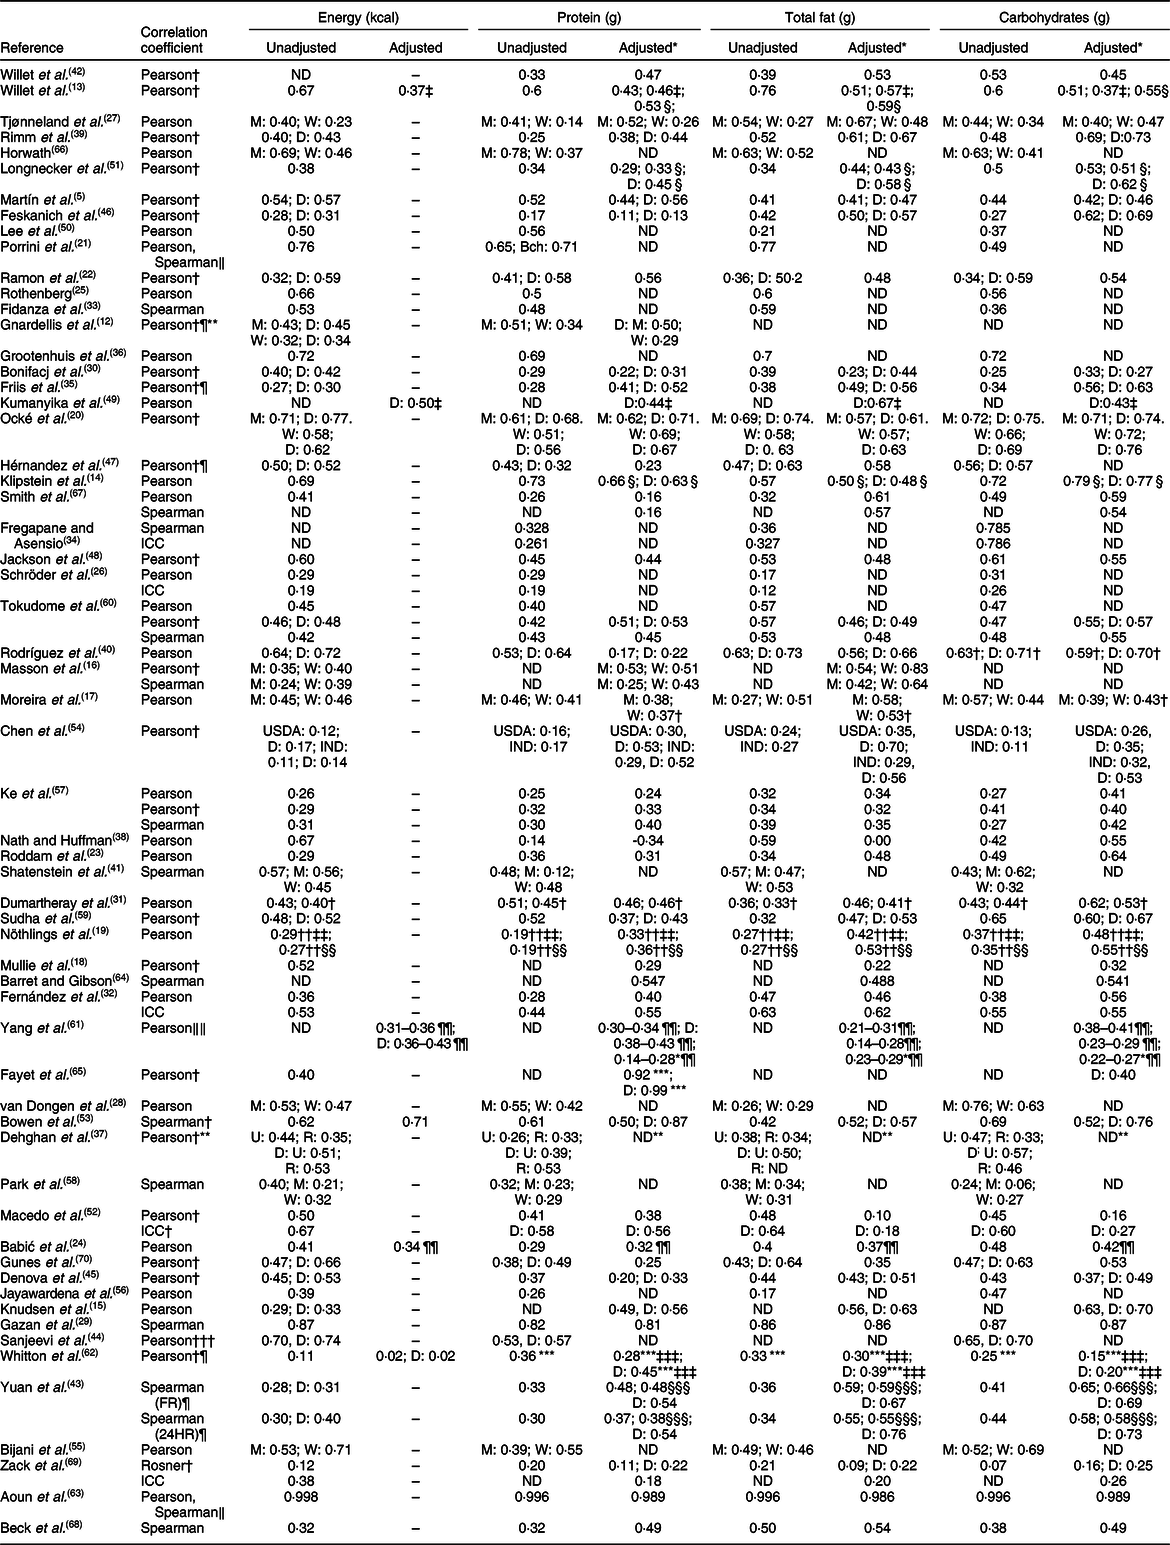
ND, not described; M, men; W, women; D, de-attenuated; Bch, biochemical analyses; ICC, intraclass correlation coefficient; USDA, Nutrient database from United States Department of Agriculture; IND, Indian Nutrient Database; U, urban; R, Rural; FR, food record; 24HR, 24-hour recall.
*Adjusted by energy, if not otherwise stated.
†With logarithmic scale transformation.
‡Adjusted by sex and age.
§Adjusted by energy–age–sex.
‖Pearson’s correlation was used for variables with normal distributions and Spearman’s for non-parametrically distributed variables.
¶Coefficients from the second SFFQ are reported.
**It is not clear whether the coefficients were for raw or adjusted values.
††Averaged values for male and female subjects.
‡‡Fitted portion size.
§§Predefined portion size.
‖‖Displayed as a range because correlation coefficients are shown for each season of the year.
¶¶Adjusted by sex.
***Presented as percentage of energy.
†††With logarithmic scale transformation for some nutrients.
‡‡‡Adjusted for ethnicity, age and sex.
§§§Energy density method (divides the nutrient portion by total energy intake).
All studies analysed the validity of SFFQ concerning nutrients and energy, except for two that presented no energy data(Reference Fregapane and Asensio-García34,Reference Macedo-Ojeda, Vizmanos-Lamotte and Márquez-Sandoval52) . Eighteen studies focused on ‘food groups’ as the unit of analysis(Reference Rodríguez, Fernández and Pastor1,Reference Knudsen, Hatch and Cueto15,Reference Nöthlings, Hoffmann and Bergmann19,Reference Gazan, Vieux and Darmon29,Reference Bonifacj, Gerber and Scali30,Reference Fernández-Ballart, Piñol and Zazpe32,Reference Fidanza, Gentile and Porrini33,Reference Shatenstein, Nadon and Godin41,Reference Macedo-Ojeda, Vizmanos-Lamotte and Márquez-Sandoval52–Reference Bijani, Esmaili and Ghadimi55,Reference Ke, Toshiro and Fengyan57,Reference Park, Noh and Song58,Reference Tokudome, Imaeda and Tokudome60,Reference Aoun, Daher and Osta63,Reference Zack, Irema and Kazonda69,Reference Gunes, Imeryuz and Akalin70) (Table 3). Regarding the number of elements and/or nutrients analysed, the lowest number reported was six: energy, proteins, carbohydrates, lipids, SFA and fibre(Reference Bowen, Bharathi and Kinra53). Of the total number of studies, 23 (38·3 %) analysed 10–20 elements including energy(Reference Rodríguez, Fernández and Pastor1,Reference Martin-Moreno, Boyle and Gorgojo5,Reference Gnardellis, Trichopoulou and Katsouyanni12,Reference Willett, Reynolds and Cottrell-Hoehner13,Reference Mullie, Clarys and Hulens18–Reference Ramón, Micaló and Benítez22,Reference Schröder, Covas and Marrugat26–Reference Van Dongen, Lentjes and Wijckmans28,Reference Fidanza, Gentile and Porrini33,Reference Dehghan, del Cerro and Zhang37,Reference Nath and Huffman38,Reference Willet, Sampson and Stampfer42,Reference Denova-Gutiérrez, Ramírez-Silva and Rodríguez-Ramírez45,Reference Jackson, Walker and Cade48,Reference Lee, Lee and Wang50,Reference Park, Noh and Song58,Reference Whitton, Ho and Tay62,Reference Aoun, Daher and Osta63,Reference Fayet, Flood and Petocz65) , while 22 analysed 20–30(Reference Knudsen, Hatch and Cueto15,Reference Masson, MCNeill and Tomany16,Reference Roddam, Spencer and Banks23,Reference Babíc, Sindik and Missoni24,Reference Bonifacj, Gerber and Scali30,Reference Friis, Kjaer and Stripp35,Reference Rimm, Giovannucci and Stampfer39,Reference Shatenstein, Nadon and Godin41,Reference Sanjeevi, Freeland-Graves and George44,Reference Feskanich, Marshall and Rimm46,Reference Hernández-Avila, Romieu and Parra47,Reference Longnecker, Lissner and Holden51,Reference Macedo-Ojeda, Vizmanos-Lamotte and Márquez-Sandoval52,Reference Chen, Ahsan and Parvez54–Reference Ke, Toshiro and Fengyan57,Reference Sudha, Radhika and Sathya59,Reference Yang, Kim and Hwang61,Reference Beck, Houston and McNaughton68–Reference Gunes, Imeryuz and Akalin70) , although the same nutrients were not always counted in each study. The study which analysed the greatest number of elements (including energy) was Yuan et al. with 45(Reference Yuan, Spiegelman and Rimm43) (data not shown).
Of all the articles, thirty-seven were validated using food records as the standard of comparison(Reference Martin-Moreno, Boyle and Gorgojo5,Reference Willett, Reynolds and Cottrell-Hoehner13–Reference Mullie, Clarys and Hulens18,Reference Porrini, Gentile and Fidanza21–Reference Roddam, Spencer and Banks23,Reference Rothenberg25–Reference Tjønneland, Overvad and Haraldsdóttir27,Reference Gazan, Vieux and Darmon29–Reference Friis, Kjaer and Stripp35,Reference Nath and Huffman38,Reference Rimm, Giovannucci and Stampfer39,Reference Willet, Sampson and Stampfer42–Reference Sanjeevi, Freeland-Graves and George44,Reference Feskanich, Marshall and Rimm46,Reference Longnecker, Lissner and Holden51,Reference Macedo-Ojeda, Vizmanos-Lamotte and Márquez-Sandoval52,Reference Chen, Ahsan and Parvez54,Reference Jayawardena, Byrne and Soares56–Reference Park, Noh and Song58,Reference Tokudome, Imaeda and Tokudome60,Reference Yang, Kim and Hwang61,Reference Barrett and Gibson64,Reference Horwath66,Reference Smith, Mitchell and Reay67) , and among these, eleven employed food weighing(Reference Masson, MCNeill and Tomany16,Reference Tjønneland, Overvad and Haraldsdóttir27,Reference Dumartheray, Krieg and Cornuz31,Reference Fidanza, Gentile and Porrini33,Reference Fregapane and Asensio-García34,Reference Jayawardena, Byrne and Soares56,Reference Ke, Toshiro and Fengyan57,Reference Tokudome, Imaeda and Tokudome60,Reference Yang, Kim and Hwang61,Reference Smith, Mitchell and Reay67,Reference Beck, Houston and McNaughton68) . The fewest number of days reported when food records were used was three(Reference Schröder, Covas and Marrugat26,Reference Nath and Huffman38,Reference Sanjeevi, Freeland-Graves and George44,Reference Ke, Toshiro and Fengyan57,Reference Park, Noh and Song58) , while the greatest was 365(Reference Willett, Reynolds and Cottrell-Hoehner13). One study did not indicate a specific number of days during which records were used, reporting instead a 2–8 d range(Reference Longnecker, Lissner and Holden51). A total of twenty-three articles were validated by means of several 24-h recalls with intervals ranging from 1 to 16 d(Reference Gnardellis, Trichopoulou and Katsouyanni12,Reference Nöthlings, Hoffmann and Bergmann19,Reference Ocké, Bueno-de-Mesquita and Pols20,Reference Babíc, Sindik and Missoni24,Reference Van Dongen, Lentjes and Wijckmans28,Reference Dehghan, del Cerro and Zhang37,Reference Rodríguez, Méndez and Torún40,Reference Shatenstein, Nadon and Godin41,Reference Yuan, Spiegelman and Rimm43,Reference Denova-Gutiérrez, Ramírez-Silva and Rodríguez-Ramírez45,Reference Hernández-Avila, Romieu and Parra47–Reference Lee, Lee and Wang50,Reference Bowen, Bharathi and Kinra53,Reference Bijani, Esmaili and Ghadimi55,Reference Sudha, Radhika and Sathya59,Reference Whitton, Ho and Tay62,Reference Aoun, Daher and Osta63,Reference Fayet, Flood and Petocz65,Reference Zack, Irema and Kazonda69,Reference Gunes, Imeryuz and Akalin70) . Two of these articles lacked established ranges(Reference Dehghan, del Cerro and Zhang37,Reference Rodríguez, Méndez and Torún40) , and another reported different numbers of days over which 24-h recalls were administered to the same sample(Reference Yuan, Spiegelman and Rimm43) (Table 3).
Regarding the validity analysis, forty-one of the studies used Pearson’s correlation coefficients(Reference Martin-Moreno, Boyle and Gorgojo5,Reference Gnardellis, Trichopoulou and Katsouyanni12–Reference Knudsen, Hatch and Cueto15,Reference Moreira, Sampaio and Almeida17–Reference Ocké, Bueno-de-Mesquita and Pols20,Reference Ramón, Micaló and Benítez22–Reference Rothenberg25,Reference Tjønneland, Overvad and Haraldsdóttir27,Reference Van Dongen, Lentjes and Wijckmans28,Reference Bonifacj, Gerber and Scali30,Reference Dumartheray, Krieg and Cornuz31,Reference Friis, Kjaer and Stripp35–Reference Rodríguez, Méndez and Torún40,Reference Willet, Sampson and Stampfer42,Reference Sanjeevi, Freeland-Graves and George44–Reference Longnecker, Lissner and Holden51,Reference Chen, Ahsan and Parvez54–Reference Jayawardena, Byrne and Soares56,Reference Sudha, Radhika and Sathya59,Reference Yang, Kim and Hwang61,Reference Whitton, Ho and Tay62,Reference Fayet, Flood and Petocz65,Reference Horwath66,Reference Gunes, Imeryuz and Akalin70) , while nine used Spearman’s(Reference Porrini, Gentile and Fidanza21,Reference Gazan, Vieux and Darmon29,Reference Fidanza, Gentile and Porrini33,Reference Shatenstein, Nadon and Godin41,Reference Yuan, Spiegelman and Rimm43,Reference Bowen, Bharathi and Kinra53,Reference Park, Noh and Song58,Reference Barrett and Gibson64,Reference Beck, Houston and McNaughton68) . Both Pearson’s and Spearman’s coefficients were used in four articles(Reference Masson, MCNeill and Tomany16,Reference Ke, Toshiro and Fengyan57,Reference Tokudome, Imaeda and Tokudome60,Reference Smith, Mitchell and Reay67) . Three articles used intraclass and Pearson’s correlation coefficients(Reference Schröder, Covas and Marrugat26,Reference Fernández-Ballart, Piñol and Zazpe32,Reference Macedo-Ojeda, Vizmanos-Lamotte and Márquez-Sandoval52) , one used intraclass and Spearman’s(Reference Fregapane and Asensio-García34), another used Rosner’s and intraclass correlation coefficients(Reference Zack, Irema and Kazonda69), while other only mentioned using Pearson or Spearman’s correlation coefficient depending variables normality(Reference Aoun, Daher and Osta63) (Table 3).
Most correlation coefficients were adjusted by energy(Reference Martin-Moreno, Boyle and Gorgojo5,Reference Gnardellis, Trichopoulou and Katsouyanni12,Reference Knudsen, Hatch and Cueto15–Reference Ocké, Bueno-de-Mesquita and Pols20,Reference Ramón, Micaló and Benítez22,Reference Roddam, Spencer and Banks23,Reference Tjønneland, Overvad and Haraldsdóttir27–Reference Fidanza, Gentile and Porrini33,Reference Friis, Kjaer and Stripp35,Reference Dehghan, del Cerro and Zhang37–Reference Rodríguez, Méndez and Torún40,Reference Willet, Sampson and Stampfer42,Reference Yuan, Spiegelman and Rimm43,Reference Denova-Gutiérrez, Ramírez-Silva and Rodríguez-Ramírez45–Reference Jackson, Walker and Cade48,Reference Longnecker, Lissner and Holden51–Reference Chen, Ahsan and Parvez54,Reference Ke, Toshiro and Fengyan57,Reference Sudha, Radhika and Sathya59,Reference Tokudome, Imaeda and Tokudome60,Reference Aoun, Daher and Osta63–Reference Fayet, Flood and Petocz65,Reference Smith, Mitchell and Reay67–Reference Gunes, Imeryuz and Akalin70) . One study adjusted the coefficients by the participants’ sex(Reference Babíc, Sindik and Missoni24), another adjusted them by sex and age(Reference Kumanyika, Tell and Shemanski49), other was adjusted by ethnicity, age and sex(Reference Whitton, Ho and Tay62) and an additional study adjusted them by sex, energy and age(Reference Willett, Reynolds and Cottrell-Hoehner13). Twelve studies did not perform this coefficient adjustment(Reference Porrini, Gentile and Fidanza21,Reference Rothenberg25,Reference Schröder, Covas and Marrugat26,Reference Fregapane and Asensio-García34,Reference Grootenhuis, Westenbrink and Sie36,Reference Shatenstein, Nadon and Godin41,Reference Sanjeevi, Freeland-Graves and George44,Reference Lee, Lee and Wang50,Reference Bijani, Esmaili and Ghadimi55,Reference Jayawardena, Byrne and Soares56,Reference Park, Noh and Song58,Reference Horwath66) (Table 3).
In general, correlation coefficients for energy and nutrients ranged from −0·45(Reference Aoun, Daher and Osta63) to 1·00(Reference Nöthlings, Hoffmann and Bergmann19). Crude correlation coefficients ranged from −0·38(Reference Bijani, Esmaili and Ghadimi55) to 0·998(Reference Aoun, Daher and Osta63); crude and de-attenuated correlation coefficients ranged from −0·05(Reference Gnardellis, Trichopoulou and Katsouyanni12) to 0·98(Reference Nöthlings, Hoffmann and Bergmann19); adjusted values ranged from −0·45(Reference Masson, MCNeill and Tomany16) to 0·998(Reference Aoun, Daher and Osta63); and adjusted and de-attenuated values ranged from −0·03(Reference Zack, Irema and Kazonda69) to 1·00(Reference Nöthlings, Hoffmann and Bergmann19) (Table 3). For good groups, correlation coefficients ranged from −0·01(Reference Bijani, Esmaili and Ghadimi55) to 1·00(Reference Aoun, Daher and Osta63) (crude values).
In the case of correlation coefficients for energy and macronutrients (Table 4), we found that the lowest correlation coefficient was −0·34 for proteins(Reference Nath and Huffman38) (Pearson’s, adjusted), while the highest were 0·99(Reference Aoun, Daher and Osta63,Reference Fayet, Flood and Petocz65) (Pearson’s, adjusted and crudes) for proteins(Reference Aoun, Daher and Osta63,Reference Fayet, Flood and Petocz65) , also for carbohydrates(Reference Aoun, Daher and Osta63) and total fat(Reference Aoun, Daher and Osta63) (Pearson’s, crude). In the case of energy, correlation coefficient range was between 0·02(Reference Whitton, Ho and Tay62) (Pearson’s, adjusted) and 0·99(Reference Aoun, Daher and Osta63) (Pearson’s, or Spearman’s, crude).
Another important issue is related to the time interval between the repeated assessment of the reference method, and the time interval between the SFFQ and the comparison method. In nine studies, the SFFQ and the reference method were applied at the same time(Reference Ocké, Bueno-de-Mesquita and Pols20,Reference Tjønneland, Overvad and Haraldsdóttir27,Reference Fidanza, Gentile and Porrini33,Reference Dehghan, del Cerro and Zhang37,Reference Denova-Gutiérrez, Ramírez-Silva and Rodríguez-Ramírez45,Reference Hernández-Avila, Romieu and Parra47,Reference Kumanyika, Tell and Shemanski49,Reference Barrett and Gibson64,Reference Zack, Irema and Kazonda69) ; one study(Reference Knudsen, Hatch and Cueto15) gave less than a week; eight studies gave an interval of 1–2 weeks(Reference Masson, MCNeill and Tomany16,Reference Ramón, Micaló and Benítez22,Reference Bowen, Bharathi and Kinra53,Reference Ke, Toshiro and Fengyan57,Reference Tokudome, Imaeda and Tokudome60,Reference Aoun, Daher and Osta63,Reference Horwath66,Reference Gunes, Imeryuz and Akalin70) and other eight gave an interval of 1–2 months(Reference Rodríguez, Fernández and Pastor1,Reference Martin-Moreno, Boyle and Gorgojo5,Reference Willett, Reynolds and Cottrell-Hoehner13,Reference Klipstein-Grobusch, Den Breeijen and Goldbohm14,Reference Fernández-Ballart, Piñol and Zazpe32,Reference Yuan, Spiegelman and Rimm43,Reference Macedo-Ojeda, Vizmanos-Lamotte and Márquez-Sandoval52,Reference Whitton, Ho and Tay62) ; four gave more than 2 months between methods(Reference Roddam, Spencer and Banks23,Reference Willet, Sampson and Stampfer42,Reference Feskanich, Marshall and Rimm46,Reference Chen, Ahsan and Parvez54) , while three studies gave different time intervals(Reference Gnardellis, Trichopoulou and Katsouyanni12,Reference Schröder, Covas and Marrugat26,Reference Longnecker, Lissner and Holden51) . It is important to notice that the remaining twenty-seven studies do not report the time frame between SFFQ and reference method(Reference Moreira, Sampaio and Almeida17–Reference Nöthlings, Hoffmann and Bergmann19,Reference Porrini, Gentile and Fidanza21,Reference Babíc, Sindik and Missoni24,Reference Rothenberg25,Reference Van Dongen, Lentjes and Wijckmans28–Reference Dumartheray, Krieg and Cornuz31,Reference Fregapane and Asensio-García34–Reference Grootenhuis, Westenbrink and Sie36,Reference Nath and Huffman38,Reference Rimm, Giovannucci and Stampfer39,Reference Shatenstein, Nadon and Godin41,Reference Sanjeevi, Freeland-Graves and George44,Reference Jackson, Walker and Cade48,Reference Lee, Lee and Wang50,Reference Bijani, Esmaili and Ghadimi55,Reference Jayawardena, Byrne and Soares56,Reference Park, Noh and Song58,Reference Sudha, Radhika and Sathya59,Reference Yang, Kim and Hwang61,Reference Fayet, Flood and Petocz65,Reference Smith, Mitchell and Reay67,Reference Beck, Houston and McNaughton68) .
In the case of repeated assessments of the reference method, timelines were varied, but the most frequent was every 3 months or in each season(Reference Martin-Moreno, Boyle and Gorgojo5,Reference Bonifacj, Gerber and Scali30,Reference Fernández-Ballart, Piñol and Zazpe32,Reference Dehghan, del Cerro and Zhang37,Reference Willet, Sampson and Stampfer42,Reference Hernández-Avila, Romieu and Parra47,Reference Jackson, Walker and Cade48,Reference Longnecker, Lissner and Holden51,Reference Macedo-Ojeda, Vizmanos-Lamotte and Márquez-Sandoval52,Reference Park, Noh and Song58,Reference Tokudome, Imaeda and Tokudome60,Reference Yang, Kim and Hwang61,Reference Barrett and Gibson64,Reference Gunes, Imeryuz and Akalin70) or this was not described in the paper(Reference Knudsen, Hatch and Cueto15,Reference Masson, MCNeill and Tomany16,Reference Nöthlings, Hoffmann and Bergmann19,Reference Porrini, Gentile and Fidanza21,Reference Dumartheray, Krieg and Cornuz31,Reference Fregapane and Asensio-García34–Reference Grootenhuis, Westenbrink and Sie36,Reference Nath and Huffman38,Reference Shatenstein, Nadon and Godin41,Reference Sanjeevi, Freeland-Graves and George44,Reference Lee, Lee and Wang50,Reference Bijani, Esmaili and Ghadimi55–Reference Ke, Toshiro and Fengyan57) .
It is important to notice that the nutrients mentioned most frequently across studies, in addition to energy and macronutrients, were cholesterol, SFA, PUFA, fibre, vitamin C, Ca and Fe. PUFA had the lowest coefficient, which was −0·10(Reference Bijani, Esmaili and Ghadimi55) (Pearson’s, crude), while vitamin C showed the highest coefficient value of 0·98(Reference Aoun, Daher and Osta63) (Pearson’s, or Spearman’s, crude). These data are detailed in Supplemental Table 2 in the online supplementary material.
Reproducibility of the analysed semiquantitative FFQ
Of the sixty validation articles analysed, twenty-five included reproducibility analyses(Reference Martin-Moreno, Boyle and Gorgojo5,Reference Gnardellis, Trichopoulou and Katsouyanni12,Reference Klipstein-Grobusch, Den Breeijen and Goldbohm14,Reference Mullie, Clarys and Hulens18,Reference Ocké, Bueno-de-Mesquita and Pols20,Reference Roddam, Spencer and Banks23,Reference Schröder, Covas and Marrugat26,Reference Dumartheray, Krieg and Cornuz31,Reference Fernández-Ballart, Piñol and Zazpe32,Reference Friis, Kjaer and Stripp35,Reference Dehghan, del Cerro and Zhang37,Reference Rimm, Giovannucci and Stampfer39,Reference Willet, Sampson and Stampfer42–Reference Sanjeevi, Freeland-Graves and George44,Reference Hernández-Avila, Romieu and Parra47,Reference Jackson, Walker and Cade48,Reference Longnecker, Lissner and Holden51,Reference Macedo-Ojeda, Vizmanos-Lamotte and Márquez-Sandoval52,Reference Park, Noh and Song58,Reference Sudha, Radhika and Sathya59,Reference Whitton, Ho and Tay62–Reference Barrett and Gibson64,Reference Smith, Mitchell and Reay67) . Table 5 shows their characteristics.
Table 5 Reproducibility of the analysed semiquantitative FFQ (SFFQ), ordered chronologically

SFFQs, Semiquantitative food-frequency questionnaires; r, Pearson correlation coefficient; ND, Not described; R, Reproducible; GR, Good reproducibility; M, Men; W, Women; RA, Reasonably acceptable; σ, Spearman’s rank correlation coefficient; RR, Relatively reproducible; ER, Excellent reproducibility; U, Urban; R, Rural.
*Pearson’s correlation coefficient, unless otherwise noted.
†Performed on a larger sample of people; not the same n that were validated.
‡Kappa.
§Log-transformation.
‖For food groups.
¶Energy density method (divides the nutrient portion by total energy intake).
Most articles (thirteen of twenty-five) used an interval of 1 year to assess the reproducibility of the SFFQ(Reference Martin-Moreno, Boyle and Gorgojo5,Reference Gnardellis, Trichopoulou and Katsouyanni12,Reference Ocké, Bueno-de-Mesquita and Pols20,Reference Dumartheray, Krieg and Cornuz31,Reference Fernández-Ballart, Piñol and Zazpe32,Reference Friis, Kjaer and Stripp35,Reference Dehghan, del Cerro and Zhang37,Reference Rimm, Giovannucci and Stampfer39,Reference Willet, Sampson and Stampfer42,Reference Yuan, Spiegelman and Rimm43,Reference Hernández-Avila, Romieu and Parra47,Reference Macedo-Ojeda, Vizmanos-Lamotte and Márquez-Sandoval52,Reference Park, Noh and Song58,Reference Sudha, Radhika and Sathya59,Reference Barrett and Gibson64) . Four reported reproducibility for short- and long-term(Reference Ocké, Bueno-de-Mesquita and Pols20,Reference Dumartheray, Krieg and Cornuz31,Reference Jackson, Walker and Cade48,Reference Smith, Mitchell and Reay67) ; two set reproducibility for more than 1 year(Reference Klipstein-Grobusch, Den Breeijen and Goldbohm14,Reference Roddam, Spencer and Banks23) ; one mentioned a 6–12 month interval(Reference Longnecker, Lissner and Holden51); and others mention 6-(Reference Whitton, Ho and Tay62), 4-(Reference Aoun, Daher and Osta63) or 1-month interval(Reference Sanjeevi, Freeland-Graves and George44) or a less than 6-month interval(Reference Mullie, Clarys and Hulens18). One article did not specify the interval used, stating only that it was short-term(Reference Schröder, Covas and Marrugat26).
The twenty-five papers that included reproducibility analyses used correlation coefficients. Eight articles used only the Pearson’s correlation coefficient(Reference Martin-Moreno, Boyle and Gorgojo5,Reference Mullie, Clarys and Hulens18,Reference Ocké, Bueno-de-Mesquita and Pols20,Reference Roddam, Spencer and Banks23,Reference Dumartheray, Krieg and Cornuz31,Reference Friis, Kjaer and Stripp35,Reference Longnecker, Lissner and Holden51,Reference Sudha, Radhika and Sathya59) ; nine used only the intraclass correlation coefficient(Reference Gnardellis, Trichopoulou and Katsouyanni12,Reference Klipstein-Grobusch, Den Breeijen and Goldbohm14,Reference Rimm, Giovannucci and Stampfer39,Reference Yuan, Spiegelman and Rimm43,Reference Sanjeevi, Freeland-Graves and George44,Reference Hernández-Avila, Romieu and Parra47,Reference Whitton, Ho and Tay62–Reference Barrett and Gibson64) , and six articles reported correlation values for both coefficients(Reference Schröder, Covas and Marrugat26,Reference Fernández-Ballart, Piñol and Zazpe32,Reference Dehghan, del Cerro and Zhang37,Reference Willet, Sampson and Stampfer42,Reference Jackson, Walker and Cade48,Reference Macedo-Ojeda, Vizmanos-Lamotte and Márquez-Sandoval52) . Only one article used both Pearson’s and Spearman’s correlation coefficient(Reference Smith, Mitchell and Reay67); another used only Spearman’s correlation coefficient(Reference Park, Noh and Song58).
Uncorrected Pearson’s and Spearman’s correlation coefficients ranged from 0·16(Reference Dumartheray, Krieg and Cornuz31) to 0·96(Reference Smith, Mitchell and Reay67), while the adjusted values were from −0·02(Reference Dumartheray, Krieg and Cornuz31) to 0·94(Reference Ocké, Bueno-de-Mesquita and Pols20). Moreover, the unadjusted intraclass correlation coefficients ranged from 0·10(Reference Dehghan, del Cerro and Zhang37) to 0·99(Reference Aoun, Daher and Osta63), while adjusted values were from 0·25(Reference Hernández-Avila, Romieu and Parra47) to 0·91(Reference Yuan, Spiegelman and Rimm43).
The studies included the following reproducibility categories: ‘reasonably reproducible’(Reference Park, Noh and Song58,Reference Smith, Mitchell and Reay67) , ‘relatively reproducible’(Reference Mullie, Clarys and Hulens18,Reference Dehghan, del Cerro and Zhang37,Reference Jackson, Walker and Cade48,Reference Sudha, Radhika and Sathya59) , ‘reproducible’(Reference Gnardellis, Trichopoulou and Katsouyanni12,Reference Friis, Kjaer and Stripp35,Reference Rimm, Giovannucci and Stampfer39,Reference Hernández-Avila, Romieu and Parra47,Reference Macedo-Ojeda, Vizmanos-Lamotte and Márquez-Sandoval52,Reference Barrett and Gibson64) , ‘good level of reproducibility’(Reference Martin-Moreno, Boyle and Gorgojo5,Reference Fernández-Ballart, Piñol and Zazpe32,Reference Jackson, Walker and Cade48,Reference Whitton, Ho and Tay62) , ‘excellent reproducibility’(Reference Roddam, Spencer and Banks23,Reference Aoun, Daher and Osta63) and ‘reasonably acceptable’(Reference Sanjeevi, Freeland-Graves and George44). Seven articles presented correlation coefficients (although they are not stated textually) that can be considered as acceptable or good(Reference Klipstein-Grobusch, Den Breeijen and Goldbohm14,Reference Ocké, Bueno-de-Mesquita and Pols20,Reference Schröder, Covas and Marrugat26,Reference Dumartheray, Krieg and Cornuz31,Reference Willet, Sampson and Stampfer42,Reference Yuan, Spiegelman and Rimm43,Reference Longnecker, Lissner and Holden51) . The study by Jackson et al. (Reference Jackson, Walker and Cade48), which assesses both short- and long-term reproducibility, was classified as ‘relatively reproducible’ and as having a ‘good level of reproducibility’.
Other analyses
In addition to correlation coefficients, fifteen articles included Kappa analyses to assess the classification capacities of the tools(Reference Masson, MCNeill and Tomany16,Reference Roddam, Spencer and Banks23,Reference Gazan, Vieux and Darmon29,Reference Rodríguez, Méndez and Torún40,Reference Sanjeevi, Freeland-Graves and George44,Reference Denova-Gutiérrez, Ramírez-Silva and Rodríguez-Ramírez45,Reference Bowen, Bharathi and Kinra53,Reference Ke, Toshiro and Fengyan57,Reference Tokudome, Imaeda and Tokudome60,Reference Aoun, Daher and Osta63,Reference Barrett and Gibson64,Reference Smith, Mitchell and Reay67–Reference Gunes, Imeryuz and Akalin70) . Furthermore, Bland–Altman plots were included in twenty-one articles to assess agreement between methods(Reference Knudsen, Hatch and Cueto15,Reference Moreira, Sampaio and Almeida17,Reference Rothenberg25,Reference Van Dongen, Lentjes and Wijckmans28,Reference Dumartheray, Krieg and Cornuz31,Reference Fernández-Ballart, Piñol and Zazpe32,Reference Dehghan, del Cerro and Zhang37,Reference Rodríguez, Méndez and Torún40,Reference Yuan, Spiegelman and Rimm43,Reference Denova-Gutiérrez, Ramírez-Silva and Rodríguez-Ramírez45,Reference Macedo-Ojeda, Vizmanos-Lamotte and Márquez-Sandoval52,Reference Bowen, Bharathi and Kinra53,Reference Bijani, Esmaili and Ghadimi55,Reference Jayawardena, Byrne and Soares56,Reference Sudha, Radhika and Sathya59,Reference Aoun, Daher and Osta63–Reference Fayet, Flood and Petocz65,Reference Beck, Houston and McNaughton68–Reference Gunes, Imeryuz and Akalin70) . Ten of these confirmed an overestimation of the SFFQ with respect to the reference method: six used 24-h recalls(Reference Van Dongen, Lentjes and Wijckmans28,Reference Rodríguez, Méndez and Torún40,Reference Bowen, Bharathi and Kinra53,Reference Sudha, Radhika and Sathya59,Reference Aoun, Daher and Osta63,Reference Gunes, Imeryuz and Akalin70) and four dietary records(Reference Dumartheray, Krieg and Cornuz31,Reference Fernández-Ballart, Piñol and Zazpe32,Reference Macedo-Ojeda, Vizmanos-Lamotte and Márquez-Sandoval52,Reference Zack, Irema and Kazonda69) . The remaining studies did not show systematic errors for most nutrients(Reference Knudsen, Hatch and Cueto15,Reference Moreira, Sampaio and Almeida17,Reference Rothenberg25,Reference Dehghan, del Cerro and Zhang37,Reference Yuan, Spiegelman and Rimm43,Reference Denova-Gutiérrez, Ramírez-Silva and Rodríguez-Ramírez45,Reference Bijani, Esmaili and Ghadimi55,Reference Jayawardena, Byrne and Soares56,Reference Barrett and Gibson64,Reference Fayet, Flood and Petocz65,Reference Beck, Houston and McNaughton68) . For more details, see Supplemental Table 1b in the online supplementary material.
Discussion
The main objective of this review is to provide detailed data on the validation of SFFQ. A total of sixty SFFQ that met the selection criteria were found from several geographical regions. Europe is the region with the highest number of published studies (n 25)(Reference Martin-Moreno, Boyle and Gorgojo5,Reference Gnardellis, Trichopoulou and Katsouyanni12,Reference Klipstein-Grobusch, Den Breeijen and Goldbohm14–Reference Grootenhuis, Westenbrink and Sie36) , while the number of studies from Latin America(Reference Dehghan, del Cerro and Zhang37,Reference Rodríguez, Méndez and Torún40,Reference Denova-Gutiérrez, Ramírez-Silva and Rodríguez-Ramírez45,Reference Hernández-Avila, Romieu and Parra47,Reference Macedo-Ojeda, Vizmanos-Lamotte and Márquez-Sandoval52) has increased significantly in recent years. These data may indicate that the number of epidemiological assessments of diet in Latin America has probably increased recently since food-related health problems have become more prevalent in that region.
More than half of the studies (81·1 %) included male and female subjects. Some authors had specific reasons for selecting subjects of only one sex. For example, Willett et al. (Reference Willet, Sampson and Stampfer42) selected women because their study targeted female nurses; in the case of SFFQ administered only to men(Reference Mullie, Clarys and Hulens18,Reference Rimm, Giovannucci and Stampfer39,Reference Feskanich, Marshall and Rimm46) , no reasons were given for this exclusive selection, with the exception of the study on male health professionals(Reference Rimm, Giovannucci and Stampfer39).
Regarding age, the broadest age ranges were reported in the studies by Gazan et al. (Reference Gazan, Vieux and Darmon29) and Shatenstein et al. (Reference Shatenstein, Nadon and Godin41). The latter had the broadest range, with 64 years of difference between the lowest and highest values. The existence of such a broad age range in the SFFQ validation process supports the administration of this questionnaire to older adults and younger populations. Notice that it was decided to include articles with minimum ages below 18 years because the mean age was not influenced by these values(Reference Ramón, Micaló and Benítez22,Reference Chen, Ahsan and Parvez54,Reference Beck, Houston and McNaughton68) .
Significant correlations were found regarding the analyses carried out for the validation of the SFFQ in the reviewed papers. Most of the studies used Pearson’s coefficients (68 %)(Reference Martin-Moreno, Boyle and Gorgojo5,Reference Gnardellis, Trichopoulou and Katsouyanni12–Reference Knudsen, Hatch and Cueto15,Reference Moreira, Sampaio and Almeida17–Reference Ocké, Bueno-de-Mesquita and Pols20,Reference Ramón, Micaló and Benítez22–Reference Rothenberg25,Reference Tjønneland, Overvad and Haraldsdóttir27,Reference Van Dongen, Lentjes and Wijckmans28,Reference Bonifacj, Gerber and Scali30,Reference Dumartheray, Krieg and Cornuz31,Reference Friis, Kjaer and Stripp35–Reference Rodríguez, Méndez and Torún40,Reference Willet, Sampson and Stampfer42,Reference Sanjeevi, Freeland-Graves and George44–Reference Longnecker, Lissner and Holden51,Reference Chen, Ahsan and Parvez54–Reference Jayawardena, Byrne and Soares56,Reference Sudha, Radhika and Sathya59,Reference Yang, Kim and Hwang61,Reference Whitton, Ho and Tay62,Reference Fayet, Flood and Petocz65,Reference Horwath66,Reference Gunes, Imeryuz and Akalin70) . However, no consensus has been found in the literature concerning which statistical method is most suitable for assessing the validity of dietary tools(Reference Masson, MCNeill and Tomany16).
The Pearson’s (r) and Spearman’s (ρ) correlation coefficients measure the degree of linear association between two variables, the former being more suitable for normal distribution and the latter for non-normal distribution. However, neither of these coefficients provides information about the degree of agreement observed, nor about the presence of systematic differences between measurements or instruments(Reference Martínez, Tuya and Martínez71–Reference Martínez-González, Toledo, Sánchez-Villegas, Martínez-González, Sánchez-Villegas and Toledo-Atucha74). The intraclass correlation coefficient is usually used for this purpose in reproducibility studies(Reference Cortés-Reyes, Rubio-Romero and Gaitán-Duarte72,Reference Martínez-González, Toledo, Sánchez-Villegas, Martínez-González, Sánchez-Villegas and Toledo-Atucha74,Reference Pita and Pértegas75) . However, it has been proposed as an alternative method to evaluate the agreement observed between methods in validation studies(Reference Fernández-Ballart, Piñol and Zazpe32,Reference Macedo-Ojeda, Vizmanos-Lamotte and Márquez-Sandoval52,Reference Cade, Thompson and Burley76) . Taking these observations into consideration, it is suggested that validation studies include, in addition to the mean values of each method, the Pearson’s or Spearman’s correlation coefficients and, if desired, the intraclass correlation coefficient.
Regarding the interpretation of the correlation coefficients, Landis and Koch’s(Reference Jayawardena, Byrne and Soares56) classification for the Kappa (κ) coefficient has been often used for this purpose. This classification is broken down as follows: 0 = poor agreement; 0·01–0·20 = slight agreement; 0·21–0·40 = fair agreement; 0·41–0·60 = moderate agreement; 0·61–0·80 = substantial agreement; 0·81–1·00 = almost perfect agreement. Other authors have suggested the following classification: 0 = none existent; r < 0·3 = poor; 0·30–0·70 = moderate; r > 0·70 = strong(Reference Sánchez-Villegas, Martínez-González, Martínez-González, Sánchez-Villegas and Toledo-Atucha77). The correlation coefficients in the reviewed studies suggest that validation may be possible, although the results of the same could vary from poor to excellent.
It should be noted that analyses adjusted by energy, sex or age may be added to the crude correlation analyses. The reason for the inclusion of these analyses is that nutritional consumption may be higher or lower depending on the dependent variable (e.g. energy). Most of the included studies adjust their analysis in accordance with energy consumption using the residual method(Reference Martin-Moreno, Boyle and Gorgojo5,Reference Gnardellis, Trichopoulou and Katsouyanni12,Reference Knudsen, Hatch and Cueto15–Reference Ocké, Bueno-de-Mesquita and Pols20,Reference Ramón, Micaló and Benítez22,Reference Roddam, Spencer and Banks23,Reference Tjønneland, Overvad and Haraldsdóttir27,Reference Van Dongen, Lentjes and Wijckmans28,Reference Bonifacj, Gerber and Scali30–Reference Fidanza, Gentile and Porrini33,Reference Friis, Kjaer and Stripp35,Reference Dehghan, del Cerro and Zhang37–Reference Rodríguez, Méndez and Torún40,Reference Willet, Sampson and Stampfer42,Reference Yuan, Spiegelman and Rimm43,Reference Denova-Gutiérrez, Ramírez-Silva and Rodríguez-Ramírez45–Reference Jackson, Walker and Cade48,Reference Longnecker, Lissner and Holden51–Reference Chen, Ahsan and Parvez54,Reference Ke, Toshiro and Fengyan57,Reference Sudha, Radhika and Sathya59,Reference Tokudome, Imaeda and Tokudome60,Reference Barrett and Gibson64,Reference Fayet, Flood and Petocz65,Reference Smith, Mitchell and Reay67,Reference Gunes, Imeryuz and Akalin70) . Another common practice is to convert the correlation coefficients into logarithmic scales. This is done for two main purposes: to improve the normality of the distribution of variables and to simplify the interpretation of correlation values of 0(Reference Denova-Gutiérrez, Ramírez-Silva and Rodríguez-Ramírez45). Almost half of the included studies make this modification(Reference Martin-Moreno, Boyle and Gorgojo5,Reference Gnardellis, Trichopoulou and Katsouyanni12,Reference Willett, Reynolds and Cottrell-Hoehner13,Reference Masson, MCNeill and Tomany16,Reference Ocké, Bueno-de-Mesquita and Pols20,Reference Ramón, Micaló and Benítez22,Reference Bonifacj, Gerber and Scali30,Reference Dumartheray, Krieg and Cornuz31,Reference Friis, Kjaer and Stripp35,Reference Dehghan, del Cerro and Zhang37,Reference Rimm, Giovannucci and Stampfer39,Reference Willet, Sampson and Stampfer42,Reference Denova-Gutiérrez, Ramírez-Silva and Rodríguez-Ramírez45–Reference Jackson, Walker and Cade48,Reference Longnecker, Lissner and Holden51–Reference Chen, Ahsan and Parvez54,Reference Ke, Toshiro and Fengyan57,Reference Sudha, Radhika and Sathya59,Reference Tokudome, Imaeda and Tokudome60,Reference Fayet, Flood and Petocz65,Reference Gunes, Imeryuz and Akalin70) .
In addition to the adjustment for energy, daily variations in the intake of each person (random within-person error) may affect the relationship between the actual and observed nutrient intake. A random within-person error may be due either to real variations in the intake or to intake measurement errors. This type of error tends to attenuate or decrease the regression coefficients between SFFQ and reference methods (dietary records or recalls) towards zero (decrease in the strength of the association)(Reference Willett3), which is why many authors present de-attenuated correlation analyses based on either unadjusted(Reference Gnardellis, Trichopoulou and Katsouyanni12,Reference Nöthlings, Hoffmann and Bergmann19,Reference Dehghan, del Cerro and Zhang37,Reference Rodríguez, Méndez and Torún40,Reference Gunes, Imeryuz and Akalin70) or adjusted coefficients(Reference Martin-Moreno, Boyle and Gorgojo5,Reference Klipstein-Grobusch, Den Breeijen and Goldbohm14,Reference Knudsen, Hatch and Cueto15,Reference Nöthlings, Hoffmann and Bergmann19,Reference Ocké, Bueno-de-Mesquita and Pols20,Reference Bonifacj, Gerber and Scali30,Reference Friis, Kjaer and Stripp35,Reference Rodríguez, Méndez and Torún40,Reference Yuan, Spiegelman and Rimm43,Reference Denova-Gutiérrez, Ramírez-Silva and Rodríguez-Ramírez45,Reference Feskanich, Marshall and Rimm46,Reference Macedo-Ojeda, Vizmanos-Lamotte and Márquez-Sandoval52–Reference Chen, Ahsan and Parvez54,Reference Sudha, Radhika and Sathya59–Reference Yang, Kim and Hwang61,Reference Fayet, Flood and Petocz65,Reference Zack, Irema and Kazonda69) .
The correlation coefficients used for the validity analyses can vary due to a range of criteria. Regarding the number of items, high variability was found among SFFQ validation studies. However, we did not formally evaluate the correlation between the number of items and validity correlations because of the different populations and the different comparison methods and nutrients that were assessed. The literature associates the more stable reliability of the SFFQ(Reference Wakai78) and higher correlation coefficients(Reference Cade, Burley and Warm79) with their greater number of items, even though this association was not reflected in this review. However, SFFQ with greater numbers of items can be tedious and tiring to answer (which may lead to bias), and having them administered by qualified interviewers may entail a considerable investment of time and money. Ultimately, it is important to keep in mind that the number of items will depend on the purpose of the questionnaire(Reference Willett3).
About the number of participants, variability between studies and variations in correlation coefficients were also observed. This trend is evident in the study by Nath and Huffman(Reference Nath and Huffman38) in which, probably because of the small number of participants, the coefficient ranges were −0·18 to 0·71 (unadjusted) and −0·34 to 0·55 (adjusted).
Another point of interest regarding SFFQ validation process is the way they are administered. In this review, twenty-two studies state that their questionnaires were administered by an interviewer(Reference Rodríguez, Fernández and Pastor1,Reference Moreira, Sampaio and Almeida17,Reference Ramón, Micaló and Benítez22,Reference Rothenberg25,Reference Dehghan, del Cerro and Zhang37,Reference Willet, Sampson and Stampfer42,Reference Sanjeevi, Freeland-Graves and George44,Reference Denova-Gutiérrez, Ramírez-Silva and Rodríguez-Ramírez45,Reference Jackson, Walker and Cade48–Reference Lee, Lee and Wang50,Reference Macedo-Ojeda, Vizmanos-Lamotte and Márquez-Sandoval52–Reference Chen, Ahsan and Parvez54,Reference Jayawardena, Byrne and Soares56,Reference Sudha, Radhika and Sathya59,Reference Yang, Kim and Hwang61–Reference Aoun, Daher and Osta63,Reference Beck, Houston and McNaughton68–Reference Gunes, Imeryuz and Akalin70) . The advantage of having questionnaires administered by qualified interviewers is the assurance that they will be completed correctly(Reference Willett3,Reference Cade, Burley and Warm79) . When budgetary constraints prohibit hiring specialists to administer questionnaires, self-administration may be a viable alternative. Nonetheless, while self-administration saves costs associated with having someone on hand to explain how to complete the survey, it may entail a greater risk of bias if participants are not adequately informed of the procedures they should follow(Reference Cade, Burley and Warm79).
Some SFFQ include visual support material to facilitate the estimation of participants’ food intake(Reference Gnardellis, Trichopoulou and Katsouyanni12,Reference Willett, Reynolds and Cottrell-Hoehner13,Reference Knudsen, Hatch and Cueto15–Reference Moreira, Sampaio and Almeida17,Reference Ocké, Bueno-de-Mesquita and Pols20,Reference Babíc, Sindik and Missoni24,Reference Rothenberg25,Reference Tjønneland, Overvad and Haraldsdóttir27,Reference Van Dongen, Lentjes and Wijckmans28,Reference Fidanza, Gentile and Porrini33,Reference Shatenstein, Nadon and Godin41,Reference Jackson, Walker and Cade48–Reference Lee, Lee and Wang50,Reference Bowen, Bharathi and Kinra53–Reference Jayawardena, Byrne and Soares56,Reference Park, Noh and Song58,Reference Sudha, Radhika and Sathya59,Reference Yang, Kim and Hwang61–Reference Aoun, Daher and Osta63,Reference Horwath66,Reference Zack, Irema and Kazonda69,Reference Gunes, Imeryuz and Akalin70) . However, this practice has not been clearly associated with higher correlation coefficients. Some studies(Reference Martin-Moreno, Boyle and Gorgojo5,Reference Gnardellis, Trichopoulou and Katsouyanni12,Reference Ocké, Bueno-de-Mesquita and Pols20,Reference Roddam, Spencer and Banks23,Reference Schröder, Covas and Marrugat26,Reference Van Dongen, Lentjes and Wijckmans28,Reference Dumartheray, Krieg and Cornuz31,Reference Fernández-Ballart, Piñol and Zazpe32,Reference Dehghan, del Cerro and Zhang37,Reference Willet, Sampson and Stampfer42,Reference Yuan, Spiegelman and Rimm43,Reference Jackson, Walker and Cade48–Reference Lee, Lee and Wang50,Reference Macedo-Ojeda, Vizmanos-Lamotte and Márquez-Sandoval52–Reference Bijani, Esmaili and Ghadimi55,Reference Park, Noh and Song58,Reference Sudha, Radhika and Sathya59,Reference Barrett and Gibson64,Reference Beck, Houston and McNaughton68) mention purposes for which their SFFQ had been previously used, such as epidemiological studies of diabetes mellitus(Reference Jackson, Walker and Cade48) or cancer(Reference Martin-Moreno, Boyle and Gorgojo5,Reference Gnardellis, Trichopoulou and Katsouyanni12,Reference Ocké, Bueno-de-Mesquita and Pols20,Reference Willet, Sampson and Stampfer42,Reference Park, Noh and Song58) .
For validation purposes, in addition to correlation coefficients, Kappa analyses or Bland–Altman plots are usually used. The classification capacities of the tools can be analysed by comparing, through Kappa analyses and contingency tables, the concordance or agreement within the distribution by tertiles, quartiles or quintiles. Results can be reported as an exact agreement (classified in the same category by both methods), plus or minus one category, and gross misclassification(Reference Cade, Thompson and Burley76). The main advantage of this kind of analysis is that with cross-classification, the percentages misclassified clearly illustrate the likely impact of measurement error. It has been established that 50 % of subjects correctly classified and <10 % of subjects grossly misclassified into thirds, and weighted kappa values above 0·4 are desirable for nutrients of interest(Reference Masson, MCNeill and Tomany16). However, this is difficult to achieve, since only six studies from the fifteen reporting kappa analyses(Reference Rodríguez, Fernández and Pastor1,Reference Masson, MCNeill and Tomany16,Reference Gazan, Vieux and Darmon29,Reference Denova-Gutiérrez, Ramírez-Silva and Rodríguez-Ramírez45,Reference Aoun, Daher and Osta63,Reference Barrett and Gibson64) report a median or most of subjects with a 50 % or more of correct classification, three report a correct classification between 42 and 49 %, two do not report agreement in percentage(Reference Roddam, Spencer and Banks23,Reference Aoun, Daher and Osta63) and four report a lower level of agreement(Reference Smith, Mitchell and Reay67–Reference Gunes, Imeryuz and Akalin70).
By the other hand, Bland–Altman charts graphically assess agreement between the methods, displaying the under- or over-estimate of the method to be validated and identifying the possible presence of bias in the estimate. They have the advantage of not being influenced by variations from one person to another(Reference Cade, Thompson and Burley76,Reference Serra-Majem, Frost Andersen and Henríque-Sánchez80) . In total, almost half of the studies reporting Bland–Altman charts (11 of 21) did not show systematic errors for most nutrients(Reference Knudsen, Hatch and Cueto15,Reference Moreira, Sampaio and Almeida17,Reference Rothenberg25,Reference Dehghan, del Cerro and Zhang37,Reference Yuan, Spiegelman and Rimm43,Reference Denova-Gutiérrez, Ramírez-Silva and Rodríguez-Ramírez45,Reference Bijani, Esmaili and Ghadimi55,Reference Jayawardena, Byrne and Soares56,Reference Barrett and Gibson64,Reference Fayet, Flood and Petocz65,Reference Beck, Houston and McNaughton68) and the others confirmed an overestimation of the SFFQ with respect to the reference method.
Other authors have carried out other literature reviews on a SFFQ creation or validation process. For example, Cade et al. (Reference Cade, Thompson and Burley76,Reference Cade, Burley and Warm79) conducted an electronic database search for English-language papers on the creation, validation and administration of SFFQ from 1980 to 1999, from which they published two papers: a non-systematic review(Reference Cade, Thompson and Burley76) and a semi-systematic review(Reference Cade, Burley and Warm79). At the end of each paper, they present general recommendations regarding the design, validation and administration of SFFQ. Similarly, Wakai(Reference Wakai78) conducted another literature review to identify articles in which SFFQ were developed and/or validated exclusively for the Japanese population. The main difference between these three studies and ours is that we performed a systematic review using PRISMA statement criteria; moreover, Wakai focused only in studies for Japanese population, while we included all the published studies that met inclusion criteria, regardless of the country.
Based on the analysis of previous proposals(Reference Willett3,Reference Cade, Thompson and Burley76,Reference Serra-Majem, Frost Andersen and Henríque-Sánchez80,Reference Dennis, Snetselaar and Nothwehr81) and our observations, and taking into consideration that the essential reason to validate an instrument is to confirm that it evaluates variables adequately, we recommend taking into consideration specific elements to validate SFFQ that were designed to evaluate global food intake in adults, such as the number of items; the number and sex of participants for validation; administration of the SFFQ (interview or self-reporting); seasonal fluctuations in dietary intake; visual support material for use during questionnaire administration; number of applications of the reference method (dietary records or 24-h recalls); unit of analysis: energy, nutrients and food groups; the use of unadjusted, adjusted and de-attenuated correlation coefficients for the validity analysis (depending on whether the distribution of variables is normal); the Bland–Altman plots; a reproducibility analysis between questionnaire administrations; identification of the statistical package used to perform statistical analyses; and identification of the software used to perform the nutritional analysis.
Finally, we note that when SFFQ validation studies are conducted, validity results are not always favourable for all nutrients or food groups evaluated. Ideally, improvements should be made to these SFFQ, after which they should be revalidated. At least, the limitations of these instruments should be acknowledged, and their results should be interpreted with caution. However, we believe that following the recommendations regarding the limitations of other studies and those we have discussed here will lead to better validation results.
Among the strengths of our study are the inclusion of questionnaires produced in several geographical regions and continents, and that its search period was not limited. Hence, our results include papers that are among the oldest available in the database up to those published as late as January 2020. Furthermore, we have included articles written in English, Portuguese, French and Spanish that were found using systematic search processes. We also extracted data directly from tables to prevent data omission. The scoring system we used is intended to help researchers select those SFFQ that would be the most complete and suitable for the objectives and target populations of their studies.
However, our review also has limitations. One of these is that PubMed was the only search engine used, thus resulting in the exclusion of relevant papers not retrievable through it. We nonetheless decided to only include articles found in PubMed because it is a proven source of articles from highly regarded scientific journals. Also, it may be questionable to have included studies validated only against dietary assessment tools and not studies focused on nutrients for which there might be unbiased biomarkers such as urinary potassium, urinary nitrogen (proteins) and doubly labelled water (energy). However, biomarkers have limitations, which include the fact that recovery markers (those that refer to a measure of absolute intake per 24 h) are not available for most nutrients and may, therefore, provide limited information. Therefore, we consider that biomarkers may be more suitable in studies focused on specific nutrients and not on the general diet, as in our study.
As future perspectives, the creation and validation of new food-frequency consumption questionnaires are justified, since we are living in the personalised nutrition era. Having specific tools for diverse population groups and diverse purposes will support research and application of new knowledge. Besides, it is desirable that these questionnaires not only focus on assessing food but also processed or prepared products, to not limiting existing evidence between food/nutrition and health risks.
Conclusions
The characteristics of and validation processes for different SFFQ can vary substantially, even within individual countries. Therefore, the composite components of SFFQ should be carefully reviewed when being selected. Having described the parameters of and results from different validations, we conclude that even in cases where all SFFQ are reported as validated, their coefficients may vary. The results of this analysis show that even in cases where correlation coefficients range from poor to excellent, validation may still be feasible provided that overall results are interpreted with caution.
Acknowledgements
Acknowledgements: The authors would like to thank Joan D. Fernandez Ballart for his support in aspects related to statistical analyses. The authors would also like to acknowledge Robert Kimpleton for his support in English redaction style contributions. Financial support: This research received no specific grant from any funding agency, commercial or not-for-profit sectors. Conflict of interest: None. Authorship: E.S.-R., G.M.-O. and B.V. formulated the research question and developed the study design. E.S.-R., M.F.B.-O. and B.V. participated in data acquisition. All authors participated in data analysis and interpretation, writing the article and approving it. Ethics of human subject participation: Not applicable.
Supplementary material
For supplementary material accompanying this paper visit https://doi.org/10.1017/S1368980020001834.


 Open access