Obesity is considered a multifactorial condition(Reference Malik, Willett and Hu1) that predisposes the individual to the development of several diseases, including CVD, type 2 diabetes and some types of cancer(Reference Malik, Willett and Hu1, Reference Nguyen and Lau2). However, it has been found that not all obese individuals develop these disorders, as well as that some normal-weight individuals have an unfavourable cardiometabolic profile(Reference Mirzaei, Abdi and Serahati3). Thus, there are probably other determinants of obesity-related complications, in addition to overweight(Reference Karelis, St-Pierre and Conus4).
BMI is the most commonly used diagnostic measure in the identification of obesity in population studies and clinical practice(Reference Lu and Hajifathalian5). However, as previously stated, a portion of individuals who are in the BMI range considered adequate have metabolic disorders characteristic of obese individuals(Reference Mirzaei, Abdi and Serahati3). These individuals, according to the literature, have the phenotype called ‘metabolically unhealthy normal weight’(Reference Ruderman, Chisholm and Pi-Sunyer6, Reference Wildman, Muntner and Reynolds7), with early signs of insulin resistance, dyslipidaemia and hypertension. The main implication related to this group is that since individuals are classified as normal weight and thus apparently healthy, metabolic changes are detected late and therefore are not properly treated.
On the other hand, overweight/obese individuals showing no metabolic changes(Reference Mirzaei, Abdi and Serahati3) are classified as ‘metabolically healthy overweight’ phenotype(Reference Wildman, Muntner and Reynolds7). Nevertheless, recent evidence indicates that this condition may be transient, since follow-ups over a longer period have shown the progression to a metabolically unhealthy phenotype(Reference Hwang, Hayashi and Fujimoto8–Reference Kabat, Wu and Bea11). In addition, ‘metabolically healthy overweight’ is not a totally benign condition since it has been demonstrated that individuals with this phenotype are at a higher risk of developing type 2 diabetes and CVD in relation to normal-weight and metabolically healthy individuals(Reference Aung, Lorenzo and Hinojosa12).
Although the identification of individuals belonging to each of the phenotypes is essential for the most appropriate therapy to be adopted(Reference Phillips, Dillon and Harrington13), the application of the same is hampered by the absence of an internationally standardized definition(Reference Du, Yu and Zhang14). The most commonly adopted definitions in the literature use a set of unfavourable metabolic condition markers, such TAG, HDL-cholesterol (HDL-C), total cholesterol, glycaemia, homeostatic model assessment of insulin resistance (HOMA-IR), blood pressure, waist circumference (WC) and ultra-sensitive C-reactive protein (us-CRP), which may hamper its wider use in clinical practice. Thus, finding an index to accurately identify the unhealthy metabolic phenotype with fewer markers is crucial. Another important aspect is that these different definitions take no account of specific markers of visceral adipose tissue accumulation, which has been pointed out as one of the main causes of the metabolic deterioration of individuals(Reference Hwang, Hayashi and Fujimoto8, Reference Samocha-Bonet, Dixit and Kahn15). Considering that the direct measurement of this tissue requires the use of expensive imaging techniques that are not feasible in the context of public health, alternative measures that estimate visceral adiposity must be investigated.
In this context, the visceral adiposity index (VAI) has been described as a useful indicator of the visceral fat function associated with cardiometabolic risk(Reference Amato, Giordano and Galia16), since it requires no expensive technique for its calculation. VAI is a sex-specific index based on anthropometric (BMI and WC) and lipid (TAG and HDL-C levels) parameters, which was developed from an adult population without associated diseases(Reference Amato, Giordano and Galia16). It was validated as a simple replacement marker of visceral adiposity and adipose dysfunction obtained by MRI(Reference Amato, Giordano and Galia16). Therefore, its use in the identification of the unhealthy metabolic phenotype may represent an interesting alternative.
However, to the best of our knowledge, no study has so far evaluated the predictive capacity of VAI for identifying the unhealthy metabolic phenotype comparing normal-weight and overweight individuals. In addition, no population-based studies have been found that surveyed the prevalence of different obesity phenotypes in the Brazilian population.
Thus, the present study aimed to verify whether VAI is an effective predictor in identifying unhealthy metabolic phenotype between normal-weight and overweight individuals and compared it with traditional indicators of obesity in a representative sample of Brazilian adults.
Methodology
Study design and participants
The present study is a cross-sectional, population-based study on health conditions of a representative sample of the adult population in Viçosa, Minas Gerais, Brazil, conducted from 2012 to 2014. Details of the study procedures are described in Segheto et al.(Reference Segheto, Silva and Coelho17).
The study included adult individuals aged 20–59 years of both sexes and residing in the urban area of the city. For the sample calculation, we adopted the following parameters: estimated population of 43 431 individuals, confidence level of 95 %, expected prevalence of 50 % (multiple outcomes)(Reference Barbosa, Pereira and da Cruz18) and sample error of 4·5 %. In addition, a design effect of 1·6 and adding 10 % for losses and refusals and 10 % to control confounding factors were applied. The sample size was estimated as 901 individuals.
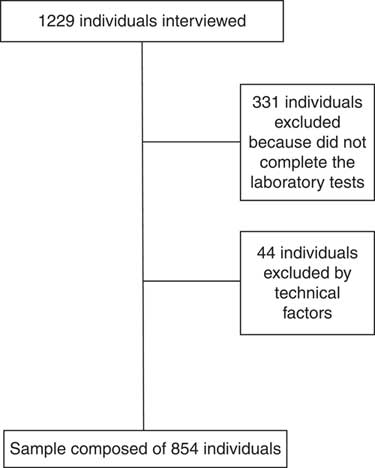
Probabilistic sampling was used without replacement, by double-stage sampling (census and domicile), and 1229 household interviews were carried out. Of the total number of interviewees, 331 individuals did not complete the laboratory tests and forty-four had serum TAG ≥ 279 mg/dl and/or BMI ≥ 40·0 kg/m2, who were excluded from the study as recommended by the literature for VAI calculation(Reference Amato and Giordano19). Thus, the final sample of the present study was composed of 854 individuals (Fig. 1). No significant statistical difference was found for sociodemographic characteristics between the original sample and the one used in the study (data not shown).

Fig. 1 Flowchart of participant selection
Measurements
Biochemical parameters
Blood samples were collected by venepuncture using the Vacutainer system (Becton Dickinson, Plymouth, UK) after 12 h of fasting. Fasting glucose was determined by the enzymatic glucose-oxidase method. TAG and HDL-C concentrations were measured by the enzymatic colorimetric method. Plasma insulin was determined by ELISA, using the Human Insulin ELISA Kit (Linco Research®, St. Charles, MO, USA). Insulin resistance was estimated by the homeostatic model assessment: HOMA-IR = [fasting insulin (μU/ml) × fasting glucose (mmol/l)]/22·5(Reference Matthews, Hosker and Rudenski20). us-CRP was determined by the immunoturbidimetric assay (Bioclin®, Quimbasa Quimica Básica, Belo Horizonte, MG, Brazil).
Anthropometric parameters and body composition
Weight was measured with an electronic digital scale (TANITA® model Ironman BC-554, Tokyo, Japan), certified by Inmetro, with a capacity of 150 kg and a precision of 100 g. Height was measured using a fixed stem stadiometer, coupled to the wall without a footboard (WELMY®, Santa Bárbara D’Oeste, SP, Brazil), with 2·5 m extension and 0·1 cm resolution. BMI was calculated as weight (in kilograms) divided by the square of the height (in metres)(21). WC was measured in centimetres with an inelastic measuring tape (Sanny®, São Paulo, SP, Brazil) at the midpoint between the last rib and the iliac crest, at the end of a normal exhalation. Waist-to-hip ratio (WHR) was calculated as the ratio between WC and hip circumference measured at the maximal gluteal protuberance(21). Waist-to-height ratio (WHtR) was calculated as the ratio between WC and height(Reference Ashwell and Hsieh22). Neck circumference (NC) was measured in centimetres, just below the laryngeal prominence, with individuals standing and their head positioned in the Frankfurt plane(Reference Ben-noun, Sohar and Laor23), using a flexible and inelastic metric tape (Sanny®, São Paulo, SP, Brazil). All anthropometric measurements were performed in triplicate by one experienced examiner, considering the average values. VAI was calculated using sex-specific formulas(Reference Amato, Giordano and Galia16): VAI, males = [WC/39·68 + (1·88 × BMI)] × (TAG/1·03) × (1·31/HDL-C) and VAI, females = [WC/36·58 + (1·89 × BMI)] × (TAG/0·81) × (1·52/HDL-C), with TAG and HDL-C levels expressed as mmol/l.
Female body composition was estimated by the triceps, abdomen and suprailiac skinfolds, and male body composition by triceps, pectoral and subscapular skinfolds. Skinfold data were used in sex-specific equations to calculate body density(Reference Jackson, Pollock and Ward24, Reference Jackson and Pollock25), then the fat percentage was estimated by the Siri equation(Reference Siri26). The skinfolds were measured using a Lange® calliper (Beta Technology Incorporated, Cambridge, MA, USA) with 1 mm precision.
Clinical parameters
Systolic blood pressure (SBP) and diastolic blood pressure (DBP) were measured in duplicate using an automatic insufflation blood pressure monitor (OMRON® model HEM-741 CINT, Tokyo, Japan), calibrated and certified by Inmetro. The first measure was obtained after 5 min rest and the second 15 min after the first measurement. The mean of the two measurements was considered for analysis.
Leisure-time physical activity and energy intake
The leisure-time physical activity (LTPA) was evaluated by the International Physical Activity Questionnaire (IPAQ), long form, using the fourth domain. LTPA was calculated by adding the time spent in moderate physical and walking activities plus twice the time spent in vigorous activities(Reference Haskell, Lee and Pate27).
The participants’ energy intake was estimated using an FFQ previously validated for the population(Reference da Silva, Segheto and de Lima28).
Definition of phenotypes
The sample was categorized into four phenotypes: (i) metabolically healthy normal weight (MHNW); (ii) metabolically unhealthy normal weight (MUHNW); (iii) metabolically healthy overweight (MHO); and (iv) metabolically unhealthy overweight (MUHO).
Phenotype definition was based on Wildman et al.’s criteria(Reference Wildman, Muntner and Reynolds7), wherein individuals are considered metabolically unhealthy when two or more of the following cardiometabolic abnormalities are present: SBP/DBP ≥ 130/85 mmHg or taking antihypertensive drugs; TAG ≥ 150 mg/dl; HDL-C <40 mg/dl in males and <50 mg/dl in females or use of lipid-lowering medication; glucose ≥ 100 mg/dl or use of hypoglyacemic medication; and HOMA-IR and us-CRP >90th percentile. Individuals with BMI ≥ 25·0 kg/m2 were considered overweight and those below this value were considered normal weight(21).
Statistical analysis
All variables were examined for normality by the Shapiro–Wilk test and graphical assessment. The non-normally distributed variables are presented as medians and interquartile ranges. The Kruskal–Wallis test was used to compare groups with Dunn’s post hoc test. Receiver-operating characteristic (ROC) curves were constructed to compare the predictive capacity of VAI with other indicators of adiposity (WC, WHtR, WHR and NC), aiming to detect unhealthy metabolic phenotype among normal-weight and overweight individuals. The overall accuracy was calculated using the area under the ROC curve (AUC) and AUC ≤ 0·5 was indicative of lack of discriminatory ability(Reference Janghorbani, Aminorroaya and Amini29). Based on the literature(Reference Janghorbani, Aminorroaya and Amini29, Reference Janghorbani and Amini30), AUC ≥ 0·90 is considered to indicate excellent performance, AUC between 0·80 and 0·90 to indicate good performance, AUC between 0·70 and 0·80 to indicate fair performance and AUC between 0·50 and 0·70 to indicate poor performance. The ROC curves were also used to determine the optimal cut-off points for the different adiposity indicators, and those with the best balance between the sensitivity and specificity values were selected. From the cut-off points obtained, the association of the adiposity indicators with the unhealthy metabolic phenotype in the two analysed groups (normal weight and excess weight) was examined by Poisson regression analysis with robust variance. The models were adjusted for age (continuous, in years), schooling (categorized as 0–4, 5–8, 9–11 and ≥ 12 years of education) and socio-economic status (categorized as high, intermediate and low). Prevalence ratios (PR) and their respective 95 % CI were calculated. The statistical significance was α = 0·05. All statistical analyses were performed using the statistical software package Stata version 13.0.
Results
Of the 854 individuals evaluated, the prevalence in the sample for each of the phenotypes was 51·05 (95 % CI 47·69, 54·40) % for MHNW, 10·07 (95 % CI 8·22, 12·28) % for MUHNW, 21·78 (95 % CI 19·13, 24·68) % for MHO and 17·10 (95 % CI 14·71, 19·78) % for MUHO. The prevalence of the metabolically unhealthy phenotype in males was 16·59 (95 % CI 12·23, 22·11) % among those with normal weight and 40·83 (95 % CI 33·60, 48·47) % among those with overweight. In females, it was 16·39 (95 % CI 12·59, 21·05) % among those with normal weight and 47·24 (95 % CI 39·62, 54·99) % among those with overweight.
Tables 1 and 2 show that metabolically unhealthy individuals were older and had higher VAI, SBP, DBP, TAG and us-CRP levels, and lower HDL-C levels, than their metabolically healthy counterparts in both groups (normal weight and overweight) and in both sexes. No significant differences in LTPA and energy intake were found in both sexes, nor for ingestion of macronutrients (data not shown). Body fat percentage was statistically different among the phenotypes in males.
Table 1 Characteristics of male volunteers according to the different phenotypes. Viçosa, MG, Brazil, 2012–2014

MHNW, metabolically healthy normal weight; MUHNW, metabolically unhealthy normal weight; MHO, metabolically healthy overweight; MUHO, metabolically unhealthy overweight; IQR, interquartile range; LTPA, leisure-time physical activity; BFP, body fat percentage; VAI, visceral adiposity index; WC, waist circumference; WHtR, waist-to-height ratio; WHR, waist-to-hip ratio; NC, neck circumference; SBP, systolic blood pressure; DBP, diastolic blood pressure; HDL-C, HDL-cholesterol; HOMA-IR, homeostatic model assessment of insulin resistance; us-CRP, ultra-sensitive C-reactive protein.
a,b,c,d Median values within a row with unlike superscript letters were significantly different by the Kruskal–Wallis test and Dunn’s post hoc test (P<0·05).
Table 2 Characteristics of female volunteers according to the different phenotypes. Viçosa, MG, Brazil, 2012–2014

MHNW, metabolically healthy normal weight; MUHNW, metabolically unhealthy normal weight; MHO, metabolically healthy overweight; MUHO, metabolically unhealthy overweight; IQR, interquartile range; LTPA, leisure-time physical activity; BFP, body fat percentage; VAI, visceral adiposity index; WC, waist circumference; WHtR, waist-to-height ratio; WHR, waist-to-hip ratio; NC, neck circumference; SBP, systolic blood pressure; DBP, diastolic blood pressure; HDL-C, HDL-cholesterol; HOMA-IR, homeostatic model assessment of insulin resistance; us-CRP, ultra-sensitive C-reactive protein.
a,b,c,d Median values within a row with unlike superscript letters were significantly different by the Kruskal–Wallis test and Dunn’s post hoc test (P<0·05).
Except for NC in males and BMI in both sexes, all other anthropometric indicators were significantly different among the phenotypes for both sexes, being higher in the metabolically unhealthy groups than in the metabolically healthy groups. Similarly, insulin and HOMA-IR were higher in metabolically unhealthy women than in healthy ones, for both groups (normal weight and overweight).
After the ROC curves were generated, all the anthropometric indicators were able to predict the metabolically unhealthy phenotype, except NC in normal-weight individuals (Table 3). Comparing the AUC for the indicators, VAI showed the highest diagnostic precision in detecting the MUHNW phenotype in both males (AUC = 0·865) and females (AUC = 0·843) and the MUHO phenotype in females (AUC = 0·903). Among males, although the AUC of VAI for the MUHO phenotype was the highest (AUC = 0·830), its accuracy cannot be considered different from WC, WHtR and NC since their 95 % CI overlap. In addition, it can be seen that the AUC values for the indicators WC, WHtR, WHR and NC were similar, regardless of sex and the group evaluated (normal weight and overweight; Table 3).
Table 3 Areas under the receiver-operating characteristic curves and cut-off points of the visceral adiposity index and anthropometric indicators to predict metabolically unhealthy phenotype among normal-weight and overweight individuals, according to sex. Viçosa, MG, Brazil, 2012–2014

MUHNW, metabolically unhealthy normal weight; MUHO, metabolically unhealthy overweight; AUC, area under the ROC (receiver-operating characteristic) curve; Sens., sensitivity; Spec., specificity; VAI, visceral adiposity index; WC, waist circumference; WHtR, waist-to-height ratio; WHR, waist-to-hip ratio; NC, neck circumference.
Associations of VAI and WC with the MUHNW phenotype were found in the adjusted models for males, while for the MUHO phenotype, significant associations were observed for all parameters evaluated, even after adjusting for confounding factors (Table 4).
Table 4 Poisson regression analysis for associations of the visceral adiposity index and anthropometric indicators with metabolically unhealthy phenotype among normal-weight and overweight male volunteers. Viçosa, MG, Brazil, 2012–2014

PR, prevalence ratio; MUHNW, metabolically unhealthy normal weight; VAI, visceral adiposity index; WC, waist circumference; WHtR, waist-to-height ratio; WHR, waist-to-hip ratio; NC, neck circumference; MUHO, metabolically unhealthy overweight.
* Adjusted for age, schooling and socio-economic status.
Among females, we found that VAI, WC and WHtR were associated with the MUHNW phenotype in the adjusted models, while for the MUHO phenotype, we found significant associations with all the anthropometric indicators (Table 5). Tables 4 and 5 show that the strength of the association with the metabolically unhealthy phenotype was higher for VAI than for the other indicators evaluated, especially among individuals with normal weight. In males, the prevalence of the MUHNW phenotype among individuals with VAI above the established cut-off point in the ROC curves (1·487) was 6·74 times the prevalence of individuals with VAI below this value. In females, the prevalence of the MUHNW phenotype among individuals with high VAI (above 1·460) was 7·14 times the prevalence observed among the others.
Table 5 Poisson regression analysis for associations of the visceral adiposity index and anthropometric indicators with metabolically unhealthy phenotype among normal-weight and overweight female volunteers. Viçosa, MG, Brazil, 2012–2014
PR, prevalence ratio; MUHNW, metabolically unhealthy normal weight; VAI, visceral adiposity index; WC, waist circumference; WHtR, waist-to-height ratio; WHR, waist-to-hip ratio; NC, neck circumference; MUHO, metabolically unhealthy overweight.
* Adjusted for age, schooling and socio-economic status.
Discussion
The results of the current study showed that among the indicators of adiposity evaluated, VAI is the best predictor of the MUHNW phenotype in both sexes and of the MUHO phenotype among women. In the prediction of the MUHO phenotype among men, VAI was diagnostically superior only to WHR. Our findings also revealed that VAI was the indicator most strongly associated with the metabolically unhealthy phenotype, especially among individuals with normal weight.
Evaluation of the diagnostic performance considering the areas below the ROC curves shows that the AUC of VAI for the MUHNW phenotype was 0·865 for males and 0·843 for females, and 0·830 for the MUHO phenotype among men, all classified as good diagnostic performance(Reference Janghorbani, Aminorroaya and Amini29, Reference Janghorbani and Amini30). The AUC of VAI for the MUHO phenotype among women was higher than 0·9, indicating an excellent diagnostic performance(Reference Janghorbani, Aminorroaya and Amini29, Reference Janghorbani and Amini30). The performance of the other parameters was classified as only fair or poor.
A study(Reference Du, Yu and Zhang14) developed to evaluate the feasibility of VAI in identifying individuals with MUHNW in the Chinese population also verified the accuracy of this indicator and its diagnostic superiority in relation to BMI, WC, WHtR and WHR, regardless of the criteria used to define the phenotypes. However, the authors reported AUC for VAI lower than those obtained in our study, ranging from 0·611 to 0·835 depending on the definition criterion.
Kang et al.(Reference Kang, Jung and Cho9) also evaluated the relationship of VAI with obese phenotypes. Although the main objective of that study was to evaluate the association of VAI with the conversion of the metabolically healthy obese to the metabolically unhealthy obese phenotype, they found that VAI had greater capacity to predict this conversion than WC. The authors suggested that VAI was a more appropriate indicator as a replacement measure in predicting unfavourable metabolic outcomes, possibly due to a more accurate assessment of visceral adiposity.
As already mentioned, our study showed a positive and independent association between VAI and the unhealthy metabolic phenotype in both sexes, and that this association was stronger among individuals with normal weight. Although this finding needs to be confirmed by other studies, it demonstrates the potential of VAI to identify individuals with normal weight at cardiometabolic risk.
The association between VAI and the metabolically unhealthy phenotype, both among normal-weight individuals and those with excess weight, confirms that increased visceral adiposity is related to the occurrence of an unfavourable metabolic profile. Similarly, Du et al. (Reference Du, Yu and Zhang14) found that the individuals with the highest VAI had the poorest metabolic profile. These results highlight the applicability of VAI as an important marker of cardiometabolic risk.
We should keep aware of metabolic abnormalities that may or may not be associated with obesity because there is evidence that normal and metabolically unhealthy individuals are at increased risk for CVD and type 2 diabetes(Reference Aung, Lorenzo and Hinojosa12, Reference Janghorbani, Salamat and Amini31, Reference Wu, Fisher-Hoch and Reninger32). Because individuals of this group are not overweight, most of the time they are not the target of screening programmes and, therefore, they fail to receive the appropriate interventions.
The associations found between the other indicators of adiposity evaluated and the metabolically unhealthy phenotype allow us to infer that they can also identify central obesity, even though with less precision than VAI. This difference may occur because these indicators are based only on anthropometric measures, while VAI includes anthropometric and lipid parameters in its formulation, leading to better detection of tissue dysfunction. On this point, it is important to point out that the two lipid parameters used in VAI formulation (i.e. TAG and HDL-C) are also used in the determination of metabolic phenotypes. As result, higher correlations of metabolically unhealthy phenotypes with VAI than with the other indicators evaluated were expected. However, we would like to emphasize that our main objective was to compare VAI predictive capacity by nutritional status and sex. Interestingly, we identified that VAI is more strongly associated with the metabolically unhealthy phenotype among normal-weight than overweight individuals, showing that this index can be very useful in the MUHNW phenotype identification.
The prevalence of MUHNW phenotype was approximately 16 %, with values very close between men and women. These prevalences are similar to those described by Aung et al.(Reference Aung, Lorenzo and Hinojosa12) and Ryoo et al.(Reference Ryoo, Park and Ye33, Reference Ryoo, Park and Oh34), which were 12·8, 21·1 and 13·30 %, respectively. Although these authors did not stratify the prevalence by sex, the criteria used to define the phenotype were similar to those of our study(Reference Wildman, Muntner and Reynolds7), allowing comparisons to be made. We found MUHO prevalences of 40·83 and 47·24 % for males and females, respectively, higher than that reported by Wu et al.(Reference Wu, Fisher-Hoch and Reninger32), which was 34·1 %.
Metabolically unhealthy individuals were older, as observed in other studies(Reference Mirzaei, Abdi and Serahati3, Reference Kim, Seo and Cho10, Reference Du, Yu and Zhang14, Reference Pimentel, de, Scorsatto and Moraes de Oliveira35). This finding suggests that age may influence the metabolic profile, and due attention should be given to individuals as they age.
Our study has some limitations. First, the sample size may have reduced its power to detect associations, especially by having stratified the analyses according to sex and nutritional status. Another aspect is that the cross-sectional nature of the study limits the interpretation in relation to the directionality of the associations found.
Despite these limitations, the present study has many strengths, including the more comprehensive criteria used to define the phenotypes which consider not only components of the metabolic syndrome, thereby detecting a greater range of metabolic abnormalities. The performance of stratified analyses by sex is another strength of the study, since it has been shown that men and women differ in the accumulation of visceral fat. Finally, the methodological rigour of data collection, which included trained interviewers, standardized protocols and anthropometric measurements taken by a single examiner, ensured the validity of the results and their potential for application.
Conclusion
In conclusion, the present study results showed that, in general, VAI has a better capacity of predicting the metabolically unhealthy phenotype than conventional anthropometric indicators in both sexes. We also found that VAI is most strongly associated with metabolically unhealthy phenotype among normal-weight individuals. The main implication of these findings is that, by using an index calculated from simple measures, it is possible to predict accurately the presence of an unfavourable cardiometabolic profile. Particularly, the identification of individuals with MUHNW phenotype allows early interventions to prevent future occurrence of CVD and diabetes.
The evidence from the present study therefore suggests that efforts be directed toward the identification of individuals with normal weight and at cardiometabolic risk, because although they have a high potential for the development of diabetes and CVD, they are generally disregarded in screening and prevention programmes.
Acknowledgements
Acknowledgements: The authors thank all the volunteers who contributed to the study, as well as the National Council for Scientific and Technological Development (CNPq) and the Foundation for Supporting Research in the State of Minas Gerais (FAPEMIG) for funding the project. Financial support: This work was supported by CNPq (grant number 481418/2011-3) and FAPEMIG (grant number APQ-00296-12). The funding agencies had no role in the design, analysis or writing of this article. Conflict of interest: The authors declare no conflict of interest. Authorship: F.G.F. contributed to the data collection and analyses, wrote the initial draft of the manuscript and assembled the final version. L.L.J. and G.Z.L. contributed to the study design, analysis design and data analyses, and participated in the approval of the final version of the manuscript. D.C.G.S. contributed to the data collection and analyses and participated in the approval of the final version of the manuscript. Ethics of human subject participation: This study was conducted according to the guidelines laid down in the Declaration of Helsinki and all procedures involving human subjects were approved by the Research Ethics Committee of the Federal University of Viçosa (Official Letter 02/2013). Written informed consent was obtained from all subjects.