


Measurement of weight is one of the most fundamental anthropometric measures and an essential indictor for growth and nutritional status in clinical care and paediatric research. Weight is conventionally determined by a mechanical or electronic scale, if available. However, immediate and accurate weight measurement remains a fundamental challenge in situations where the child is immobilized due to critical illness or acute injury in emergency settings. Indeed, weight is a vital measurement performed in paediatric emergency departments and is critical for diagnostic and therapeutic decisions, such as estimating energy requirements and calculating individualized medication dosage, fluid administration and device sizes. Thus, failure to accurately estimate paediatric weight could comprise the quality of paediatric care.
Although parental recall or weight estimation by caregivers may be available in certain circumstances, the accuracy varies widely and may lack consistency in different populations( Reference Anglemyer, Hernandez and Brice 1 – Reference Rosenberg, Thundiyil and Greenberger 7 ). Therefore, various weight estimation methods have been developed, mostly based on a child’s age, length or both. Overall, length- or length- and age-based methods have greater accuracy than solely age-based ones( Reference Georgoulas and Wells 8 , Reference Wells, Goldstein and Bentley 9 ); however, accurate measurement of recumbent length, particularly in infants and young children, has its challenges( Reference Black, Barnett and Wolfe 10 ). Moreover, most previous weight estimation methods tend to under- or overestimate weight in children at the extremes of the weight distribution( Reference Abdel-Rahman and Ridge 11 ). Given the childhood obesity epidemic in high-income countries and the prevalence of both underweight and overweight/obese children in low- and middle-income countries( Reference Ogden, Carroll and Kit 12 , Reference Doak, Adair and Bentley 13 ), weight estimation strategies which accommodate children across weight categories with consistent, improved precision over the existing methods are warranted.
In the present study, we examined the accuracy and reliability of ulna length, a previously validated surrogate for paediatric length/height( Reference Forman, Zhu and Hernandez 14 ), and forearm measurements (width and circumference) measured by simple and portable tools as surrogates of paediatric weight in a multi-racial/ethnic population of infants and children aged <6 years in the USA. Further, to assess the performance of these ulna- and forearm-based weight estimation models, we compared them with several existing age- or length-based models (i.e. advanced paediatric life support (APLS), Theron and Traub–Johnson formulas; Table 1)( Reference Mackway-Jones, Molyneux and Phillips 15 – Reference Traub and Johnson 17 ).
Table 1 Previous age- or length-based methods for weight estimation in children
APLS, advanced paediatric life support.
Methods
Study design and population
The study was a cross-sectional assessment of anthropometric status of infants/children aged <6 years across eight study centres in the USA (2011–2012). The detailed design of the study has been described previously( Reference Forman, Zhu and Hernandez 14 , Reference Zhu, Hernandez and Dong 18 ). Briefly, mother–offspring dyads were recruited at daycare centres, churches, clinics and community centres (n 1634). Eligibility criteria were: mothers aged 18–49 years and non‐institutionalized; and offspring who were aged 0–5·9 years, healthy, had not suffered from any illness associated with weight loss during the past week, and were afebrile at the time of study visit. If more than one infant/child of the mother was recruited, the youngest singleton was included in the current analysis to reduce the cluster effect within the same family (n 1560). The analysis included infants/children with at least one anthropometric measurement (n 1473).
Data collection
Child’s age, sex and race/ethnicity were reported by the mother using an interviewer-administered questionnaire. Anthropometric measurements were obtained by data collection teams each composed of two trained researchers (one measurer, one recorder). Following standard anthropometric protocols( Reference Lohman, Roche and Martorell 19 ), weight was measured to the nearest 0·01 kg in infants wearing a dry diaper or in children wearing underpants on an electronic scale (SECA, Germany), calibrated daily using a Troemner® weight. Recumbent length and standing height were measured to the nearest 0·1 cm using an infantometer and a portable stadiometer (SECA, Germany) in infants/children aged 0–1·9 and 2–5·9 years, respectively.
All ulna measurements were obtained on the right arm. After marking the two end points of the ulna (i.e. the styloid and olecranon processes), ulna length was measured to the nearest 0·1 cm using a calliper (Rosscraft Innovations Inc., Canada) while the right arm was placed in a horizontal plane with the elbow flexed ~90° (see online supplementary material, Supplemental Fig. 1A). Forearm width was measured to the nearest 0·1 cm using a graph paper grid which can be printed on a regular letter-size paper by: (i) having the participant place his/her arm on a table or a thin rigid board (such as a clipboard); (ii) having the right arm straightened and pointing outward from the body with palm down and lateral aspect of the forearm aligned along the zero vertical axis of the grid; (iii) marking two points at the maximal width of the forearm on the grid; and (iv) reading the maximal width of the forearm to the nearest 0·1 cm according to the uniform dimensions on the grid (see online supplementary material, Supplemental Fig. 1B). Of note, the grid was coloured across rows/units of ten boxes to facilitate reading the measurements. Forearm circumference was measured to the nearest 0·1 cm using an insertion tape (ShorrTape©, USA) on the forearm by: (i) having the right elbow extended and the forearm positioned so that it is freestanding (not resting on the table or body); (ii) having the tape measure perpendicular to the long axis of the forearm; and (iii) measuring the maximal forearm circumference with the tape measure (see online supplementary material, Supplemental Fig. 1C).
Each measurement was taken in duplicate. The mean value was calculated if the two initial measurements agreed within 0·2 kg for weight or 0·2 cm for length, height, and ulna and forearm measurements. Otherwise, an additional measurement was obtained and the mean of the two closest recordings was used. To determine the intra- and inter-observer reliability, replicate measures were taken by reversing staff’s positions as measurer and recorder in an approximately 10 % random sub-sample (n 124).
Statistical analysis
Data pre-processing approaches were reported previously( Reference Zhu, Hernandez and Mueller 20 ). Based on the point biserial model for correlations, the total sample size of 1473 was sufficient to detect an effect size as small as r=0·07 between an ulna or forearm measurement and weight at 80 % power with a two-tailed significance level of α=0·05. The total sample was randomly split 2:1 into a training set (n 1016) and validation set (n 457). Comparison of subject characteristics and anthropometrics between the two sets was tested by the Student’s t test for continuous variables or the χ 2 test for categorical variables. Intra- and inter-observer reliability of each anthropometric measure was estimated by computing CV and intraclass correlation coefficients (ICC) using a one-way random model and absolute agreement type( Reference Landers 21 ) in the random sub-sample of 124 infants/children.
Prediction equations for weight were developed in the training set using multivariable mixed-effects linear regression analysis with study centre as a random effect. Initially, parameters for stature (length/height or ulna length) and body size (forearm width or circumference) were included as predictors. Given significant age, sex and racial/ethnic variation in anthropometrics (see online supplementary material, Supplemental Table 1), we included these factors as potential predictors. Notably, racial/ethnic variation was parameterized as a dichotomous variable (i.e. Hispanic or not) given the oversampling of Hispanics in our study population. Also, we included a quadratic term for forearm width or circumference in all models given the non-linear associations observed between weight and forearm width or circumference. Final models were reduced by stepwise elimination using entry (P=0·10) and removal (P=0·05) criteria. The marginal R 2 proposed by Nakagawa and Schielzeth was calculated to represent the proportion of variance explained by fixed effects( Reference Nakagawa and Schielzeth 22 ). Standard error of estimate was computed for each equation.
In the validation set, mean percentage error (MPE), a measure of the overall bias estimate of each model, was calculated as: 100×(predicted weight – measured weight)/measured weight. Root-mean-squared percentage error (RMSPE), a measure of precision estimate, was calculated by taking the square root of the average squared percentage error. Percentages of weight estimates falling within 10 and 20 % limits of deviation from actual weight were calculated to assess the predictive accuracy. Comparison of the aforementioned estimates between existing methods and newly developed models were assessed using paired t tests with Bonferroni–Holm adjustment( Reference Holm 23 ) by: weight strata (<10, 10–19·9 and ≥20 kg) for all; weight-for-length Z-score (WLZ) percentile categories (i.e. underweight/normal (WLZ<85th percentile) and overweight/obese (WLZ≥85th percentile)) among infants aged <2 years; and BMI-for-age Z-score (BMIZ) percentile categories (i.e. underweight/normal (BMIZ<85th percentile) and overweight/obese (BMIZ≥85th percentile)) among children aged 2–5·9 years. As recommended by the Centers for Disease Control and Prevention, BMI is used to screen for overweight/obesity in children ≥2 years old( Reference Kuczmarski, Ogden and Guo 24 ). Therefore, infants aged <2 years were grouped separately according to WLZ percentiles derived from the WHO Child Growth Standards( 25 ).
Further, Bland–Altman plots( Reference Bland and Altman 26 ) were constructed to assess the agreement between the measured and predicted weight by our models and existing ones( Reference Mackway-Jones, Molyneux and Phillips 15 – Reference Traub and Johnson 17 ). The limits of agreement were defined as the mean difference between the predicted and measured weight ±1·96 sd. We constructed Bland–Altman plots on the original scale (i.e. kilograms) given the narrow age and weight range of the study. This approach however, compared with log-transformation of the data, also allows direct evaluation on the original scale of the agreement between predicted and measured weight, which could facilitate interpretation within the context of real settings.
All analyses were conducted with the statistical software package IBM SPSS Statistics version 21 and R software version 3·3. Statistical significance was set at a two-tailed P<0·05.
Results
Among the 1016 infants/children in the training set, 52·3 % were boys; the overall mean age was 1·9 years; and the ethnic distribution was 45·6 % Hispanic, 25·5 % non-Hispanic Black, 20·5 % non-Hispanic White and 8·4 % Other groups (Table 2). The validation set did not differ from the training set by demographic characteristics or anthropometric measures. All anthropometric measures including ulna and forearm measurements had high intra- and inter-observer reliability overall, with CV ranging from 0·08 to 2·16 % and ICC ranging from 0·952 to 1·000 (see online supplementary material, Supplemental Table 2). Weight measured by calibrated scale had the highest intra-observer reliability with the smallest CV and greatest ICC, followed by height, length, forearm circumference, ulna length and forearm width. Likewise, weight had the highest whereas forearm width had the lowest inter-observer reliability, respectively.
Table 2 Subject characteristics and child anthropometrics in the training and validation sets of multi-racial/ethnic infants and children aged <6 years; National Children’s Study-Formative Research in Anthropometry, USA (2011–2012)

* Obtained by Student’s t test for continuous variables and the χ 2 test for categorical variables.
† Recumbent length and standing height were measured among infants and children aged 0–1·9 and 2–5·9 years, respectively.
In total, four weight estimation models were empirically derived as listed in Table 3. Of note, age and sex were not included in Models 1 and 2 due to the insignificant contribution to the final models according to the stepwise elimination criteria mentioned above. Overall, models using total body length/height as a predictor (Models 1 and 2) and models using ulna length as a surrogate for length/height (Models 3 and 4) had comparable predictive accuracy, regardless of the surrogate for body size (forearm width or circumference). Further, among the two models using ulna length as a surrogate for length/height, the one using forearm circumference as a surrogate for body size (Model 4) had slightly greater predictive accuracy than the one using forearm width (Model 3).
Table 3 Regression equationsFootnote * to estimate weight in infants and children aged 0–5·9 years developed in the training set (n 1016) of multi-racial/ethnic infants and children aged <6 years; National Children’s Study-Formative Research in Anthropometry, USA (2011–2012)

R marginal 2, coefficient of determination for fixed effects; SEE, standard error of estimate (kg); L, length/height (cm); FW, forearm width (cm); FC, forearm circumference (cm); A, age (years); UL, ulna length (cm).
* Equations were obtained from mixed-effects linear regression analysis using study centre as a random effect.
Overall, compared with the three existing formulas, the performance of Models 1–4 did not differ appreciably between one another and was superior to the APLS, Theron and Traub–Johnson formulas (Table 4). Across the weight strata, the MPE were significantly smaller across Models 1–4 compared with the existing formulas except that the Traub–Johnson did not vary from Models 2–4 among infants/children weighing <10 kg (1·2 v. −0·5 to 2·4 %); and that the Theron formula did not vary from Models 1–4 among infants/children weighing ≥20 kg (−6·2 v. −4·8 to −8·1 %). Among infants aged <2 years with WLZ<85th percentile, the MPE were 0·2 to 1·4 % across Models 1–4, which were significantly smaller than for the APLS (6·1 %), Theron (13·3 %) and Traub-Johnson (−2·4 %) formulas. Among infants aged <2 years with WLZ≥85th percentile, all models tended to underestimate weight except the Theron formula (5·2 %); Models 3 and 4 slightly underestimated weight by −2·4 to −1·7 %, followed by Models 1 and 2 (−6·2 to −4·3 %) and the APLS formula (−4·3 %), whereas the Traub–Johnson formula had the greatest MPE (−14·3 %). For underweight/normal-weight children aged 2–5·9 years, Model 4 and the APLS formula slightly overestimated weight by 2·3 and 0·8 %, respectively, whereas the Theron formula had the largest MPE (14·3 %). Among overweight/obese children aged 2–5·9 years, all models tended to underestimate paediatric weight; however, Models 2 and 4 yielded the smallest MPE (−5·2 % and −4·1 %) and the APLS formula yielded the greatest (−18·0 %). Consistently, the measure of precision as indicated by RMSPE was overall smaller among Models 1–4 compared with the three existing methods (i.e. range=7·5–8·7 v. 9·8–13·3 %; Table 4). The differences in RMSPE across models were more pronounced at weight extremes, i.e. among children weighing <10 kg or ≥20 kg or overweight/obese infants or children. Further, estimates of accuracy as indicated by percentage of agreement within 10 and 20 % % limits of deviation from actual weight illustrated that the predictive accuracy was greater across Models 1–4 compared with the three existing methods (Table 5). Specifically, Models 1–4 were overall within 10 and 20 % of actual weight in 72·2–86·9 and 95·2–98·5 % of the weight estimations, respectively, which outperformed any of the other existing methods (56·5–68·6 and 74·5–83·0 % of weight estimations within 10 and 20 % of actual weight, respectively).
Table 4 Mean percentage error (MPE)Footnote * between predicted and measured weight and root-mean-squared percentage error (RMSPE) by weight, weight-for-length percentile and BMI-for-age percentile categories in the validation set (n 457) of multi-racial/ethnic infants and children aged <6 years; National Children’s Study-Formative Research in Anthropometry, USA (2011–2012)
APLS, advanced paediatric life support.
a,b,c,dMean values in a row with unlike superscript letters were significantly different (P<0·05) using the paired t test with Bonferroni–Holm adjustment for pairwise comparisons.
* MPE was calculated as: 100×(predicted weight – measured weight)/measured weight.
† Underweight/normal and overweight/obese were defined as <85th percentile and ≥85th percentile for weight-for-length among infants aged <2 years and for BMI-for-age for among children aged 2–5·9 years, respectively.
Table 5 Predictive accuracy performanceFootnote * of Models 1–4 and the three existing methods in multi-racial/ethnic infants and children aged <6 years; National Children’s Study-Formative Research in Anthropometry, USA (2011–2012)

APLS, advanced paediatric life support.
* Values presented are percentages of weight estimates within specified limits of deviation (≤10 and ≤20 %) from actual weight.
† Underweight/normal and overweight/obese were defined as <85th percentile and ≥85th percentile for weight-for-length among infants aged <2 years and for BMI-for-age among children aged 2–5·9 years, respectively.
Overall, the Bland–Altman plots illustrated no obviously biased patterns of paediatric weight estimation using Models 1–4 (mean difference range=−0·012 to 0·002 kg), especially among infants (corresponding to the small values on the x-axis; Fig. 1). In contrast, the APLS, Theron and Traub–Johnson formulas tended to underestimate weight (mean difference range=−0·602 to −0·962 kg) as the mean values of weight increased. In addition, the limits of agreement were narrower for Models 1–4 compared with the existing formulas, with the APLS having the widest range (−5·10 to 3·90 kg).
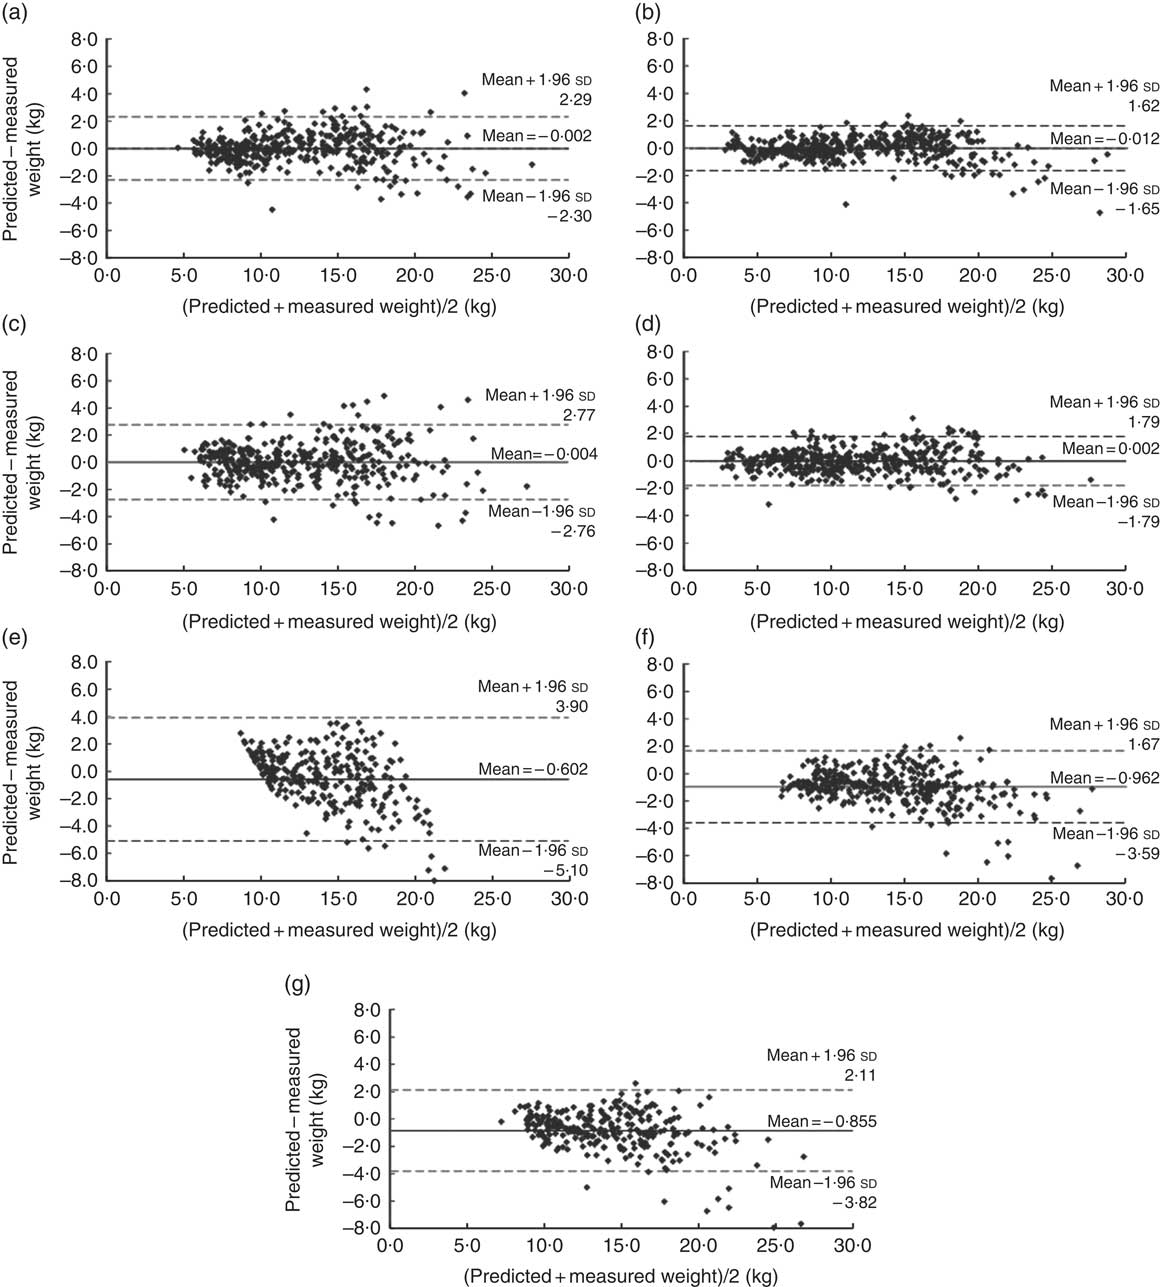
Fig. 1 Bland–Altman plots assessing the relative validity of four weight estimation models (based on ulna length and forearm width and circumference, measured by simple and portable tools) and three previous methods (based on age or length) in predicting weight in multi-racial/ethnic infants and children aged <6 years; National Children’s Study-Formative Research in Anthropometry, USA (2011–2012). The difference between measured weight and predicted weight is plotted v. the mean weight from the two methods for: (a) Model 1 (n 376); (b) Model 2 (n 422); (c) Model 3 (n 386); (d) Model 4 (n 431); (e) the advanced paediatric life support (APLS) formula (n 285); (f) the Theron formula (n 285); and (g) the Traub–Johnson formula (n 286) in the validation set. ——— indicates the mean difference (bias) between the predicted and measured weight and – – – – – indicate the 95 % limits of agreement
Discussion
In the current study, ulna and forearm measurements obtained by simple, portable and convenient tools (i.e. calliper, paper grid and insertion tape) were accurate and reliable surrogate measures for paediatric weight among healthy infants/children aged <6 years in the USA. The intra- and inter-reliability of ulna and forearm measurements was high and comparable to or better than those reported previously( Reference Gauld, Kappers and Carlin 27 – Reference Pappas, Watson and Erickson 29 ), suggesting their applicability by trained staff in varied settings including daycare centres, clinics and community centres, as demonstrated in our study. The estimates of predictive bias, precision and accuracy of our empirically derived models were comparable with one another and significantly superior to the three examples of existing age- or length-based formulas, suggesting that they may serve as alternative strategies for paediatric weight estimation when immediate weight measurement is unobtainable or unreliable such as in the emergency room.
The high comparability of these four models could provide flexibility and enhance applicability in different settings. In situations where the child’s age is unknown, Models 1 and 2 could be utilized for immediate weight estimation, whereas Models 3 and 4 could be utilized when the child’s recumbent length or standing height cannot be measured, given measurements of the ulna and forearm are usually not impeded by joint deformity and the ulna is readily accessible even in immobilized patients. Further, Model 3 had the lowest MPE between predicted and measured weight across all models of underweight or normal-weight infants aged <2 years. Taken together, in field settings where a calibrated scale or level floor is unavailable, the ulna and forearm measurements obtained by simple and affordable tools could potentially provide alternative options for paediatric weight estimation, with overall exchangeability and also flexibility in varied settings.
Several strategies for paediatric weight estimation have been developed with varied degrees of applicability in specific paediatric sub-populations. The age-based strategies such as the APLS( Reference Mackway-Jones, Molyneux and Phillips 15 ) and Theron( Reference Theron, Adams and Jansen 16 ) formulas have advantages due to their simplicity and lack of additional anthropometric surrogates. However, the APLS formula largely underestimates weight among children weighing more than 20 kg or overweight/obese children by approximately 20 % in our study population, similar to previous observations( Reference Black, Barnett and Wolfe 10 , Reference Loo, Chong and Lek 30 ). In contrast, the Theron formula did not vary from our models in terms of predictive accuracy among heavier children, but tended to overestimate weight by 22·5 % among children weighing <10 kg and by 13·3 % among underweight/normal-weight infants aged <2 years. Indeed, the Theron method was developed among a sample of children of Pacific Island and Māori origins in New Zealand, whose overweight/obesity prevalence was significantly higher than their European counterparts (40–60 v. 24 %)( 31 ), potentially limiting their applicability for other paediatric populations. There are several other age-based formulas for paediatric weight estimation, such as the Luscombe formula( Reference Luscombe, Owens and Burke 32 ), the finger counting method( Reference Young, Chen and Kim 33 ) and the Chinese age–weight rule( Reference Cattermole, Leung and So 34 ). As demonstrated in a recent study assessing twenty age-based weight estimation methods, the age-based methods had an overall high rate of critical errors (i.e. percentages of weight estimates falling outside 20 % deviation from actual weight) ranging from 25 to 75 % and were inferior to any length-based method (e.g. Broselow tape, paediatric advanced weight-prediction in the emergency room (PAWPER) tape or the Mercy method)( Reference Wells, Goldstein and Bentley 9 ).
The length-based strategies such as the Traub–Johnson formula( Reference Traub and Johnson 17 ) and the Broselow tape( Reference Lubitz, Seidel and Chameides 35 ) could be applied in situations without knowledge of a child’s exact age. Although the measurer can directly read weight from the measuring tape, the Broselow tape is limited to a length range of 46–143 cm. The Traub–Johnson formula had similar prediction accuracy as our Models 2 and 4 among children weighing <10 kg. Nevertheless, its performance was compromised and inferior to our Models 2 and 4 with a bias pattern of underestimation among heavier (≥20 kg) or more obese children. On the other hand, the age- or length-based equations do not take into account the child’s body size, which is an important predictor of paediatric weight( Reference Abdel-Rahman and Ridge 11 , Reference Garland, Kishaba and Nelson 36 ). The Devised Weight Estimation Method( Reference Garland, Kishaba and Nelson 36 ), a length- and body size-based method, has relatively high prediction accuracy, with MPE between predicted and measured weight ranging from −3·9 to 7·0 % among children weighing <10 to >40 kg. Notably, this method involves a subjective assessment of body size (slim, average or heavy), which may have bias as evidenced by mean intra- and inter-rater agreement of 86 % (range=81–94 %) and 78 % (58–93 %), respectively( Reference Black, Barnett and Wolfe 10 ). Similarly, the PAWPER tape involves a two-step process based on supine length and habitus scoring, whereas the accuracy and reliability of the habitus evaluation in different settings remain to be assessed( Reference Wells, Coovadia and Kramer 37 ).
Among long bone- and/or mid-upper arm circumference (MUAC)-based methods, an MUAC-based formula developed among Hong Kong Chinese children aged 1–11 years outperformed the Broeselow method and the age-based APLS formula in older children, but not among pre-school children under 6 years old( Reference Cattermole, Leung and Mak 38 ). Among predominantly HIV-positive children aged 1·5–12 years in Botswana, over 90 % of the predicted weight fell within 15 % of the actual weight using an MUAC- and tibia or ulna length-based method developed by Wozniak et al.( Reference Whitfield, Wozniak and Pradinuk 39 , Reference Wozniak 40 ). However, due to the limited number of children aged <5 years (n 203) and weighing <10 kg (n 28), no conclusions can be drawn about these subgroups( Reference Whitfield, Wozniak and Pradinuk 39 , Reference Wozniak 40 ). Further, validity of this method among other paediatric populations remains to be determined. In contrast, the recently developed Mercy method relies on humerus length and MUAC, and has comparable prediction accuracy among children aged 2 months to 16 years to our ulna-/forearm-based models (MPE=−0·46 v. 0·1–0·7 %)( Reference Abdel-Rahman and Ridge 11 ). Notably, among children with shoulder/upper arm contractures and/or other physical impairments whose upper arm and total length/height measurements are not feasible, our ulna-/forearm-based models (Models 3 and 4) could serve as alternative strategies for weight estimation. Future studies on other paediatric populations are warranted to further assess the prediction precision of our developed methods in clinical settings.
Certain limitations of the present study should be noted. First, 44·9 % of our study population was of Hispanic origin. Given the limited anthropometric data among Hispanic neonates, infants and young children in the USA, we oversampled Hispanic infants and young children to enrich the limited data on anthropometrics, especially measurements of bone components. The ethnic component in Models 1–4 was dichotomized (i.e. Hispanic or not) given the respective sample size of each ethnic group. Therefore, the study population was not nationally representative which may limit the generalizability of our models. Nevertheless, our models highlight the need for future research to consider and incorporate race/ethnicity in weight prediction strategies among multi-racial/ethnic children. In addition, despite the overall zero bias as shown in the Bland–Altman plots, Models 1 and 3 exhibited some heteroscedasticity in weight estimation at older ages. We oversampled neonates and infants aged <1 years (39 %) to address the data gap given that most previous weight estimation methods are limited to 1 year or above( Reference Abdel-Rahman and Ridge 11 ). It is possible that the observed heteroscedasticity could be partially attributable to the insufficient statistical power among older children. Thus, age-specific weight prediction equations based on these surrogate measures merit further investigation. Finally, the impact of human factor and patient factor errors could be significant, especially for methods including any form of anthropometric measurements. Thus, these study findings need to be carefully evaluated during real or simulated emergency care.
Conclusion
In conclusion, ulna and forearm components can serve as accurate and reliable surrogate measures of weight in healthy infants/children aged 0–5·9 years. The developed models for paediatric weight estimation could potentially provide improvement over existing methods, especially among infants. In addition, the use of ulna length as a surrogate for length/height provides an alternative strategy in situations where length/height is not obtainable or unreliable. Further, ulna and forearm measurements can be obtained by simple and portable tools (i.e. calliper, paper grid and tape), which would be valuable in field settings where calibrated equipment (i.e. infantometer, stadiometer or electronic scale) is unavailable due to issues of portability, accessibility and expense. Finally, further evaluation and validation of these developed models are warranted in other paediatric populations, particularly among physically impaired or non-ambulatory children as well as children in resource-limited settings such as in low-income countries or rural areas.
Acknowledgements
Acknowledgements: The authors thank all the research teams at all participating study centres, including University of Texas at Austin; Baylor College of Medicine; Johns Hopkins University; Michigan State University; Saint Louis University; University of California, Irvine; University of California, Los Angeles; University of Minnesota; and University of Texas Health Science Center at San Antonio. Financial support: The research was supported by the Eunice Kennedy Shriver National Institute of Child Health and Human Development (NICHD; contract award number HHSN275200800020C). Y.Z. is partially supported by a career development training award from the National Institutes of Health (NIH) Building Interdisciplinary Research Careers in Women’s Health Program (award number 3K12HD052163). The NICHD and NIH had no role in the design, analysis or writing of this article. Conflict of interest: None. Authorship: J.H.H., S.H. and M.R.F. designed the research; Y.Z., L.M.H., J.H.H., L.E.C., J.M.K., L.A., P.V. and M.R.F. conducted the research; Y.Z. analysed data and wrote the paper; S.H. and M.R.F. contributed to manuscript preparation; Y.D. contributed to data management and statistical aspects of the work; Y.Z. and M.R.F. had primary responsibility for final content of the manuscript. All authors contributed to manuscript review. All authors read and approved the final manuscript. Ethics of human subject participation: This study was conducted according to the guidelines laid down in the Declaration of Helsinki and all procedures involving human subjects/patients were approved by all study centres listed in the online supplementary material, Supplemental Table 3. Written informed consent was obtained from all subjects.
Supplementary material
To view supplementary material for this article, please visit https://doi.org/10.1017/S1368980018002549


