


Restaurants play a major role in the American diet, with 82 % of US adults eating out at least once weekly(1). Restaurant meals have increased their contribution to total energy intake over time(Reference Kant and Graubard2) and increased consumption of food away from home is associated with poorer diet quality and higher intakes of energy, fat and sodium(3).
Consumers cannot accurately estimate the nutritional content of restaurant foods and several states and municipalities, led by New York City in 2008, passed menu labelling laws(Reference Pomeranz4). These initial efforts were superseded by the Patient Protection and Affordable Care Act of 2010 (ACA), which made energy (calorie) labelling on menus a national requirement for restaurants with twenty or more outlets nationwide as of March 2010, although some provisions do not take effect until the Food and Drug Administration finalizes regulations(5), expected in 2012.
The discussion on the effects of menu labelling has focused almost exclusively on consumer responses to a fixed menu(Reference Girz, Polivy and Herman6–Reference Elbel, Kersh and Brescoll11). Business responses are not well documented in the research, despite the fact that restaurants regularly introduce new items and occasionally reformulate existing ones. In fact, there is not even a comprehensive assessment of nutrient information across the restaurant industry, an essential requirement for future evaluations of the federal legislation. The present research fills this gap by describing how chain restaurant menu offerings shape the food environment faced by children and adults.
Two prior studies analysed the availability of nutrition information and one analysed menu nutritional content. In 2004, 44 % of the 300 largest US chain restaurants by sales provided nutrition information on websites or upon request(Reference Wootan and Osborn12). Also in 2004, among fifteen table service chain restaurants operating in Minnesota, ten provided some nutrition information but nine of these ten only provided data for items with specific health claims, such as ‘heart healthy’ or ‘low fat’(Reference Harnack13). It is likely that these rates changed substantially even before passage of the ACA, due to state and local regulations. One study considered nutritional content of restaurant menus, but it was limited to twelve fast-food restaurants(Reference Harris, Schwartz and Brownell14). Population-based dietary survey studies have analysed self-reported intake, but energy and nutrient values were estimated indirectly from databases(Reference Nielsen and Popkin15).
The present paper reports the status of data availability and nutritional content of menus in the largest US chain restaurants just prior to passage of the ACA. It analyses the availability of data, updating results from earlier studies, and provides the first study that systematically analyses nutritional content across such an extensive and diverse of set of restaurants. Research questions are:
1. What is the availability of data on standard menu offerings at major US chain restaurants?
2. What are the energy and nutrient levels of these menu offerings?
3. How do these levels relate to restaurant characteristics, existing state/local labelling laws or trans fat bans, and ease of data accessibility?
4. What proportion of items appears to meet restaurant industry-supported and government-issued nutrition criteria? ‘Sodium’, as used throughout the present paper, refers to table salt, which is predominantly NaCl.
Methods
Study population
The study population was identified by the 2009 Restaurants & Institutions magazine's list of the top 400 US chain restaurants based on 2008 sales(16). These restaurants combined had 206750 US outlets, representing approximately one-third of all US restaurant outlets in 2010 based on analysis from the InfoUSA database(17).
Data collection
Data were collected from February to May 2010 by reviewing restaurant websites for nutrition information. The data collection time frame overlaps with when the menu labelling provision of the ACA was passed (March 2010), but federal implementation rules were still pending in early 2012. When the website did not provide this information, an email request was sent to request it. Restaurants were counted as having complete nutrition information available if energy was listed for the majority of standard menu items. Information for selected nutrients and sodium was also collected when available: total fat, saturated fat, trans fat, total carbohydrates, sodium and protein. Data that were inconsistently reported (e.g. serving size, sugar, fibre and vitamins) were excluded. Restaurants classified as not having complete information: (i) did not offer a standard preparation for at least 50 % of menu items (e.g. menu based fully on ‘build-your-own’ customizations; n 5); (ii) only provided information for a minority of the menu (e.g. ‘healthy choices’ only; n 20); (iii) did not provide information on the website nor provide contact information to request it (n 4); or (iv) did not provide information on a website nor respond to an email request for it (n 126). Complete nutrition information was available for 245 (61 %) restaurants, representing 176 711 (85 %) outlets in the initial study population. Characteristics of the 155 (39 %) restaurants (representing 30 039 (15 %) outlets) not providing complete nutrition information are described in the Results section.
Nutrition information was entered following implementation guidelines for California's menu labelling law(18) where possible (as proposed federal guidelines were not published at the time of data entry). A key feature was that values represent the restaurant-defined single serving size for an item's standard preparation. The entire item was entered as a single serving if not specified otherwise. Add-ons/toppings and condiments were excluded unless served as part of the item's standard preparation, and alcoholic beverages were excluded. Every individual unique item and size on the standard and children's menu for selected item types (main entrée; appetizer; side; salad; salad dressing; soup; dessert/baked good specialty non-alcoholic beverage) was coded. If items had customization options, the high and low energy values were entered as separate menu items. Catering platters and family size items were excluded unless individual serving portions were noted. Items not designed for individual in-restaurant consumption were excluded (e.g. whole pies).
Indicator variables were created to compare distinct nutrition criteria (Table 1): the National Restaurant Association-supported Healthy Dining and Kids LiveWell criteria for energy, fat, saturated fat and sodium(19), and one-third of the US Department of Agriculture (USDA) 2010 Dietary Guidelines(20). For USDA estimated energy needs, a daily threshold of 8368 kJ/2000 kcal was used as the basis for adults; for children aged 4–8 and 9–13 years, the mid-range average for moderately active females and males for each respective age group was used (6694 kJ/1600 kcal and 7950 kJ/1900 kcal)(21). Taking one-third of the USDA RDA is a conservative benchmark for a single meal, as Americans report about five eating occasions per day, typically three main meals and two snacks(Reference Popkin and Duffey22), and fast-food restaurant visitors order an average of 2·4 menu items(23). It closely follows the 32 % USDA benchmark for children's dietary intake used in the Yale-Rudd Center Fast Food FACTS report(Reference Harris, Schwartz and Brownell14) and the Institute of Medicine Committee on School Meals National School Lunch Program recommendations(24), although school lunch recommendations use different age groups and higher energy and nutrient levels in order to ensure adequate intake. Unlike school lunches which are complete meals, the present study calculated per single serving size for a main entrée, rather than for a typical meal ordered (such information is not available from the data).
Table 1 Comparison of Healthy Dining, Kids LiveWell and US Department of Agriculture (USDA) nutrition standards

n/a, not applicable.
†Excludes specific ingredient criteria (e.g. inclusion of whole grains, lean meats), for which data were not collected.
‡Represents one-third of estimated daily energy needs and recommended daily intake (RDA) limits for each group. USDA criteria were applied to main entrées only, which were recorded as à la carte items whenever possible.
§Excludes criterion for percentage of energy from total sugars, for which data were not collected.
∥No specific limit recommended other than ‘as little as possible’. The analysis used <1 g as a benchmark.
Data on restaurant characteristics come from two secondary sources: (i) the Research Report for Foodservice (based on the Restaurantchains.net database), a tri-annual telephone survey of restaurant executives, provided data on restaurant operating characteristics(25); and (ii) the InfoUSA 2010 business database provided outlets by location(17). Finally, a literature review was conducted to identify menu labelling laws and trans fat bans at the city, county and state levels that were effective prior to data collection and might influence the formulation of restaurant menu offerings(26–29). The analytic variable is the percentage of a restaurant's outlets subject to such laws.
Statistical analysis
Analysis was done using the Stata/IC statistical software package version 10·1 (StataCorp LP, College Station, TX, USA). In addition to descriptive statistics, a logistic regression model analysed whether or not a restaurant provided complete energy information (as the dependent variable) as a function of restaurant characteristics. For restaurants with complete nutrition information, energy and nutrient values of main entrées were analysed using ordinary least-squares multivariate regression with robust standard errors and clustered residuals by restaurant, with no weighting by number of outlets. Main entrées with energy content less than 418 kJ/100 kcal or greater than 20 921 kJ/5000 kcal were excluded; despite being listed as main entrées, those items typically represented substantially less/more than a full meal for one individual (e.g. one chicken wing or fifty chicken wings).
Independent variables were restaurant characteristics (meal periods offered; service model; cuisine type; national outlet count), degree of web-based information accessibility (readily accessible in one page/file; requiring multiple clicks to view information per item; requiring an email request for information) and percentage of the restaurant's outlets subject to an existing menu labelling or trans fat policy. Outlet count was analysed as a decile-level variable, probably a more robust data specification than outlet counts, which had a highly skewed distribution owing to a few restaurants with a very large number of outlets.
Results
Restaurant characteristics
Characteristics for the initial study population are shown in Table 2. By service type, family style accounted for the most brands, but fast food accounted for the most outlets. By cuisine, the largest number of brands served American cuisine, but the largest number of outlets served snacks, burgers or sandwiches (although American cuisine was fourth). The reason is that the number of outlets varies by service type and cuisine.
Table 2 Initial study population composition by brand, outlet count and subgroup-specific non-reporting rate
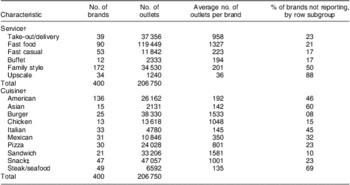
†Service types and cuisines as reported by Restaurantchains.net database. Service type examples: take-out/delivery (Auntie Anne's, Ben and Jerry's), fast food (KFC, Burger King, McDonald's), fast casual (Au Bon Pain, Panera Bread), buffet (Golden Corral, Sizzler), family style (Denny's, Marie Callender's, Red Lobster), upscale (Capital Grill, Morton's).
‡For example, bakery, café, coffee, ice cream, frozen yoghurt, smoothie restaurants.
Predictors of information accessibility
Logistic regression analyses were used to estimate the odds ratio of reporting nutrition information at the P < 0·05 significance level, using the initial study population of 400 restaurants to compare those that did not report complete information with those that did. By service type, fast casual restaurants had significantly higher odds (OR = 3·06, 95 % CI 1·08, 8·65) of providing nutrition information than fast-food restaurants and upscale restaurants were significantly less likely to do so (OR = 0·21, 95 % CI 0·05, 0·92), with no significant differences by other service types. By cuisine, burger and sandwich restaurants had significantly higher odds (OR = 7·16, 95 % CI 1·47, 34·84 and OR = 7·61, 95 % CI 1·44, 40·19, respectively) of reporting information compared with American restaurants, with no significant differences by other cuisine types. Decile of outlet count was significant at P < 0·001 (OR = 1·30, 95 % CI 1·17, 1·45); larger chains were more likely to provide information. Surprisingly, existing state/local menu labelling laws had no independent effect. Having more outlets subject to trans fat bans had a significantly higher odds (OR = 1·03, 95 % CI 1·02, 1·04), but the magnitude was negligible (data not shown).
Energy and nutritional content of menu offerings
Descriptive statistics for the energy and nutrient levels of menu items, by type, are shown in Table 3. The data included 30 923 unique menu items (29 531 regular and 1392 children's menu items) from the 245 restaurants that provided information. All items required energy values to be included, but nutrient values were reported less consistently (trans fat in particular).
Table 3 Energy and nutritional content of chain restaurant menu offerings

CHO, carbohydrates, P25, 25th percentile; P50, median; P75, 75th percentile.
†Represents à la carte items whenever separate values were provided; may include some combination meals when à la carte nutritional values were not provided.
‡Includes dressing values only when a single dressing is offered as the standard preparation, per data entry protocol; otherwise does not include dressing.
§Excludes common soft drinks (e.g. Pepsi/Coke), plain coffee/tea and alcoholic beverages.
∥Includes miscellaneous baked goods not labelled as sides (e.g. rolls, bagels, breakfast pastries, cookies).
¶The value of the corresponding regular menu item type is lower than the children's menu.
For regular menu items, appetizers stand out as having the highest values of energy, fat, saturated fat and sodium compared with all other menu item types, even main entrées. Salads combined with dressing values had nutrient values approaching those of main entrées. Quartiles are also shown. The 75th percentile, for example, means that one in four appetizers exceeds 4795 kJ/1146 kcal and 2660 mg sodium, and that one in four main entrées exceeds 3724 kJ/890 kcal and 2000 mg sodium.
Children's menu items are expected to have smaller portions, and thus be lower in nutritional content than the corresponding regular menu item type. For the most part this was true, the glaring exception being beverages. Children's menu specialty beverages had more energy, fat, saturated fat and carbohydrates at most percentiles than specialty, non-alcoholic regular menu beverages.
Figure 1 illustrates how selected item types might fare against the restaurant industry-supported Healthy Dining and Kids LiveWell nutrition criteria, for regular and children's menu items, respectively. This analysis estimates maximum percentages of items that would pass, as it did not include ingredient criteria, for which data were not available. For regular menu items, up to 42 % of main entrées, 39 % of sides, 16 % of desserts and 6 % of appetizers might pass the Healthy Dining standards. Children's menu items did not fare as well with Kids LiveWell standards, with a maximum of 11 % of main entrées and 33 % of sides passing, not taking into account ingredient criteria.
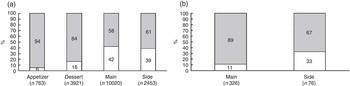
Fig. 1 Menu items meeting ( $$$$) or not meeting (
 $$$$) nutrition criteria by item type: (a) Healthy Dining criteria, regular menus; (b) Kids LiveWell criteria†, children's menus. †Sample size is reduced as analysis includes only menu items with data reported for all nutrition criteria. Data were not available on percentage of energy from sugar (for Kids LiveWell standards) or ingredients (e.g. item includes whole grains, fruits and vegetables, for both standards), so the percentage of items approved estimates maximum possible values
Figure 2 compares main entrées against the conservative benchmark of one-third of the USDA guidelines. Children's menu main entrées are compared with one-third of the USDA estimated energy intake and RDA values for two age groups defined in the USDA dietary guidelines; adolescents’ needs are similar to adults' needs. The majority of main entrées fell within estimated energy needs for adults (57 %) and children (67–80 %), but fewer fell within RDA limits for fat and sodium. When main entrées were assessed to see if they fell within estimated energy needs and RDA for fat, saturated fat and sodium simultaneously, a much smaller proportion fell within these limits (between 3 and 4 % for adults and 8 and 11 % for children), compared with Healthy Dining and Kids LiveWell criteria. The finding suggests that the actual percentage of complete meals that meet nutritional criteria as well as energy needs, as typically consumed, is likely to be very small.

Fig. 2 Main entrées meeting ( $$$$, within recommended limit) or not meeting (
 $$$$, above recommended limit) subgroup-specific values of one-third of the US Department of Agriculture (USDA) estimated daily energy needs and RDA: (a) individual nutritional values†‡§; (b) across multiple USDA guidelines (energy, sodium and percentage of energy from fat/saturated fat§). †2791 kJ = 667 kcal; 2230 kJ = 533 kcal; 2649 kJ = 633 kcal. ‡USDA recommendation for trans fat is ‘as little as possible’; ≤1 g was used as a benchmark. §Values for children were assessed against children's menu main entrées
Predictors of energy/nutritional content for main entrées
Table 4 shows the results of the regression of item-level energy and nutrient variables v. restaurant-level variables for main entrées. Depending on the outcome measure, the model's R 2 explained between 12·9 % and 21·5 % of the total variation.
Table 4 Linear regression: energy and nutrition
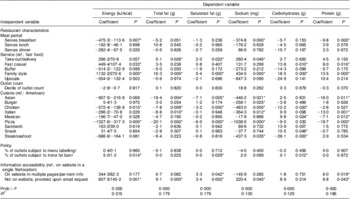
ref., reference category.
*P < 0·05.
†Scale: 0–100.
Across all outcome measures, family-style restaurant menu items consistently had significantly higher levels of energy, fat and sodium compared with fast-food restaurants, and coefficients were large. Fast casual restaurant menu items also had significantly higher energy levels on average, but not significantly higher levels of fat or sodium. The menus for restaurants serving breakfast had lower energy, sodium and protein levels, on average. Pizza and chicken restaurant menu items had significantly lower levels of most nutrients compared with American restaurant menu items. Most cuisines had significantly lower levels of sodium than American, with some large effect sizes.
While the regression analysis is limited to restaurants providing nutrition information, there were differences in how easily information could be accessed online. Restaurants that only provided information upon email request had significantly higher energy and nutrient values than those that provided the information on their website in a readily accessible single file or page. There was no significant effect for the proportion of outlets subject to a state/local labelling policy, and while coefficients for the proportion of outlets subject to a trans fat ban were significant, their magnitude was essentially zero.
Discussion
The present paper provides a snapshot of the availability of nutrition information and nutritional content of menu offerings among the largest US restaurant chains just before the ACA mandate that required nationwide menu labelling of energy (calories). Prior research has documented the impact of restaurant dining on overall diet quality(3, Reference Guthrie, Lin and Frazao30) and nutritional content in selected fast-food restaurants(Reference Harris, Schwartz and Brownell14), but none has systematically sampled this many restaurants across such diverse service types and cuisines.
One reason for the absence of prior studies was the lack of nutrition information in the past. Harnack found that only three of fifteen table service restaurants provided complete nutrition information on their websites in 2004–2005 and no restaurant without website information provided it upon email request(Reference Harnack13). Wootan and Osbourn found that 44 % of US chains in the Restaurant & Institutions magazine list reported complete nutrition information on websites in 2004(Reference Wootan and Osborn12), compared with the present study's 61 % in 2010. The increase may stem from enhanced website content, consumer demand for information and state/local laws requiring nutrition information. The present study updates and expands on prior research by reporting on how nutrition information accessibility varies by cuisine and service type, finding evidence that restaurants making information less readily accessible also have menus that are higher in energy, fat and sodium.
Although the present study provides a more extensive measure of nutritional content in the largest US chain restaurants than previously available, there are multiple limitations. Because data were intentionally collected prior to complete ACA implementation, the self-reported and usually web-based nutrition information was not subject to standardized format requirements and is likely to have variable accuracy. The restaurants studied capture a large share of the market, but large chains are obviously not representative of the universe of all restaurants. One market research group estimated that 37 % of restaurant brands are independents, not chains or non-commercial operations(31). Individual restaurants and small chains may offer food with systematically different nutritional content, but they are not subject to menu labelling laws. We cannot comment on nutritional content for restaurants that did not make information available. Even among the largest US restaurants, those with fewer outlets and those considered ‘upscale’ (e.g. Legal Sea Foods, Ruth's Chris Steak House) are less likely to report data. Upscale restaurant websites often noted that accurate nutritional analysis was not possible, due to customizations and less strictly standardized food preparation methods. Results for upscale restaurants and trans fat levels should be viewed with caution, due to high non-reporting rates and thus probable reporting bias. Finally, comparison with Healthy Dining and Kids LiveWell standards was based on available data, which notably did not include sugar or ingredients – additional criteria needed to determine whether items fully met those standards. The proportion of menu items characterized as meeting those standards is therefore higher than it would be if full data were available.
The present study describes energy and nutrient levels of menu offerings in order to provide a baseline set of values on the critical supply-side issue about what restaurants offer, but it is not a study of how menu offerings affect demand, choice or dietary quality. It did not evaluate the influence of price, marketing or bundling/combination meal strategies, which are known to be highly influential(Reference Glanz, Resnicow and Seymour32, Reference Saelens, Glanz and Sallis33), or ordering/intake patterns(Reference Dumanovsky, Nonas and Huang34). The present study analysed items without weighting either by sales or outlets, although restaurants with more outlets will have a bigger impact on the American diet.
Main entrées appear surprisingly low in energy when viewed à la carte and on a per-serving basis, but nevertheless have high levels of sodium or saturated fat. This may be an artifice of restaurant-determined single serving size, and also must be interpreted in light of what is typically ordered and consumed at restaurant meals. Dumanovsky et al. found that in three fast-food restaurants, only 19·4 % of purchases were single items, whereas 70·9 % of purchases were dollar meal menu combinations of two or more items(Reference Dumanovsky, Nonas and Huang34). Market research data found that fast-food patrons order 2·4 menu items, on average, and that only 21 % of children aged 6–12 years order kids’ meals at fast-food restaurants(23). That gives more cause for alarm, given the high sodium content in individual items. How people combine items may also differ across restaurant types and combination orders are likely to be different in family style restaurants compared with fast-food restaurants.
There were significant differences in nutritional content of menu items, particularly for some service types and cuisines. Some may be reporting artifices and reflect a limitation of how restaurants report data, including self-determined serving sizes (e.g. appetizers reported as multiple servings in some restaurants but not all). In particular, some pizza and fried chicken restaurants had surprisingly low energy content in main entrées because they used unusually small serving sizes (e.g. one slice of pizza, one chicken piece). This provides a clear indication that serving sizes need to be standardized for menu labelling to offer meaningful comparisons. There is less ambiguity in the finding that family-style restaurants offer items substantially higher in energy, fat and sodium. This may be due to larger portion sizes and/or higher energy density. Larger portion sizes can contribute to higher energy intake and weight gain over time in adults and children(Reference Duffey and Popkin35–Reference Kelly, Wallace and Robson39). Family-style restaurants and, independently, American cuisine also offer main entrées with higher sodium levels. sodium intake in the USA is far higher than USDA-recommended levels, generating substantial social costs due to morbidity and excess health-care expenditures(Reference Palar and Sturm40).
While children's main entrées were lower in energy than regular menu ones, as they should be, children's menu specialty beverages were often dessert-like, sugary items such as milkshakes. They typically had more energy, fat and saturated fat than non-alcoholic, regular menu specialty beverages, which included more smoothies, coffee and tea specialty beverages. Over the past few decades, beverage-only snacking occasions have increased considerably in children(Reference Popkin and Duffey22), and the percentage of energy intake from beverages increased in non-Hispanic black 12–19-year-olds(Reference Kant and Graubard41). School-based policies targeting sugar-sweetened beverages have focused on soft drinks and vending machines; the present study provides data about specialty beverages served in restaurants.
The present data also show that the proportion of items meeting USDA, Healthy Dining and Kids LiveWell criteria is: (i) highly sensitive to specific criteria (e.g. a generous sodium threshold); (ii) substantially lower when nutrient values are considered in addition to energy; and (iii) potentially very different for USDA v. Healthy Dining and Kids LiveWell. Healthy Dining's sodium limit of 2000 mg per main entrée could allow intake of up to 6000 mg sodium/d across three meals – 2·6 times the USDA RDA for adults and four times that for adults with low sodium needs – without considering other items ordered. Many items met a single nutrition criterion, but far fewer satisfied multiple criteria. Thus, many items that may be perceived as falling within USDA-recommended levels based on energy alone, which is the only value that will be added to menus under ACA, would not meet other nutritional standards. Finally, a much larger proportion of main entrées could meet Healthy Dining and Kids LiveWell criteria, compared with one-third of the USDA RDA limits, suggesting that restaurant industry-supported criteria are more generous than government-established ones. Although comparisons were based on partial data (e.g. without sugar, ingredients), it is clear that restaurant industry-supported criteria differ from USDA ones – particularly for sodium. The Healthy Dining and Kids LiveWell logos are used on many chain restaurants’ menus to highlight ‘healthy choices’, but they provide a vastly different picture from USDA guidelines. Misleading health claims used by grocery manufacturers on front-of-package labelling has been a concern for federal regulators(Reference Pomeranz42). The present study provides evidence that restaurant industry labelling also deserves further discussion.
Conclusions
There is not compelling evidence that labelling alters individual choices from a fixed menu, but restaurant menus change over time, and the present study provides baseline data just before national labelling laws came into effect that can be used to assess such changes. Many restaurant menu items are high in fat, saturated fat and sodium, and restaurant industry-supported logos used to highlight ‘healthy choices’ are more generous than USDA recommendations, particularly for sodium. Menu items that appear reasonable based on energy alone must be considered within the context of an entire meal and for other nutrient values. Sometimes those extras, such as children's specialty beverages, are problematic.
Acknowledgements
This research was supported by grant #68302 from Healthy Eating Research, a national programme of the Robert Wood Johnson Foundation, and by the JL Foundation. The authors have no conflicts of interest to report. H.W.W. conceptualized the study and obtained funding, designed the study, collected and analysed data, and wrote the initial manuscript. R.S. contributed to the proposal and study design, oversaw the statistical analysis, and revised the manuscript. The authors greatly appreciate the data gathering assistance provided by Adrian Overton and analysis support provided by Adam Gailey.



