


Obesity levels are rising in almost all parts of the world(Reference Wang and Lobstein1), with increasing concern at its prevalence within the UK(2). School-based dietary interventions have been shown to be effective in improving children's diets and in reducing obesity in schoolchildren(Reference Campbell, Waters and O'Meara3). The importance of school food (defined as ‘all food and drink provided to students by schools’) has been highlighted. Children can acquire 25–33 % of their total daily energy through school food(4).
There has been a school food service in the UK since 1906, with nutritional standards applying since 1941. Under the Conservative government elected in 1979, the obligatory requirement for local authorities to provide school food was removed, as was the obligation to meet any nutritional standards. In 1980 school catering services began to operate under free market principles, with students choosing to eat foods high in fat, salt or sugar that were on offer. Mounting concern about the effects of these policies on children's diets led in 1992 to the School Meals Campaign(Reference Gustafsson5) and the widely accepted Caroline Walker Trust Nutritional Guidelines for School Meals (defined as ‘food available for consumption by a student as a midday meal on a school day’)(6).
In 1997 school food provision was improved in the UK(7), and compulsory standards were introduced in 2001 providing students with the opportunity to eat healthier school food(8). Following the introduction of these standards, a national study(Reference Nelson, Bradbury and Poulter9) showed that over half of the food choices of students at lunchtime consisted of high-fat main dishes, chips and potatoes cooked in oil and soft drinks. Further, 38 % of schools with snack vending (containing confectionery) and 44 % with cold drinks vending (containing soft drinks) had machines in dining rooms, providing unrestricted student access. Lack of restriction for less healthy options within the 2001 guidelines was assessed as a key factor in explaining why student diets did not subsequently improve(Reference Nelson, Lowes and Hwang10).
School vending has been identified as an important area of concern, since vending machines provided the second most common source of food in English secondary schools after school meals(Reference Nelson, Bradbury and Poulter9). Studies have shown that foods vended in schools, generally high in fat, salt or sugar (A Devi, unpublished results)(Reference French, Story and Fulkerson11, Reference Matthews, Devi and Rayner12), consist typically of confectionery, savoury snacks and high-sugar soft drinks. There is evidence that such vending provision can affect children's diets in a number of ways. For example, research conducted in the USA has suggested that if less healthy vending is available consumption of school lunch is reduced(Reference Hutchinson, Brown and Gilmore13). Thus, vending in schools may contribute to an increased risk of obesity in children through the provision and promotion of energy-dense, nutrient-poor foods(Reference Lobstein, Baur and Uauy14), although for English schools such vending held considerable financial benefits(16).
The 2004 White Paper on Public Health(16) and subsequent action plan(17) set out the UK Government's commitment to improving food in English schools, which culminated in legislation introducing new food standards (referred to from here as the New Standards) to be implemented by the School Food Trust(18). The New Standards consisted of interim 2006 food-based standards for school lunches (finalised in 2009 along with nutrient-based standards)(19) and 2007 food-based standards for school food other than lunch(20). The effect on school vending was the prohibition of the provision of confectionery, savoury snacks and flavoured water. In addition, soft drinks (including fizzy drinks) containing <50 % fruit or vegetable juice and drinks containing >5 % added sugar were also prohibited. Of interest, therefore, was to discover the extent to which the New Standards had an effect on vending provision.
The present research – a 3-year survey of a representative sample of English secondary schools – had two aims: first, it sought to assess the effects of the introduction of the New Standards on participating schools with respect to the proportion with vending machine provision (aim 1a), the number and type of vending machines (aim 1b), the nutritional quality of vended products (aim 1c) and the degree of compliance of food- and drink-vended product types (aim 1d); and second, it examined attitudes and experiences related to the implementation of the new legislation during Year 3 of the research.
Methods
The analysis provides findings that describe vending provision in English secondary schools during Year 3 (the second year of the New Standards), and investigates change in that provision compared with baseline (the year preceding the introduction of the New Standards). The focus of the present paper is to explore the response of schools to the changes in provision. A further paper focusing on the quantitative analysis undertaken in the present research is in preparation. Table 1 provides a research time frame and the methods used. Research approval was obtained from the University of Oxford, the School Food Trust and from the head teacher of each school participating in the research.
Table 1 Research data collection schedule

Postal survey
The postal survey took a nationally representative sample of 420 secondary schools in England, having estimated that 250 recruited schools would be necessary to generate results of statistical significance and allowing for a two-thirds response rate. Schools were selected randomly from a sampling frame of 3281 potential secondary schools. The DfES Edubase, a register of all educational establishments in England and Wales maintained by the Department for Education and Skills, was used to identify these schools. The sample was stratified and ordered according to Edubase variables – government region, school type, admissions policy and gender. A sampling interval was calculated and administered after generating a random starting point. Schools were approached in November 2006 by letter to the head teacher and catering manager. Returned surveys formed the baseline data at Year 1.
As Table 1 shows, the schools were surveyed again in Years 2 and 3. A total of 279 schools replied at baseline (66 % response rate), and, of those, 231 responded at Year 3 (82·7 %), which represents 55 % of schools originally sampled. The responding schools remained broadly representative of the 420 school samples at baseline, and at Years 2 and 3, when examined by Government region. The baseline data shown in Table 3 indicate that at the time of recruitment the vast majority of schools with drinks vending (this included nearly all schools with vending) were non-compliant, indicating that schools were not showing good practice before implementation and therefore were giving no indication of any particular bias towards supporting aims inherent within the New Standards.
Inventory survey
From the 279 responding schools with vending at baseline, sixty-two were randomly selected from an inventory sample of seventy-seven that had indicated they would agree to be involved in this way. Recruitment was restricted to this number by resource constraints. Twenty-nine schools remained in the sample at Year 3, which was 47 % of the sixty-two schools originally sampled. At Year 3, the responding inventory schools remained representative according to Government region of the ninety-five remaining postal survey schools (see Table 2), apart from a slight over-representation in two government regions.
Table 2 Number and percentage of schools and machines vending different types of products

*Food, cold drinks or hot drinks vending or any combination of these types.
Data analysis
Research aims 1a and 1b (see introduction to the present paper) were addressed by analysing the surveys received under the following protocol.
1. Using Excel, extract the following school survey data: whether the school has vending, the number of machines, type of products vended by each machine (food, cold drinks, hot drinks).
2. Produce descriptive statistics of these data for each year, including trend data showing change between Years 1 and 3 (Table 2).
Research aims 1c and 1d (see introduction to the present paper) were addressed by analysing product nutritional information. Ascertaining the compliance status of a product (e.g. milkshake) required attention to its ‘type’ (e.g. milk product) and the ‘percentage of key nutrients’ (e.g. ≤5 % added sugar). Analysis used the following protocol.
1. Retrieve nutritional information from labels of products purchased during inventory visits, Internet searches or by contacting manufacturers(21, 22).
2. Using Excel, enter the following nutritional information: pack size, sugar (including added sugar), fat, fruit and milk percentages, additive content and added salt.
3. Weight each product according to the frequency with which it was observed within schools. The unit of observation was ‘the school’, not the number of vending machines within each school.
4. Categorise products according to type of product on the basis of the Eurocode 2 Food Coding System(23).
5. Using nutritional information entered earlier, classify foods as ‘Allowed’ or ‘Not allowed’ according to the New Standards(20) in order to provide descriptive statistics of the changes in provision between Years 1 and 3: the change in provision by the percentage of ‘not allowed’ vended products observed in each school (Tables 3 and 4); the change in provision by the Eurocode categories of vended products observed in all schools (Figs 1 and 3).
Table 3 Breakdown of schools by the percentage of drinks not allowed

*Excluding hot drinks.
†The categories are divided into percentage segments of ‘Not allowed’ drinks observed in each school.
‡Number of inventory schools with drinks vending/all inventory schools. Percentages based on number of schools with drinks vending.
§Percentages have been rounded up or down.
Table 4 Breakdown of schools by the percentage of foods not allowed
*The categories are divided into percentage segments of ‘Not allowed’ foods observed in each school.
†Number of inventory schools with food vending/all inventory schools. Percentages based on number of schools with food vending.
‡Percentages have been rounded up or down.
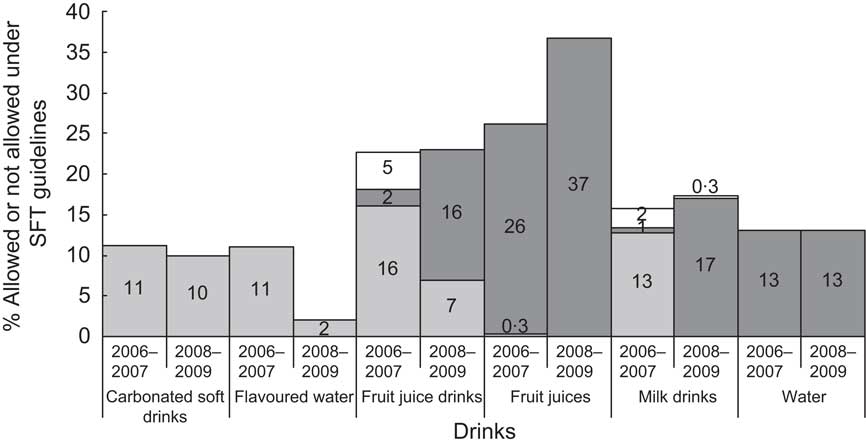
Fig. 1 Percentage of drinks allowed or not allowed under Government (i.e. School Food Trust, SFT) standards, baseline and Year 3 (
, ‘Unclassified’ drinks; , ‘Not allowed’ drinks; , ‘Allowed’ drinks; number of baseline product observations = 618; number of Year 3 product observations = 326; percentages have been rounded up or down)6. Further descriptive statistics were undertaken to give a breakdown of vending provision at Year 3 when categorised by sixth form and non-sixth form location within schools (Figs 2 and 4).
Fig. 2 Percentage of drinks allowed or not allowed under Government (i.e. School Food Trust, SFT) standards at Year 3, comparing sixth form and non-sixth form locations (
, ‘Unclassified’ drinks; , ‘Not allowed’ drinks; , ‘Allowed’ drinks; number of schools with non-sixth form machines = 24; number of schools with sixth form machines = 9; five schools had machines in both categories; percentages have been rounded up or down)


A further categorisation method using nutrient profiling model WXYfm developed by the British Heart Foundation Health Promotion Research Group, University of Oxford(Reference Rayner, Scarborough and Boxer24), was also used. Comparisons between this method and the food categories outlined by the New Standards will be reported in a following paper.
Interviews
Twenty-three of the twenty-nine inventory schools agreed to take part in the interviews. In each of these twenty-three schools, face-to-face interviews were conducted with a key member of staff responsible for vending in each school, largely catering managers. All interviews were semi-structured using an interview schedule and protocol, and conducted following the completion of vending machine inventories by the researcher, usually lasting about 20 min. Nvivo qualitative data analysis software version 8 (QSR International Pty Ltd, Melbourne, Australia) was used to handle the data, which were then analysed using ‘analytic induction’(Reference Taylor and Bogdan25) in searching for common themes and categories.
Results
Nature and extent of vending
Table 2 shows that of the 231 schools that sent back the postal survey at Year 3, ninety-five reported they had some form of vending. During the study, cold drinks and food vending declined whereas hot drinks vending increased.
Each year, schools were asked about their reasons for either providing vending or not providing vending. Among those schools that had vending, ‘helps to keep students hydrated’ showed an increased percentage as the most popular answer (64 % at baseline, 71 % at Year 3), with the answer ‘vending provides valuable income’ seeing a reduction from 39 % at baseline to 28 % at Year 3.
Quality of drinks vending provision
School provision of vended drinks
Of all products in the inventory, drinks products took a greatly increased share over food products – 44 % of all products at baseline and 64 % at Year 3 (P < 0·0001). Table 3 shows a substantial degree of change, with most drinks vending schools having compliant provision at Year 3.
Nutritional quality of vended drinks: compliance within the school environment
Figure 1 shows that the vast majority of drinks currently present in schools are ‘allowed’ under the New Standards – 82 % of all drinks, compared with 42 % of all drinks at baseline (P < 0·0001). The greatest degree of change between baseline and Year 3 relates to: (i) the increasing proportion of fruit juices offered and (ii) the increasing compliance of fruit juice drinks and milk drinks (referred to by the School Food Trust as ‘combination drinks’)(20). The appearance of new brands and flavours within these categories (e.g. 31 % of all fruit juices at Year 2) and re-formulation of some drinks, whether by re-branding or reducing added sugar, suggest that the legislation may have had an impact on manufacturers.
Figure 2 shows that at Year 3 the vast majority of compliant vended drinks was situated in non-sixth form settings, i.e. all machines in schools excluding those in the sixth form departments of those schools – 94 % compared with 51 % in sixth form machines.
Quality of food vending provision
School provision of vended foods
Of all products in the inventory, food products took a greatly decreased share over drinks products – 56 % of all products at baseline and 36 % at year 3 (P < 0·0001). Between baseline and Year 3, the number of drinks products dropped by half, whereas the number of food products dropped by three-quarters. Table 4 shows that schools with food vending had moved towards compliance between baseline and Year 3, but not to the same degree of change as with drinks.
Nutritional quality of vended foods: compliance within the school environment
Figure 3 shows that under one-third of vended foods were ‘Allowed’ under the New Standards (29 % at Year 3 and 14 % at baseline; P < 0·0001). ‘Not allowed’ Eurocode categories of chocolate confectionery, non-chocolate confectionery and savoury snacks slightly reduced their proportions, although cereal bars (69 % at Year 3 and 54 % at Year 2) remained, whereas other non-chocolate confectionery products were removed. There was some evidence of manufacturers responding to the legislation by offering new brands (e.g. 37 % newly observed fruit and dried fruit products at Year 2 and 21 % at Year 3).

Fig. 3 Percentage of foods allowed or not allowed under Government (i.e. School Food Trust, SFT) standards, baseline and Year 3 (![]() , ‘Unclassified’ foods;
, ‘Unclassified’ foods; ![]() , ‘Not allowed’ foods;
, ‘Not allowed’ foods; ![]() , ‘Allowed’ foods; number of baseline product observations = 787; number of Year 3 product observations = 183; percentages have been rounded up or down)
, ‘Allowed’ foods; number of baseline product observations = 787; number of Year 3 product observations = 183; percentages have been rounded up or down)
Figure 4 shows that at Year 3 the majority of compliant foods was situated in non-sixth form machines (63 %) compared with 3 % in sixth form machines. Therefore, not only was sixth form vending less compliant than vending in other school locations but, within sixth forms, vended food was less compliant than vended drinks.

Fig. 4 Percentage of foods allowed or not allowed under Government (i.e. School Food Trust, SFT) standards at Year 3, comparing sixth form and non-sixth form locations (![]() , ‘Unclassified’ foods;
, ‘Unclassified’ foods; ![]() , ‘Not allowed’ foods;
, ‘Not allowed’ foods; ![]() , ‘Allowed’ foods; number of schools with non-sixth form machines = 8; number of schools with sixth form machines = 5; one school had machines in both categories; percentages have been rounded up or down)
, ‘Allowed’ foods; number of schools with non-sixth form machines = 8; number of schools with sixth form machines = 5; one school had machines in both categories; percentages have been rounded up or down)
Interviews
The qualitative interview data collected during Year 3 focused on how schools managed the implementation of the New Standards. Success seemed to depend on a number of related factors – managing the products, perceptions of food vending, school structures and the culture of food mediated within and beyond the school environment.
Product compliance: effective understanding and sourcing
Although initiatives such as the Healthy Schools Programme and internal school policies were influential, motivation to adopt healthier vending was mainly due to the New Standards, effectively communicated by the School Food Trust (fifteen of the twenty-three interviewees).
Only sixteen of the twenty-three interviewees knew that the New Standards applied to students in sixth form departments, and only three out of twenty interviewees knew the School Food Trust's Voluntary Code of Practice for Drinks (three of the twenty-three interviewees were not asked this). The interviews revealed the way some schools misunderstood which products could be vended. In the light of this finding, it is unsurprising that vending suppliers’ product lists were thought to be helpful (eleven of the twenty-three interviewees), with some schools regarding them as a reliable offering of permitted products
She [the soft drinks representative] wouldn't pitch them [range of drinks] to me if we weren't allowed to use them. They're all very good and they've made our job a lot easier.
Catering Manager, School H
Successful product compliance was also related to availability. One catering manager saw the broadening of permitted drinks product ranges as an effect of the legislation
When the government intervened [with the New Standards], more schools had to do it, therefore demand was greater, therefore choice was improved, because other manufacturers were coming out with products.
Catering Manager, School J
However, despite new and reformulated products emerging, some interviewees felt this response to be inadequate, particularly in offering compliant vended foods
…the problem was with the vending machines…Neither [of our suppliers] could supply food products that met the standards. So we decided to drop [vending].
Business Manager, School W
The viability of food vending
One explanation for why schools removed or did not adopt food vending relates to the commercial viability of compliant snack options
But the snack thing has been harder [than drinks] because it seems very limited [what is allowed]…and they're not very keen [the students] on what they call ‘bird seed’.
Facilities Manager, School S
However, schools considering turning to fresh food vending instead of snack vending ‘perceived’ rather than ‘experienced’ its economic non-viability. Despite this widespread perception within the findings, one school's experience shows that fresh food vending can operate successfully, particularly by paying close attention to student demand
One day the [chocolate] machine broke down, and I noticed that the sales went up on the mid-morning counter [selling sandwiches, salads etc]…I said I think we might be better looking at taking the sweet vender out completely and replacing it with food vending…if you try to run it side by side, you don't stand a chance because naturally they will go for the sweets… It was successful from the word go… The customer dictates what we have in it.
Catering Manager, School Q
The non-compliance of sixth form vending
School structures and hierarchies are suggested as a key factor in explaining non-compliant sixth form vending. Sixth form responsibility may be regarded and managed separately, and in the case of food provision the boundaries of responsibility may be unclear
…we're looking at other options to take the vending out of sixth form…[sixth form vending is not] solely my responsibility. The sixth form heads have a say on the vending…[the sixth form machines have] got cereal bars in but, I think I was told to put cereal bars in when we took the chocolate out…
Catering Manager, School M
In the absence of internal policy direction, senior leaders such as bursars or sixth form heads may make decisions about vending without reference to the new regulations (five of twenty-three interviewees), leaving catering managers with little power to override
…and the Bursar here wanted to make sure that his sales stayed at a positive level, so it was decided that the [sixth form carbonated soft drinks] vending would stay until he says otherwise
Catering Manager, School G
Schools with sixth form vending explained this non-compliance within wider school goals of encouraging greater sixth form student responsibility and freedom of choice
We didn't respond [to the New Standards] because as a school we have a belief that sixth form students are adult and so they should be given the freedom to manage the sixth form in the way that they would like, including the type of vending provision they have.
Bursar, School L
Thus, when responsibility for sixth form vending is not clearly delineated, predominating management structures may prevail, particularly in the absence of over-arching policy drivers or school managers with specific responsibility for overseeing appropriate change.
Successful implementation: ‘whole-school’ approaches and the wider food environment
‘Whole-school’ approaches are embedded within the notion of the ‘health promoting’ school(Reference Lister-Sharp, Chapman and Stewart-Brown26). Key features include taking a coordinated approach across the school, ensuring that curriculum and food provision are consistent, involving everyone (often through policy development) and creating working partnerships, e.g. with Healthy Schools Coordinators. Thus, schools that have successfully implemented the New Standards (ten of the twenty-three interviewees) also tended to relate this to the adoption of this approach
In that first six months when I changed that [canteen and vending] around, [staff say] ‘That's great, that.’ Now they're watching out for the school, and their involvement is taken into account and their thoughts. I have meetings every week with the catering staff, all the dining room supervisors and…the senior management team as well.
Catering Manager, School A
Positive views were not universal; however, in general, where this was the case, ‘whole-school’ approaches were absent from interviewees’ descriptions of the implementation process. Reference has already been made to the financial benefits of unhealthy vending that historically schools used to enjoy. School financial management practices can still view efforts to stimulate revenue as unrelated to wider health considerations, as shown by the following example illustrating a confusion of school aims
That [vending] revenue used to pay for our sports fixtures, so it's recycling money to the pupils. They pay for the vending [chocolate and carbonated soft drink] and we pay for their coach trips [to sporting venues]…
Business Manager, School E
Some regarded the New Standards per se as negative, evidence of the ‘nanny state’ encroaching on school management (four of the twenty-three interviewees). In schools with a health-related policy vacuum, resistance to the New Standards could prevail
… we still see chocolate wrappers in school…I've had a bit of a battle in that there are still staff who want to operate a reward scheme for students over giving them confectionery. I've pointed out that this is banned. And I've been given, ‘That's nonsense. Nanny state.’
Business Manager, School U
Within the context of loss of vending income (six of the twenty-three interviewees) and ‘black marketeering’ (three of the twenty-three interviewees), there was frustration that students still obtained confectionery and carbonated soft drinks and brought them on site – the school commercial environment was now constrained in the ‘choices’ it could offer its consumers, whereas nearby food outlets were not. Many interviewees argued that this disparity would compromise the success of the New Standards if the availability of such products was not similarly controlled outside the school gates (S Lloyd et al., unpublished results)(Reference Sinclair and Winkler27).
Discussion
The present research was undertaken under the usual constraints of time and money, and it could be argued that a relatively small number of schools participated, particularly within the Year 3 inventory sample. A further drawback was that school visits were ‘snapshots’ of vending on a given day. Nevertheless, the study does provide some evidence of the successful effect of the New Standards, implemented by the School Food Trust(28), on the provision of one aspect of school food. To summarise the key findings:
1. The nutritional quality of vending in English secondary schools has improved since the implementation of the New Standards.
2. This change is attributed to the legislative restriction of the New Standards.
3. Vending provision in English secondary schools has reduced as a result of the New Standards, particularly food vending.
4. School management structures have permitted poorer nutritional quality in sixth form vending within schools, compared with all other school locations.
5. Schools that seemed to implement the New Standards more effectively also adopted ‘whole-school’ approaches.
Research indicates that although school-based policies, practices and interventions are important in improving child health, national policy can bring into effect legislation that has the power to intervene in schools with great consistency and effect(Reference Sharma29, Reference Story, Nanney and Schwartz30). The indications of the present research would concur with that view. Such a finding resonates with the study by Nelson et al.(Reference Nelson, Lowes and Hwang10), who suggested that without legislative restriction school food would remain ‘less healthy’. Other developed countries have argued that without ‘hard’ legislative policies for school food, including vending, initiatives will be ineffective(Reference Swinburn31), as in Australia(32) and the USA where restrictions for what can be vended in schools vary between States.
An unintended consequence of a reduction in vending provision shows that such legislation is not effected in a vacuum. The non-compliance of sixth form provision shows the complexity of school organisation where multiple aims may compete. Previous research has similarly framed the ‘resistance’ of school personnel to public health food policy initiatives within this context, emphasising that other aims that might be prioritised, e.g. academic achievement and financial viability, need recognition(Reference Nollen, Befort and Snow33). Despite the New Standards for school food in England being among the most comprehensive in the world, the present study indicates the importance of understanding ‘the school’ as a system through which such legislation is mediated. For example, the success of schools using the ‘whole-school’ approach(Reference Nutbeam34) was also observed in the present research.
The present research examined the effect of legislation on the availability of foods in one particular school context, but further work is needed to indicate whether or not these changes have actually improved the student diet. Given the reduced vending presence in schools, particularly for food, it is speculated that the major contribution of these changes towards the student diet may be in forming part of a consistent health message that school food in general can now promote to students. Success in changing students' attitude and behaviour towards less healthy foods will not depend solely on implementing such legislation in schools, as here, where vending is one of the whole range of school food outlets now restricted by the New Standards. Attention should also be paid to the wider food culture outside schools to which students continue to be exposed and which provide them with numerable and accessible opportunities for less healthy food choices.
Acknowledgements
The School Food Trust funded the present research. The authors have no conflict of interest to declare. A.M., M.N., M.R. and G.C. were responsible for the study design; A.M., A.K., P.K. and G.C. were responsible for data collection; A.M. and A.K. were responsible for data analysis; A.M. and G.C. were responsible for the first and subsequent drafts and all authors for critical revision of the manuscript. The authors particularly thank the participating schools and colleagues at the School Food Trust.


