


Evidence from national and international studies demonstrates that energy-dense, nutrient-poor foods and beverages (i.e. obesogenic products) are readily available in many retail food environments( Reference Whitehouse, Simon and French 1 ), including small food stores( Reference Farley, Rice and Bodor 2 ), while healthy consumable products are not( Reference Laska, Borradaile and Tester 3 ). Obesogenic products are also accessible (i.e. ready-to-consume), thus they contribute to excess energy intake and risk for obesity( Reference Astrup, Bovy and Nackenhorst 4 ). Among children of primary school age, adolescents and adults aged 20–50 years, foods and beverages purchased from food stores accounted for 63 % of individual dietary energy across all age groups( Reference Drewnowski and Rehm 5 ). Among the top foods and beverages contributing to energy purchased were grain-based desserts and sodas, among others( Reference Drewnowski and Rehm 5 ), foods and beverages that have been identified as dietary risks for obesity( Reference Ambrosini 6 – Reference Moreno and Rodríguez 8 ). Small food stores (also known as limited assortment food stores, convenience/corner stores and ethnic stores) are all variations on a theme, being stores that are conveniently located (walkable, in close proximity) to one’s home, school and/or workplace and with sufficient product varieties to complete a fill-in or quick, single meal shopping trip( 9 ). Small food stores have become an increasingly important retail food environment, with market share increasing from 27 % in 2015 to 38 % in 2016( 9 ). However, unlike supermarkets and supercentres, they carry fewer healthy products, such as little to no fresh fruits and vegetables( Reference Laska, Borradaile and Tester 3 ). Given that small food stores are ubiquitous in low- v. high-income communities( Reference Powell, Slater and Mirtcheva 10 ), they are important intervention targets to address obesity-related health disparities( Reference Poti and Popkin 11 ).
Although findings are mixed( Reference Lawman, Vander Veur and Mallya 12 , Reference Lent, Vander Veur and McCoy 13 ), research suggests that small food store interventions are feasible to implement and effective at improving customers’ dietary knowledge, attitudes and behaviours( Reference Gittelsohn, Rowan and Gadhoke 14 , Reference Paek, Oh and Jung 15 ). Several interventions have resulted in increases in fruit and vegetable purchasing and consumption( Reference Ayala, Baquero and Laraia 16 , Reference Song, Gittelsohn and Kim 17 ). Other research supports labelling and other marketing strategies to decrease the purchase of obesogenic products, including sugary beverages( Reference Bleich, Herring and Flagg 18 , Reference Papies, Potjes and Keesman 19 ). Despite these early successes, challenges remain in understanding how best to partner with small food stores to modify the placement and promotion of highly palatable and profitable obesogenic products( Reference Monteiro, Moubarac and Cannon 20 ).
Led primarily by marketing, consumer affairs and food retail researchers, there is a body of research on the importance of food and beverage distributors and manufacturers in the sourcing, placement and promotion of products in food stores. However, with a few exceptions in tobacco( Reference John, Cheney and Azad 21 – Reference Laws, Whitman and Bowser 23 ) and more recently food and beverage products( Reference Caspi, Pelletier and Harnack 24 , Reference Cohen and Babey 25 ), public health research on the role of distributors/manufacturers in the sourcing, placement and promotion of obesogenic products is almost non-existent. Among the dominant themes of distributor/manufacturer research in food stores is the use of slotting fees and other incentives to place and promote products( Reference Achrol 26 , Reference Wilkie, Desrochers and Gundlach 27 ). Delivery of products to the store and display maintenance have been identified as important assets in these relationships( Reference Jetter and Cassady 28 ). Public health researchers, in turn, have examined the contracts that store owners have with distributors/manufacturers, comparing soft drink, candy and snack distributors/manufacturers. They found that soft drink distributors/manufacturers were more likely to give trade allowances (i.e. free goods or price reductions) compared with candy and snack distributors/manufacturers( Reference Feighery, Ribisl and Achabal 29 ). Notwithstanding this evidence, distributors are understudied in food systems research, particularly as it relates to the potential promotion of healthy foods and beverages whether by making them more available or moving the unhealthy products to less prominent locations in the store( Reference Budd, Cuccia and Jeffries 30 ). Hattersley proposed a model that considers the importance of distributors in the sourcing and placement of fresh fruits and vegetables( Reference Hattersley 31 ). However, an intervention seeking to improve access to healthy foods by working with distributors found low-to-moderate fidelity in their involvement in stocking healthy products( Reference Novotny, Vijayadeva and Ramirez 32 ). Thus, more research is needed on the importance of food and beverage distributors in the placement and promotion of products. This is urgently needed with small food stores given that they are an important retail food environment for the distribution and sale of foods and beverages in the USA( Reference Cannuscio, Tappe and Hillier 33 , Reference Sharkey, Dean and Nalty 34 ) and they are understudied in retail food environment research.
In the present study, interviews were conducted with small food store owners/managers to understand how food and beverage distributors are involved in the sourcing, placement and promotion of five obesogenic product categories: savoury snacks (i.e. chips and other salty snacks), sugary beverages (i.e. soft drinks, sports and energy drinks), sweet snacks (i.e. snack cakes and cookies), confectionery (i.e. candies and chocolate) and frozen treats (i.e. ice cream and frozen sweet desserts). Distributors refer to those individuals who source products to a store; in many cases, they are also involved in the products’ placement and promotion within the store. Distributors were examined from the store owner/manager’s perspective in two ways: (i) how frequently do distributors source their products to the stores; and (ii) what types of agreements and expectations do distributors have for placing and promoting their products in the stores? In addition, fresh fruits and vegetables were examined as a healthy product comparison category in terms of frequency of sourcing only, to better understand potential disparities in healthy food access. Finally, in exploratory analyses, we examined for differences by store size and store ethnicity. The research seeks to identify novel aspects of the food environment with the potential to influence execution of healthy food access initiatives, in order to reduce the significant racial/ethnic and socio-economic disparities in obesity risk( Reference Ogden, Carroll and Lawman 35 ).
Methods
Study design
This cross-sectional study involved a single interview with seventy-two owners/managers of small food stores. Data collection occurred between mid-October 2013 and July 2014 in four major metropolitan cities in the USA: Baltimore, MD; Durham, NC; Minneapolis/St. Paul, MN; and San Diego, CA. Cities were selected based on investigators’ experience conducting research with food stores in their communities, thus maximizing the feasibility for obtaining these sensitive data. Analyses and verification were completed from October 2014 to June 2015.
Store recruitment and data collection
Food stores were identified using two methods: (i) an enumerated list of food stores in the target geographic region based on several sources of data including business and public health databases (Durham and San Diego); and (ii) a list of food stores previously involved in research and other programming efforts (Baltimore and Minneapolis/St. Paul). A trained research associate visited each potential store and assessed initial eligibility by completing an observation checklist. Stores were eligible if they were located in a low- to middle-income neighbourhood based on US Census data and if they had three or fewer cash registers. Although important for characterizing the food environment, supermarkets, big box chains, corporate-managed convenience stores and dollar stores were not approached given potential differences in owner/manager decision-making authority( Reference Glanz and Yaroch 36 ).
Owner/manager recruitment and data collection
Stores that met the initial screening criteria underwent a second screening conducted with the owner/manager. Owners/managers were eligible if they negotiated purchase agreements with sales representatives, distributors and wholesalers themselves; if these agreements were negotiated on behalf of the approached store only; if the owner/manager had at least 1 year of experience with the store; and if he/she was at least 18 years of age. The former two criteria helped ensure that the research associate was speaking with the right person and to minimize possible variations introduced by multiple store contracts. The latter two criteria helped ensure that the owner/manager had sufficient experience with store management and could provide informed consent. Owners/managers were excluded if they refused to be audio-recorded.
If eligible, the research associate obtained informed consent and conducted the interview either immediately or at a later date. Spanish-language interview guides were used by trained, bilingual (English/Spanish) research associates to conduct five Spanish-language interviews in San Diego and a bilingual trained research associate conducted eight Korean language interviews using the English guide in Baltimore (see Table 1). Response cards were used to collect demographic information. Interviews lasted between 40 and 140 min, in part because interviews were often conducted on-site requiring the owner/manager to attend to business while the research associate waited for his/her availability. Following completion of the interview, the owner/manager received cash or a gift card valued at $US 25·00. Table 1 reports on the number of stores approached, as well as the number determined eligible, ineligible (e.g. too many cash registers) and refused during initial screening.
Table 1 Small food store recruitment and language of interview (n 72) in four urban areas in the USA, mid-October 2013 to July 2014

R, refused; NE, not eligible; U, undetermined; C, closed; I, incomplete.
† Completed/[approached – (not eligible+undetermined+closed)].
Interview guide
The interview guide was developed following several conference calls between investigators and research associates. Owners/managers responded to closed-ended questions on their relationship with these distributors. The term distributor was used to refer to the individual with whom the store owner/manager interacted in the delivery of the products to the store; however, we acknowledge that the agreements may be partly dictated by other individuals, including the manufacturers. Closed-ended questions were adapted from previous work( Reference Feighery, Ribisl and Clark 22 , Reference Feighery, Ribisl and Achabal 29 , Reference Lee, Henriksen and Myers 37 ) and revised through an iterative process of group feedback and discussion, drawing particularly from extensive previous fieldwork with small food stores( Reference Gittelsohn, Laska and Andreyeva 38 – Reference Ayala, Laska and Zenk 40 ) and a pilot test in San Diego, CA. The categories of information included in the interview guide were: frequency of sourcing the target products; types of agreements for the sourcing, placement and promotion of target products; incentives received and distributor expectations for those products and incentives, including control over displays and their placement; and store and owner/manager characteristics. To minimize respondent burden, questions about the healthy comparison of fresh fruits and vegetables were limited to sourcing. From among the variables considered, sourcing was identified as the most relevant for understanding challenges and implications for healthy food access. It also allowed us to better understand potential differences in the owner/manager–distributor relationship, at least in terms of frequency of contact, while not unduly burdening the owner/manager with a lot of questions.
Frequency of product sourcing
Owners/managers were asked if distributors delivered their products directly to the stores and if yes, how often delivery occurred: 1=annually, 2=every six months, 3=quarterly, 4=monthly or 5=weekly or more often. To reduce respondent burden, the same response options were used for all product categories despite the limited plausibility of some combinations (e.g. annual fresh fruit and vegetable delivery). Responses were collapsed into four categories: weekly, monthly, quarterly to annually, or sourced product themselves (e.g. purchased confectionery products at a big box chain store such as Sam’s Club).
For product categories that were sourced by the owner/manager or a store employee, no additional questions were asked of that product category given the emphasis on owner/manager–distributor contact. Stores not carrying a specific product category were removed from analyses involving this variable.
Types of agreements
For all product categories sourced by distributors, owners/managers were asked if they had agreements with distributors for the sourcing, placement and promotion of their products in the store. If yes, a follow-up question asked whether these agreements were informal (e.g. verbal agreement, handshake, etc.), formal (e.g. written contract) or of both types. The latter two were collapsed into the formal type.
Incentives and expectations
Owners/managers were asked about the types of incentives they received from distributors to place and promote their products in their store, including displays, free or discounted products, signage and other marketing materials, and slotting payments (fees paid to stock products usually in a prescribed location in the store). Owners/managers were also asked about what was expected of the store in exchange for the incentives they received, including price control, location control, employee promoting the product and other. In addition, owners/managers were asked to quantify how much control distributors had over placement of displays from 0=no control (i.e. ‘the sales rep is not allowed to do anything without first checking with you’) to 4=total control (i.e. ‘the sales rep decides where and how to display products in your store without your input’). For each of the product categories where at least a little control was reported over displays (responses 1 to 4), this question was followed with a second question asking about the location of the displays in question, including whether they were at the checkout, aisle shelf, end cap (i.e. end-of-aisle displays) or other locations. For sugary beverages and frozen treats, this latter location included coolers.
Store and owner/manager characteristics
A final set of questions asked about total annual store sales and whether the store was certified to serve as a Special Supplemental Nutrition Program for Women, Infants, and Children (WIC) vendor, qualifying the store to receive federally funded WIC cheques for the purchase of certain products such as fresh fruits and vegetables. Annual sales were collapsed into two categories (1=≥$US 500000 v. 0=<$US 500000) to explore whether relationships differed by store size based on sales. This categorization was based on two factors: distribution of the data (i.e. sufficient numbers to draw meaningful comparisons) and previous research. Regarding the latter, small food stores have been identified as having annual sales of approximately $US 1 million; a median split at $US 500000 allows for a more granular analysis by store size. Owner/manager characteristics included age, gender, education and years managed the store. After the interview, the research associate coded the store ethnicity into one of five categories based on the language of store signage, language used by employees and clientele, as well as types of food products: (i) not ethnicity specific, (ii) Latino, (iii) African or African-American, (iv) Asian or (v) a combination of these. Inter-rater reliability for this item was high (98–100 %) given the prominent features representing ethnicity in a store. Store ethnicity was then collapsed into 1=ethnic store v. 0=no specific ethnicity to explore whether relationships differed by store ethnicity.
Statistical analyses
All data cleaning and analyses were completed using the statistical software package IBM SPSS Statistics Version 22.0. Descriptive statistics, χ 2 tests and t tests were used to examine characteristics of the stores and store owners/managers and distributor variables, overall and by store size and store ethnicity for each product category.
Results
Recruitment
Two hundred and twenty-one stores were approached for participation; fifty-five remained undetermined given no contact with the owner/manager despite several attempts and one store was closed. Of the remaining 165 stores, 29 % (n 48) were ineligible to participate for the following reasons: ten had more than three cash registers; ten had contracts negotiated by a corporate office; eight had owners/managers involved in store management for less than 1 year; six were liquor stores; six presented language barriers; and eight were excluded for other reasons such as having more than one location. Another 25 % (n 42) refused participation and 2 % (n 3) of interviews were incomplete. The overall recruitment rate was 65 % and site-specific recruitment rates ranged from 46 % to 83 %, with lower rates in the two communities where there were no pre-existing relationships with the owners/managers (46 % Durham, NC; 51 % San Diego, CA; 81 % Baltimore, MD; 83 % Minneapolis, MN; see Table 1).
Owner/manager and store characteristics
The owners/managers were mostly middle-aged men with more than a high school education and an average of 7 years of experience managing the store (see Table 2). Nearly half of the stores were characterized as ethnic markets (44 % v. 56 % of no specific ethnicity) and a similar percentage were authorized to accept WIC. Although the stores were all characterized as small based on number of cash registers, they varied in annual sales, similar to a previous study( Reference Laska, Borradaile and Tester 3 ). Dichotomizing annual sales using a median split resulted in two fairly equivalent groups of thirty-eight (60 % with sales of <$US 500000 per annum) smaller stores and twenty-five (40 % with sales of ≥$US 500000 per annum) larger stores. Similar percentages of ethnic and non-ethnic stores were classified into smaller v. larger stores (P>0·05); however, more non-ethnic stores were larger compared with ethnic stores.
Table 2 Demographic characteristics of participating stores and owners/managers (n 72) of four urban areas in the USA (Baltimore, MD; Durham, NC; Minneapolis/St Paul, MN; and San Diego, CA), mid-October 2013 to July 2014

WIC, Special Supplemental Nutrition Program for Women, Infants, and Children.
Given differences in sampling methods and recruitment rates across sites, we examined differences between sites prior to answering our study questions. Site differences in store characteristics were observed on several variables. For example, 73 % of participating San Diego stores were larger stores based on annual sales of ≥$US 500000 compared with 42 % of Minneapolis stores, 25 % of Durham stores and 15 % of Baltimore stores. Similarly, participating Baltimore stores had fewer aisles (mean=2) compared with stores in Durham (mean=4), Minneapolis/St. Paul (mean=3) and San Diego (mean=3; P≤0·001). In addition, half or more of the stores in San Diego (50 %), Durham (56 %) and Baltimore (65 %) were classified as ethnic stores, whereas only 10 % of the Minneapolis/St. Paul stores were ethnic stores (P≤0·01). These site differences support our examination of differences by store size and store ethnicity, and we acknowledge the limitation of not controlling for site in our analyses given the sample size.
Question 1: How often are products sourced?
Savoury snacks, sugary beverages and sweet snacks were most often sourced by a distributor at least weekly (in 85 %, 72 % and 68 % of the stores, respectively; see Fig. 1). There were few differences in sourcing by store size (data not shown). Smaller stores were more likely to self-source sugary beverages (8 %) or receive monthly distributions (25 %) compared with larger stores (0 % and 4 %, respectively; P≤0·05). There were no differences by store ethnicity in the sourcing of obesogenic product categories.
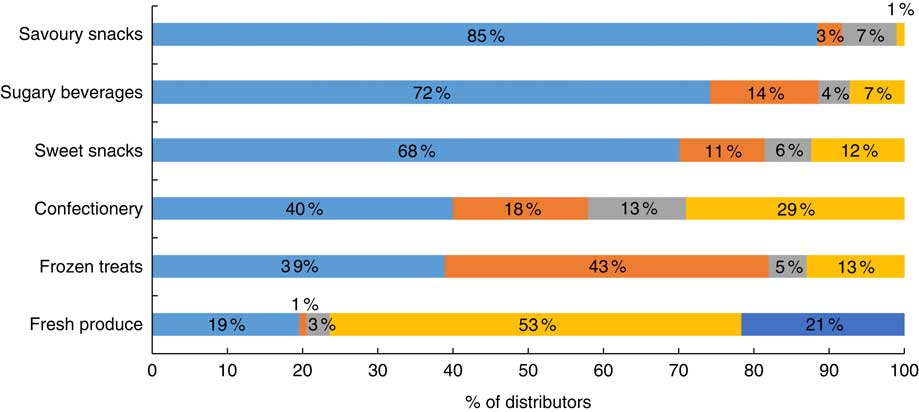
Fig. 1 Distributor visit frequency by product category: the percentage of distributors who sourced each of the product categories at varying levels of frequency (![]() , weekly;
, weekly; ![]() , monthly;
, monthly; ![]() , quarterly to annually;
, quarterly to annually; ![]() , self-source;
, self-source; ![]() , do not carry) as reported by small store owners/managers (n 72) in four urban areas in the USA (Baltimore, MD; Durham, NC; Minneapolis/St Paul, MN; and San Diego, CA), mid-October 2013 to July 2014. Percentages do not sum to 100 % due to missing data (savoury snacks: n 3 (4 %); sweet snacks, sugary beverages and fresh produce: n 2 (3 %) each). Self-source refers to store owners/managers obtaining the product themselves
, do not carry) as reported by small store owners/managers (n 72) in four urban areas in the USA (Baltimore, MD; Durham, NC; Minneapolis/St Paul, MN; and San Diego, CA), mid-October 2013 to July 2014. Percentages do not sum to 100 % due to missing data (savoury snacks: n 3 (4 %); sweet snacks, sugary beverages and fresh produce: n 2 (3 %) each). Self-source refers to store owners/managers obtaining the product themselves
In terms of fresh fruits and vegetables, converse to what is reported for the obesogenic product categories, 21 % of the stores did not stock any fresh fruits and vegetables, 53 % self-sourced fruits and vegetables, and 23 % had a fresh fruit and vegetable distributor (3 % missing). Smaller stores were also more likely to self-source fresh fruits and vegetables (70 %) or not stock fresh fruits and vegetables at all (24 %), compared with larger stores (45 % and 8 %, respectively; P≤0·001).
Question 2: What types of agreements and expectations do distributors have for carrying products?
Agreements were in place between owners/managers and distributors for most product categories (see Table 3). Similar percentages of savoury snack (43 %), sugary beverage (51 %), and frozen treat (40 %) distributors had formal agreements (i.e. contracts). Informal agreements dominated among sweet snack (62 %) and confectionery (57 %) distributors, and were least common among sugary beverage distributors (37 %). Differences in types of agreements were not observed by store size or store ethnicity for any of the product categories.
Table 3 The distributor in the placement and promotion of obesogenic products in small food storesFootnote † in four urban areas in the USA (Baltimore, MD; Durham, NC; Minneapolis/St Paul, MN; and San Diego, CA), mid-October 2013 to July 2014
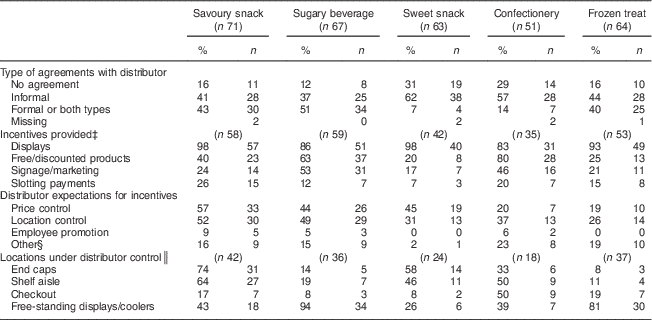
† Analyses exclude stores that self-sourced products (one savoury snack; five sugary beverage; nine sweet snack; twenty-one confectionery; eight frozen treat).
‡ Denominator=stores with either informal or formal agreements.
§ Other includes maintenance of agreement; exclusivity of product in display; percentage of shelf space devoted to product.
║ Denominator=number of stores with distributors’ agreements and a little-to-total control over displays per store owner/manager report.
In close to two-thirds of the stores, some type of incentive was received for placing and promoting products, and the most common incentives were displays (83–98 %; see Table 3) such as free-standing wire racks and displays to attach at end caps. The next most common incentive was free or discounted products from savoury snack (40 %), sugary beverage (63 %) and confectionery (80 %) distributors. The provision of free signage and marketing materials was somewhat common among sugary beverage (53 %) and confectionery (46 %) distributors. Least common were slotting payments for sourcing a product or placing products in a certain location in the store, although these were reported among 26 % of savoury snack and 20 % of confectionery distributors. When examining differences by store size, smaller v. larger stores were less likely to receive free/discounted products from sugary beverage (50 % v. 86 %, P≤0·01) and frozen treat (8 % v. 39 %, P≤0·01) distributors, free signage/marketing materials from savoury snack (10 % v. 50 %, P≤0·001), sugary beverage (37 % v. 73 %, P≤0·01) and frozen treat (8 % v. 35 %, P≤0·05) distributors, and slotting payments (17 % v. 41 %, P≤0·05) from savoury snack distributors (see Table 4). When examining differences by store ethnicity, ethnic v. non-ethnic stores were less likely to receive free/discounted products (58 % v. 91 %, P≤0·05) from confectionery distributors, as well as slotting payments from sugary beverage (0 % v. 21 %, P≤0·01), confectionery (0 % v. 30 %, P≤0·05) and frozen treat (0 % v. 27 %, P≤0·01) distributors. No other differences were significant.
Table 4 Differences by store size and ethnicity in distributors’ role in the placement and promotion of obesogenic products in small food storesFootnote † in four urban areas in the USA (Baltimore, MD; Durham, NC; Minneapolis/St Paul, MN; and San Diego, CA), mid-October 2013 to July 2014
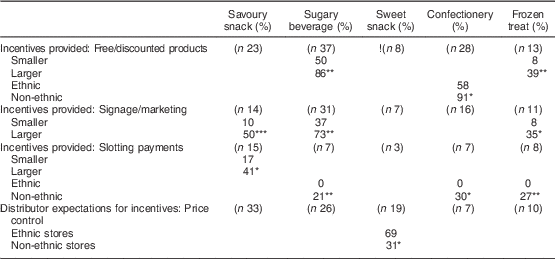
*P≤0·05, **P≤0·01, ***P≤0·001.
† Analyses exclude stores that self-sourced products (one savoury snack; five sugary beverage; nine sweet snack; twenty-one confectionery; eight frozen treat).
Price and location control were the most common expectations that distributors had for placing and promoting their products (see Table 3), these being most common among savoury snack and sugary beverage distributors. Far less frequently, owners/managers reported that distributors expected employees to promote their products (ranging from 0 % for sweet snacks and frozen treats to 9 % for savoury snacks). There were no significant differences in distributor expectations by store size. In terms of store ethnicity, only one association was significant. In ethnic v. non-ethnic stores, sweet snack distributors were more likely to control the price of items (69 % v. 31 %, P≤0·05; see Table 4).
Finally, among stores in which distributors had some control over the placement and promotion of their products, the most common locations where products were placed included end caps and other free-standing displays (see Table 3). However, location of control varied by product category, with savoury snack and sweet snack distributors favouring end caps (74 % and 58 %, respectively) and shelf aisles (64 % and 46 %, respectively), while sugary beverage (94 %) and frozen treat (81 %) distributors favoured free-standing displays. Confectionery distributors were noted to have location control in all four location types (end caps, store aisles, checkout and free-standing displays/coolers). Differences by store size and store ethnicity were not examined given small cell sizes.
Discussion
The retail food environment in racially/ethnically diverse and lower-income communities is often characterized as unhealthy and full of energy-dense, nutrient-poor foods and beverages conveniently available through various retail food outlets( Reference Odoms-Young, Zenk and Karpyn 41 ). Food stores are a significant source of nutrients( Reference Poti and Popkin 11 ), and small food stores play a unique and important role in the retail food environment. Small food stores are important to study given that they are typically situated in convenient locations, especially to those with limited transportation options( Reference Powell, Slater and Mirtcheva 10 ); they are visited frequently to purchase a lot of energy quickly (e.g. spend $US 3·00 on 2720 kJ (650 kcal) of immediately consumable products( Reference Lent, Vander Veur and Mallya 42 ), during a shopping trip that averages less than 10 min( Reference Calderon, Ayala and Elder 43 )); and the ubiquity of obesogenic products in these stores has implications on what is purchased( Reference Sharkey, Dean and Nalty 34 ). Access to a small food store is associated with risk for obesity( Reference Bodor, Rice and Farley 44 ). The present study sought to fill a gap in this research by examining the importance of food and beverage distributors in the sourcing, placement and promotion of several obesogenic product categories. It is among the first studies to ask small food store owners/managers about the agreements they have with food and beverage distributors of these product categories and the incentives they receive for placing and promoting their products in these stores.
Study findings indicated that most distributors of the obesogenic product categories visited the stores at least weekly. By comparison, close to a quarter of the stores did not stock any fruits and vegetables and slightly over half sourced it themselves. This has important implications on the sustainability of healthy food access initiatives, particularly given the amount of support provided by the obesogenic product category distributors. Seventy per cent or more of the stores had informal or formal agreements with the obesogenic product category distributors. Incentives accompanied these agreements, as well as expectations for placing and promoting the products in the stores. Given the provision of free-standing displays and signage/marketing materials as incentives, product placement and promotion were a natural part of this agreement. These findings differ from those of a 1999 study by Feighery et al.( Reference Feighery, Ribisl and Achabal 29 ), with more stores in the present study reporting having received incentives for placing products compared with Feighery et al. (e.g. 86 % in the present study v. 52 % of stores reporting receiving incentives from sugary beverage distributors). This may be because these industries have become more sophisticated over time in the placement and promotion of their products. Finally, we explored whether distributor relationships differed by store size or store ethnicity and found few differences. Small stores were more likely to self-source products and this was observed for both sugary beverages and fruits and vegetables. Smaller stores and ethnic stores were also less likely to receive various types of incentives compared with larger stores and non-ethnic stores, respectively. The most notable of these differences was the lack of slotting payments for ethnic v. non-ethnic stores from among several distributors. These are new findings as yet unreported in the retail food environment literature; however, they are based on a relatively small sample size. Additional research is needed to confirm these findings.
Study limitations
First, to minimize respondent burden, owners/managers were asked to think about their most common experience with distributors from each product category (e.g. ‘I understand that you have many different relationships/agreements with these distributors. When answering these questions, tell me about the most common ones, the average person or company.’). It is possible that owners/managers have different relationships with different distributors of the same product category. Second, and also due to concerns with respondent burden, our healthy comparison of fresh fruits and vegetables was limited to questions on frequency of sourcing. Third, and for similar reasons, we did not conduct a formal assessment of test–retest reliability (e.g. interviewing the owner/manager again two weeks after the first assessment). Fourth, although the multi-site nature of the study is a strength, site differences were observed, similar to a previous study( Reference Laska, Borradaile and Tester 3 ). For example, the Minneapolis/St. Paul site has a city ordinance requiring availability of fresh fruits and vegetables in its stores, thus the reason why all stores had fruits and vegetables. On the other hand, Baltimore stores generally self-sourced fruits and vegetables. Site differences made comparisons more challenging but we attempted to address this by examining distributors’ roles by store size and store ethnicity, which varied across sites. Fifth, our operationalization of store size using annual sales and store ethnicity using observed measures of the in-store environment require further exploration given differences observed despite the small cell sizes. Examining differences between small stores, larger grocery stores and supermarkets is an important next step, as is examining the extent to which these findings generalize across different types of ethnic stores. Finally, future research should explore how profitability of these products influences these relationships, particularly given price controls reported by store owners/managers.
Conclusion
The present study identified new and important findings on the importance of distributors of energy-dense, nutrient-poor foods and beverages in the sourcing, placement and promotion of products in small food stores. Specifically, we found that distributors of savoury products, sugary beverages, sweet snacks, confectionery and frozen treats are quite involved in ensuring product availability, a phenomenon that was not observed in a previous study among fruit and vegetable distributors( Reference Jetter and Cassady 28 ). Based on these findings, public health advocates and practitioners working to increase healthy food access need to understand the existing relationships between store owners/managers and distributors of both healthy and unhealthy foods and beverages, and what barriers the owners/managers may face in terms of sourcing, placing and promoting certain products in their stores. Interventions that address healthy food availability without taking into account the larger food system may face setbacks in terms of impacting customer dietary intake or purchasing of the healthier food and/or beverage products. More research is needed to understand how to work with retailers that have existing agreements for obesogenic products at the point of sale. Similarly, more research is needed to find ways to work with distributors to restructure agreements to incentivize the promotion of healthier foods and beverages. Thus, in order to address access to healthy foods and beverages, as well as limit access to unhealthy products, healthy store partnerships must consider the role of the distributors.
Acknowledgements
Acknowledgements: The authors thank the store managers who agreed to participate in this study. In addition, the authors thank Maria Tólman for her excellent translation of the interview guide and recruitment scripts and materials, and Susan P Liverman, RN, Johns Hopkins University, for her leadership on qualitative data management and analysis. Financial support: This research was supported by the Healthy Eating Research programme of the Robert Wood Johnson Foundation (grant number 0000704651). However, Healthy Eating Research had no role in the design, analysis or writing of this article. Conflict of interest: None of the authors have a conflict of interest with this work. Authorship: G.X.A., J.G., M.L. and K.R. conceptualized the study and prepared the proposal for funding. All authors participated in creating the data collection materials and protocols. A.K., C.O. and L.S.S. were involved in data collection and L.H. was primarily responsible for data management. G.X.A. conducted the analyses and L.H. carried out data and analysis verification. G.X.A. prepared a first draft of the paper and all authors read and approved several versions, including the final manuscript. Ethics of human subject participation: This study was conducted according to the guidelines laid down in the Declaration of Helsinki and all procedures involving human participants were approved by the Institutional Review Board at each of the authors’ institutions. Verbal informed consent was witnessed and formally recorded.


