


Introduction
In 2005, just after the turn of the 20th century, we had the chance to look closely at the dramatic restructuring of agriculture over the preceding 100 yr. The economic and political changes over the last century transformed the agriculture sector into the structure with which we are all now familiar. The number of farms across the nation fell from nearly 7 million at its peak during the Great Depression to just over 2 million at the end of the century. Average farm size increased, accelerating at mid-century as widespread adoption of machinery and chemical inputs reduced labor needs and expanding industrial employment offered opportunities for work off the farm. Increasing specialization accompanied this change, as new technologies facilitated a focus on fewer, more intensively cultivated crops and more open global markets absorbed the production. Federal farm policies that had attempted to control production and reduce global competition to support farmer incomes were redesigned to accommodate growing productivity and facilitate US participation in global trade; and perhaps more significantly than we realized in 2005, changes were affecting the relationship between producers of food and those who consume it.
Now nearly two decades into the 21st century, we welcome this opportunity to revisit the topic of change in agriculture. We focus on trends in structure, technology and policy, and on the evolution of the trend toward greater influence of consumer preferences on farming, particularly its effect on the rise of organic agriculture and of local and regional foods and its impact on policy.
Farm size and specialization
In a strikingly complementary pattern, the number of farms declined and the average acreage per farm increased dramatically across the 20th century. By the last decade, however, both trends had begun to stabilize and that pattern has continued in the first decades of the 21st century (see Fig. 1).

Fig. 1. Average farm size and number of farms in the USA: 1900–2012. Sources: Author calculations from the Census of Agriculture, between 1900 and 2012. Note: The decline in number of farms reversed temporarily in the 1930s, as people returned to farming during the Great Depression. The marked reverse in the increase in average acres per farm in the late 1990s reflects a change in survey methodology in 1997.
The apparent stabilization in farm size over the last 30 yr, however, masks an underlying structural change different from the consolidation that occurred previously. A closer examination of the distribution of farms, by acreage and by sales category, reveals a growing divergence in farm size not apparent using a simple average of acreage per farm (see Figs. 2 and 3). Both distribution by acreage size and distribution by sales class point to a similar transformation at the farm level: when comparing data on the middle of the 20th century with data from the most recent Census of Agriculture (Reference Beckman, Dyck and Heerman2012), increases are evident in the number of very large farms with acres exceeding 1000 per farm and sales over $500,000 a year. At the same time, there is growth in the number of farms with fewer than 50 acres and annual sales below $10,000. The farms in the middle—referred to as mid-sized farms—are fewer in number, in terms of both cropland and sales. Despite the small, though growing, share of farms with annual gross cash farm income exceeding $1 million a year, those farms were responsible for about half of agricultural production in 2015 (MacDonald and Hoppe, Reference MacDonald and Hoppe2017).

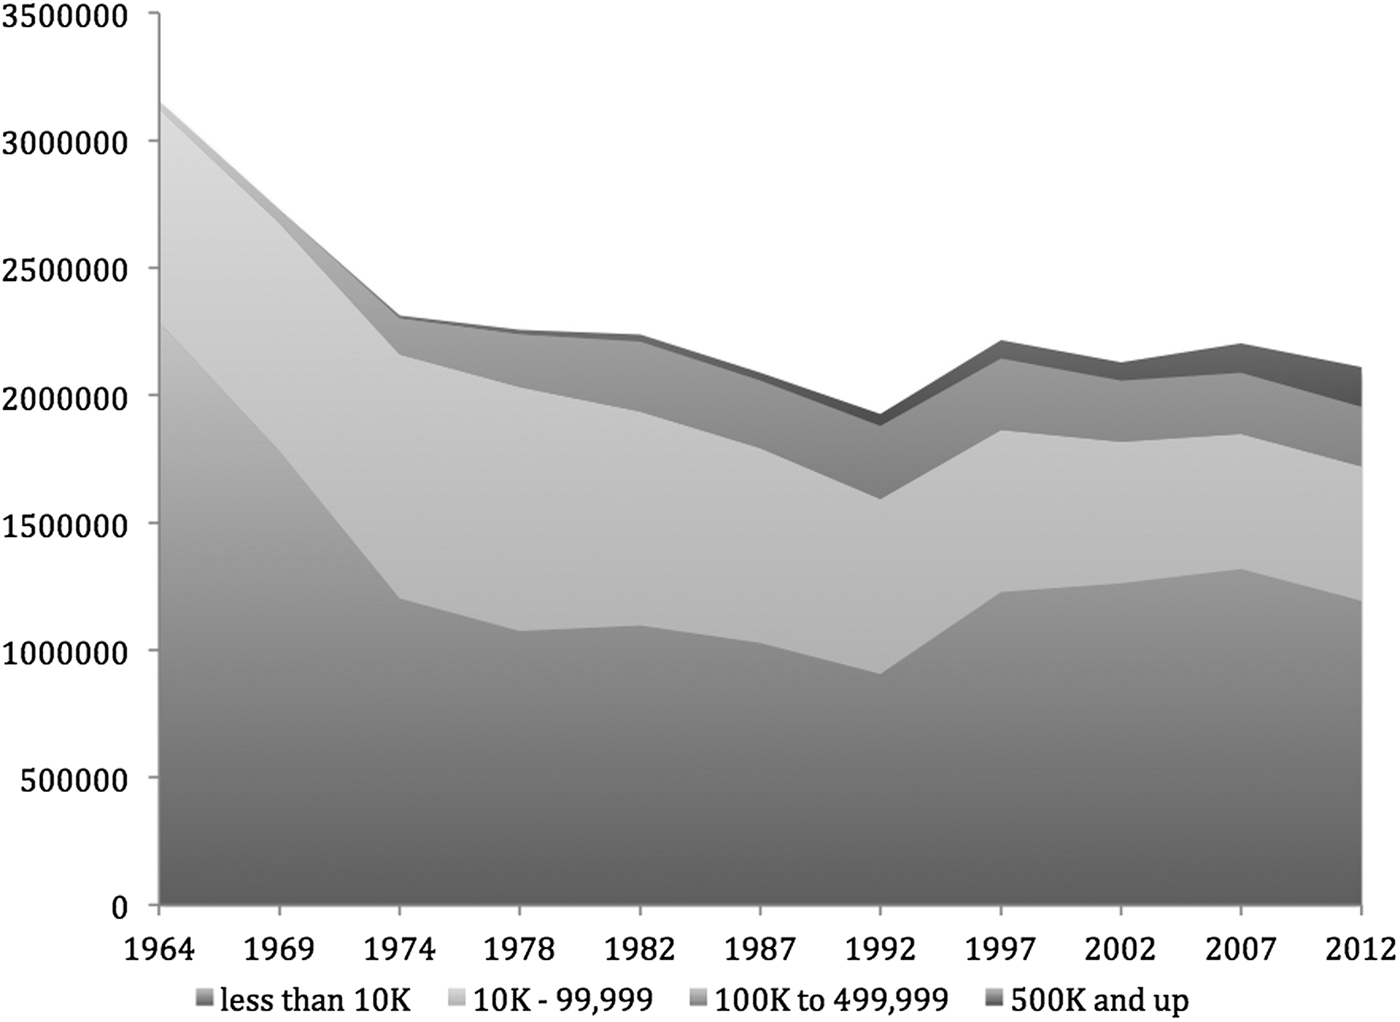
Another method for examining the structure of US farms is to measure the mid-point acreage of farms—the point at which half of all farms are larger and half are smaller. In a recently published analysis of mid-point acreages over the last six agriculture censuses, MacDonald et al. (Reference MacDonald, Hoppe and Newton2018) found that the mid-point cropland farm size had increased from 589 acres in 1982 to 1201 in 2012. Similar to the findings in our comparison with the mid-20th century, they found a growing number of very small and very large farms and a falling number of mid-sized farms. Along with the shift in the number of farms within each size classes went a shift in the share of cropland by farm size towards the largest operations. Between 1987 and 2012, the share of cropland on farms with at least 2000 acres rose from 15 to 36% between 1987 and 2012.
In contrast, MacDonald et al. (Reference MacDonald, Hoppe and Newton2018) find that the share of pasture and rangeland held by the largest operations has fallen 7% over the same period. Livestock operations for most species have consolidated in conjunction with reorganizations in their industries, seeing increasing numbers of head sold or in inventory and falling use of grazing land. That has not been true for beef cow–calf operations, however. The number and size of cow–calf operations has remained relatively steady over recent decades, leading to a rising share of pasture and grazing land held by operations with 500 acres or less.
A parallel development to the changing structure of farming has been increased specialization. We use two measures of specialization to look at the long-term trend since 1900 (see Fig. 4): the first, established by Gardner (Reference Gardner2002), estimates the average number of commodity crops grown on farms. The second, expanding on Gardner, adds specialty crops to commodity crops for a fuller measure of changing diversity in production.Footnote 1 While including specialty crops in the measure shows a slower advance in specialization than using only commodity crops, by both measures, the average number of products per farm has fallen close to one: 1.14 for the commodity measure and 1.32 for the commodity plus specialty crops measure.Footnote 2

Fig. 4. Farm specialization: 1900–2012. Notes. The commodity only index follows Gardner (Reference Gardner2002), and is calculated by summing the number of farms producing corn, sorghum, wheat, oats, barley, rice, soybeans, peanuts, alfalfa, cotton, tobacco, sugar beets, potatoes, cattle, pigs, sheep and chickens, and dividing by the total number of farms. The specialty crop and commodity index includes the products above, plus vegetables, fruits and tree nuts, berries and greenhouse food products. Note that the Census accounts for vegetable farms differently over time; prior to 1969, data on vegetables for home and commercial use were collected. From 1969, only commercial use was collected. The 1992 Census is the first to report vegetables grown in greenhouses. Sources: Dimitri et al., 2015; Author calculations using data reported in the Censuses of Agriculture, 2002, 2007, 2012. USDA-NASS 2004, 2009, 2014.
MacDonald et al. (Reference MacDonald, Hoppe and Newton2018) recently developed a third measure using data from the ERS/NASS Agricultural Resources Management Survey (ARMS). The authors compared specialization in 1996 and 2015 (the initial and most recent years of data availability) in specific crops, as well as across crops and livestock. Their data show less specialization than the method based on Census data, with few farms producing only one crop, but their data also indicate a trend toward increasing specialization. Over the 20-yr period, they found the number of farms growing only one or two crops increasing and the number growing three or more decreasing. Over the same period, the share of value of production on farms producing both crops and livestock fell from 33 to 22%.
Technology and productivity
Rising farm productivity, driven by an array of technological developments, has accompanied structural change in the farm sector. Mechanization in the 20th century, while characterized most especially by the replacement of animal power with tractors, also included development of more advanced planting, cultivating and harvesting machinery. Concurrent advances in plant and animal breeding, including development of hybrid seed and specialized animal breeds and in the manufacturing of fertilizer and pesticides, combined to dramatically increase yields. The changes began slowly but accelerated by the mid-century. Annual total factor productivity growth, representing the increase in production not resulting from increased input use, rose an average of 1.99% from 1948 to 1999 (Dimitri et al., Reference Dimitri, Effland and Conklin2005). Indices representing changes in farm output, input use and total factor productivity during the years 1948 and 2015 are shown in Figure 5 (the indices = 1 for the base year 2005; all changes are relative to the base year). Input use growth was approximately level, with relatively equal growth in output and total factor productivity. Together, the three indices indicate that farm output increases were largely due to greater productivity of inputs; that is, more output was produced with the same level of inputs. Growth of total factor productivity continued in the 21st century, but has slowed from its earlier pace, falling to 0.92% in 2000–2007 and 0.53% in 2007–2015, bringing the annual average over the whole period 1948–2015 to 1.38% (USDA-ERS, 2018a). The average annual growth indices of farm output and input use are 1.03 and 0.11, respectively, during 2000–2007; 0.72 and 0.19 during 2008–2015; and 1.48 and 0.10 over the whole 1948–2015 period (USDA-ERS, 2018a).

Fig. 5. Changes in farm output, input use and total factor productivity, 1948–2015. Notes: Base year is 2005. Productivity captures the increase in production not accounted for by the growth in quantity of inputs used, and is expressed as total factor productivity (the ratio of total outputs to total inputs). When total factor productivity is rising over time, a greater level of production can be obtained from the inputs used. Productivity changes result from changes in efficiency, the scale of production and technical change. Source: Economic Research Service, USDA-ERS, 2018a.
Much of the dramatic productivity growth in the 20th century centered on the introduction of self-propelled machinery, manufactured chemical inputs and conventional animal and plant genetic improvements. In the 21st century, the technological drivers of productivity growth are centered on three areas of innovation: genetics, including biotechnology and seed innovation; information technology and digital systems, including precision agriculture and robotics; and alternatives to traditional land-based agriculture, including multiple forms of indoor farming. As was the case for technological innovations in the 20th century, technological change in the 21st century continues the effort to control production risks; reduce input use, including labor; and increase yields.
Biotechnology and seed innovation
Biotechnology in plant breeding involves developing plants through gene transfer that create their own insecticides or to resist herbicides applied to control weeds. Often referred to as genetically engineered (GE) or genetically modified organisms, the seeds developed through these processes have been widely adopted in the USA, where they account for nearly all corn, soybean, canola, cotton and sugar beet production. First introduced commercially in 1996, adoption increased rapidly, with more than 90% of corn, cotton and soybeans grown from GE seed (see Fig. 6). GE seed has also been widely adopted in Canada, Brazil and Argentina, and in India and China for cotton (James, Reference James2015).
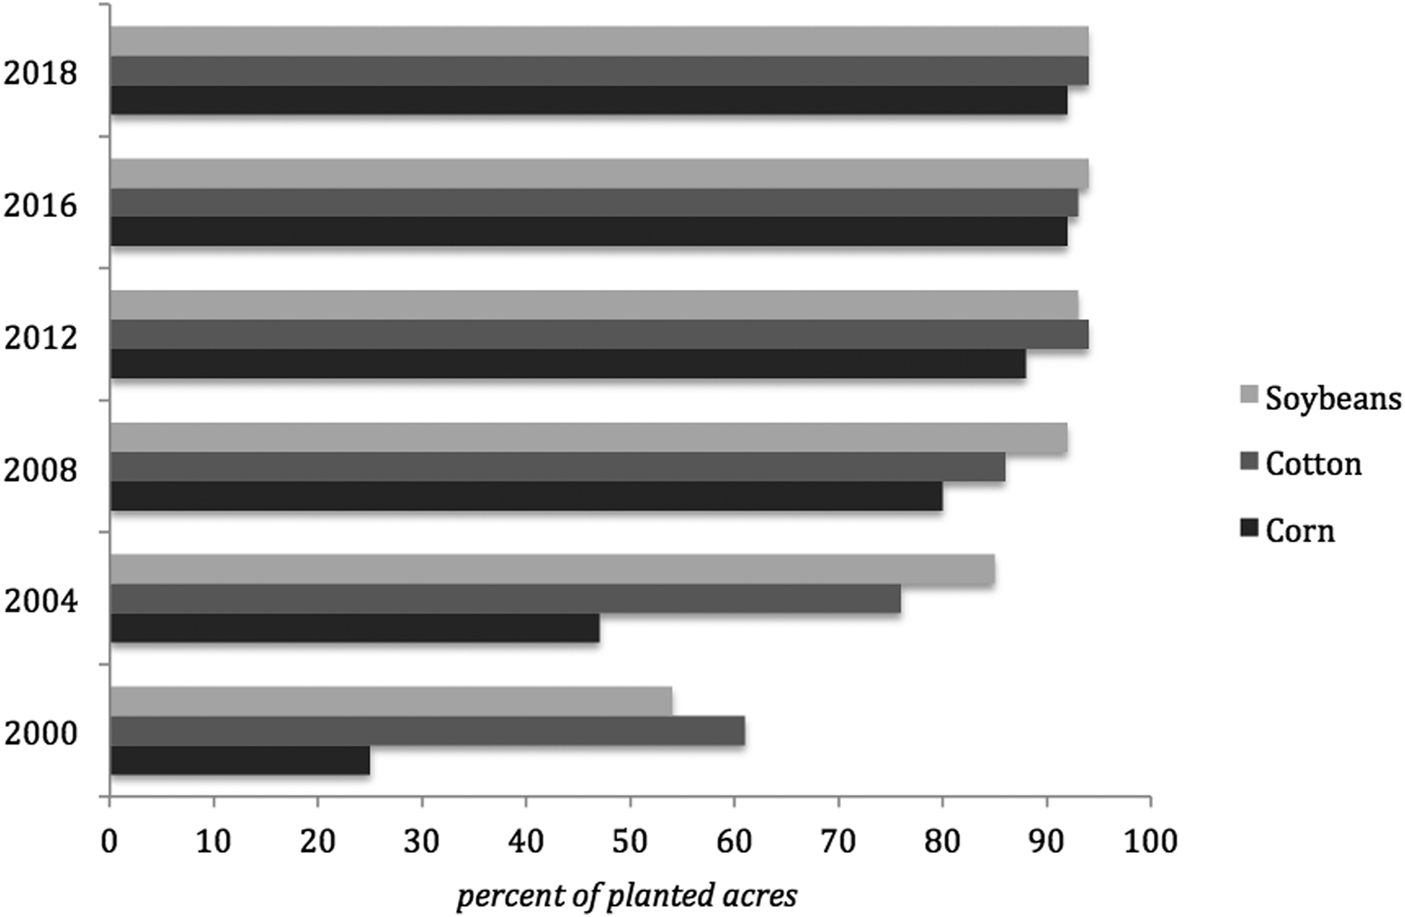
Fig. 6. Adoption of biotechnology for corn, cotton, soybeans: 2000–2018. Notes: The data reported are the percent of total plantings. Data available only for corn, cotton and soybeans. Source: Data are from Economic Research Service, USDA-ERS, 2018b.
A sizeable body of literature examines biotechnology's relative benefits and challenges. The National Research Council's (2010) synthesis finds the environmental impacts are equivalent or less damaging than the conventional crops replaced. The result follows from reduced synthetic chemical usage, although weed resistance and, to a lesser extent, pest resistance are a concern. The research also points to equivalent or moderately higher yields of biotech crops in the USA (National Research Council, 2010).
The structure of the seed and chemical industry changed as a result of consolidation and integration that followed the success of biotech seeds. In 2016, six firms (the Big Six—Bayer, Monsanto, Syngenta, Dow, Dupont and BASF) dominated the global market. In 2015 and 2016, five of those firms announced three mergers: Bayer and Monsanto, Syngenta and ChemChina, and Dow and Dupont (MacDonald, Reference MacDonald2017). A consequence of this market concentration is that farmers, particularly those who have adopted GE technology, have reduced choice regarding which seeds and inputs to use on their farms. Also, the intellectual property embedded in the seeds is owned by the seed companies, meaning farmers must agree not to replant seed from plants grown from GE varieties and must use specific chemicals and seeds together (Hendrickson et al., Reference Hendrickson, Howard and Constance2017).
Biotechnology, particularly GE seeds, has been cast by opponents as another development along the path of agro-environmental degradation that results from the bulk of modern farming systems (see Fraser et al., Reference Fraser, Legwegoh, Krishna, CoDyre, Dias, Hazen, Johnson, Martin, Ohberg, Sethuratnam and Sneyd2016 for a discussion). More immediate concerns include gene flow to organic crops and damage to neighboring conventional and organic crops from GE-paired herbicides. While current USDA reports indicate that the number of organic farms affected by gene flow is small, the economic cost for those producers is significant, as an organic product that is contaminated by GE traits must be sold in conventional markets, at the lower prices for conventional crops (Greene et al., Reference Greene, Wechsler, Adalja and Hanson2016). In a recent series of cases involving damage from the herbicide dicamba, approximately 4% of neighboring non-dicamba-resistant soybean fields were damaged (Bradley, Reference Bradley2017).
More recently, gene editing, a new technology that changes DNA by adding, removing or altering genetic material, has become the cutting edge of biotechnology development (NIH, 2018). Genetically edited soybeans, for example, produce oil that can be heated to high temperatures; modified flax seeds contain higher levels of ω−3 fatty acids; and edited wheat has less gluten (Molteni, Reference Molteni2018). At the time of this writing, gene-edited crops are still in development, and currently include only those using genes already in the plant's gene pools (Unglesbee, Reference Unglesbee2018). As of now, there are no regulatory barriers to bringing gene-edited crops to the market (US Department of Agriculture, 2018).
Biotechnology has influenced animal genetics as well, applying DNA testing to increase precision of conventional breeding programs and developing laboratory methods for animal cloning (Schefers and Weigel, Reference Schefers and Weigel2012; Jonas and Koning, Reference Jonas and Koning2015). Most recently, food scientists have applied biotechnology methods to develop meats grown in laboratories from animal fetal cells, called cultured meat (Arshad et al., Reference Arshad, Javed, Sohaib, Saeed, Imran and Amjad2017). Ongoing debates surrounding cultured meat include (1) labeling the product as ‘meat’, which is opposed by the livestock industry, and (2) whether USDA or the Food and Drug Administration has the authority to regulate cultured meat (Douglas, Reference Douglas2018).
Information technology and digital systems: precision agriculture and robotics
Information technology and digital systems play a role in facilitating developments across a range of productivity-enhancing technologies, guiding advanced laboratory methods in biotechnology and animal genetics and providing the foundations for the intricate environmental control systems that make possible indoor farming and soilless agriculture systems. However, advances in information technology and digital systems are perhaps most directly applied in precision agriculture and robotics technologies. Precision agriculture relies on digital information and linked technologies to target farm production resources efficiently. Adoption requires investment in computer-assisted machinery that can both collect soil, crop, nutrient, moisture, pest and yield data and use those data to control field processes, including planting, nutrient management, irrigation, pest control and harvest decisions (National Research Council, 1997; USDA-NRCS, 2007). Larger farms, in terms of acreage, are more likely to adopt precision agriculture, since costs for adoption can be high. Returns can be rewarding, however; after accounting for farm size, net returns and operating profits for farms using precision agriculture are slightly higher when compared with non-adopters (Schimmelpfennig, Reference Schimmelpfennig2016a).
Despite its potential, adoption of precision agriculture has been relatively slow and so far concentrated in field crop agriculture. More recently, adoption of precision irrigation systems that control delivery of water, nutrients and pesticides has increased for high value specialty crops, such as avocadoes, grapes, walnuts and almonds, has increased in areas of frequent drought (Escalera et al., Reference Escalera, Dinar and Crowley2015). Of the three leading precision agriculture technologies—Global Positioning System (GPS) guidance systems, GPS yield and soil monitors/maps, and variable rate input application technologies (VRT)–GPS guidance systems were used in about half of planted acres for crops such as corn, rice and peanuts in 2010, while GPS soil mapping and VRT had adoption rates under 25% of planted acres (Schimmelpfennig, Reference Schimmelpfennig2016b). There are likely multiple reasons for the slow rate of adoption. The high cost of the technology and the learning curve associated with making the best use of the data are contributing factors (Castle et al., Reference Castle, Lubben and Luck2016), but for some of the technologies, such as variable rate application of inputs and pest control, work is still progressing on acquiring sufficient within-field data to make efficient use of the technology (Burwood-Taylor, Reference Burwood-Taylor2017). Farmers may also be wary of the fact that many precision agriculture systems share farmer data with agricultural input companies, and farmers have little control over how the data are used (Schimmelpfennig, Reference Schimmelpfennig2016a; Wolfert et al., Reference Wolfert, Ge, Verdouw and Bogaardt2017).
Robotics have developed alongside precision agriculture, replacing scarce or expensive labor (Hu, Reference Hu2016). While still a relatively new technology for agriculture, the range of robotics use continues to expand. For example, adoption of precision agriculture technologies like GPS has facilitated the use of auto-steering tractors (Miller et al., Reference Miller, Griffin, Bergtold, Sharda and Ciampitti2017). Drones have become more widely used for data gathering on crop conditions and for precision application of inputs (Zhang and Kovacs, Reference Zhang and Kovacs2012). Robotic milking technology has been adopted by dairy operations particularly by larger dairies, but also by smaller operations facing high costs or limited availability of labor and by dairies producing higher value organic milk (Rotz et al., Reference Rotz, Kamphuis, Karsten and Weaver2007; Gillespie et al., Reference Gillespie, Nehring and Sitienei2014). Robotic field hands are being developed for use in specialty crop production that requires hand cultivation and harvesting. These technologies, like most 20th century technologies, reduce labor needs and have become affordable as the scale of agricultural operations increases and human labor becomes more expensive or simply less available. Like precision technology more broadly, they also have the capacity to reduce input use, potentially controlling nutrient loss and reducing chemical use (Bongiovann and Lowenberg-Deboe, Reference Bongiovanni and Lowenberg-Deboer2004).
Alternatives to land-based agriculture: indoor farming systems and soilless agriculture
Indoor agriculture seeks to reduce some farming risks by providing a more controlled environment. Indoor agriculture has roots in the use of greenhouses and barns to protect crops and animals in harsh climatic conditions. Developments in concentrated poultry and hog production during the 20th century in some respects led the way in more modern, technologically advanced indoor agriculture systems, controlling environmental conditions and regulating access to nutrients (food and water) for efficient production. Modern indoor crop farming has also developed more advanced environmental control systems, as well as developing specialized methods for providing needed nutrients. Specialty crops are most often grown using these new techniques—hydroponic, aeroponic and aquaponic systems that break the reliance on soil and reduce the potential impact of weather on yields by providing a tightly controlled production environment (Despommier, Reference Despommier2011). Among these three indoor production systems, hydroponic systems are the oldest. An early mention of the sale of crops produced in water rather than soil appears in a 1937 issue of Science, in which the author discusses the evolution of water-based farming systems and suggests that the system be referred to as hydroponic (Gericke, Reference Gericke1937).
Producing food without soil presents challenges in terms of plant nutrition, disease control and circulation of the nutrient solution (Jones, Reference Jones1982). Hydroponic systems may use the nutrient film technique, which distributes nutrient solution through a plastic-lined channel that contains the plant roots (Jones, Reference Jones1982). Such systems are best suited to leafy greens and vegetables. Aeroponic systems suspend plants in air, with the roots hanging where they are fed; this method is suitable for root crops like potatoes and carrots. Other growing mediums, such as vermiculite, rely on drip irrigation to feed the plant, appropriate for grains (Despommier, Reference Despommier2009). Aquaponic agriculture is a complex joint production system that produces fish and vegetables. The bio-integrated system circulates fish waste through the water, where the waste fertilizes the vegetable crops (Graber and Junge, Reference Graber and Junge2009; Rhinehart and Diver, Reference Rhinehart and Diver2010)). Most commercial operations raise tilapia, but other fish suited to aquaponic systems are trout, perch, Arctic char and bass; the vegetables are leafy greens or herbs, while systems stocked with more fish are capable of producing tomatoes, bell peppers and cucumbers (Rhinehart and Diver, Reference Rhinehart and Diver2010).
Indoor farming takes place in different types of structures, including greenhouses, vertical farming and shipping containers. Greenhouses range from cold frames with plastic structures containing the beds, to elaborate and costly glass structures with climate control systems. Vertical farming is a more elaborate variation of greenhouse production, where food is grown in high rise buildings in completely controlled environments (Despommier, Reference Despommier2009). Shipping containers, in some cases, are being repurposed for indoor production (Birkby, Reference Birkby2016). Much of the recent development of indoor farming technologies, particularly vertical farming and the use of shipping containers, has been tied to efforts to develop urban farming, moving food production closer to consumers. While greenhouse production of leafy greens and plant starts is not new, the targeted marketing of greenhouse production for local markets is relatively recent.
Startup costs for these indoor agriculture systems can be high, particularly for those aiming to operate on a commercial scale in the urban setting, although data on are not readily available. However, recent closures of high-profile businesses and nonprofits, such as Urban Till in Chicago and Growing Power in Milwaukee, point to the challenges of achieving economic sustainability of indoor farming systems. Data on the number of indoor agriculture businesses is also difficult to obtain, but one estimate suggests that 15 vertical farms were operating in 2015 (Birkby, Reference Birkby2016). Note that there are many rooftop farms and other urban farming operations around the USA, but many of these are outdoor operations. The 2012 Census of Agriculture reported 8750 greenhouse farm vegetable operations and 573 growing fruit and berries, more than double the 4075 vegetable operations and 249 fruit and berry operations in 2007 (USDA-NASS, 2014) and indicating a general increase in greenhouse production. However, it is not possible to identify what share of these operations focus on local marketing or whether they use soilless indoor farming technologies.
Changing consumer preferences and the emergent ‘food movement’
These new technologies continue to contribute to the long-term success of US agriculture in producing abundant, and thus low-cost, commodities. A key benefit of this outcome has been widespread food security, as the abundance and low cost of food has made it possible for most consumers to purchase a sufficient amount of food. Increased efficiency in production has also freed most of the US labor force to work outside of agriculture, supporting a complex urban society in which most people are food consumers, rather than producers. That, in turn, has supported the development of a multi-layered food system linking farms to consumers through a chain of processing and distribution firms, in which farm products make up a small share of the cost of food and from which consumers have become increasingly distant from the agricultural source of their food.
With food access secure for most consumers, public attention to agriculture began to turn in the latter half of the 20th century from support for increasing production to concern about the environmental and social costs of the large-scale efficiency-oriented agricultural and food system. Soil scientists and a small group of farmers researched and practiced organic agriculture, in response to their growing concern about the environmental impacts of industrial farming practices (Stinner, Reference Stinner2007; Youngberg and DeMuth, Reference Youngberg and DeMuth2013). Economists considered how policies could be designed to provide incentives for conventional farmers to protect environmental quality, including water, air and soil (see Lichtenberg, Reference Lichtenberg2002 for a discussion). Community food security, food access disparities and diet quality, and their links to agriculture, were being discussed by nutritionists (Herrin and Gussow, Reference Herrin and Gussow1989). Conditions for farm workers were made visible through the United Farmworkers Association, with the famous call for consumers to boycott grapes in the 1960s (Garcia, Reference Garcia2016). Local food marketing schemes, such as community-supported agriculture and farmers markets, were gaining traction with a small consumer and farmer population (Brown and Miller, Reference Brown and Miller2008).
By the 21st century, these disparate questionings of conventional food production began to congeal into an integrated critique of the 20th century food system—what has been called the food movement. Influences like the popular work of journalist Michael Pollan, beginning with the publication of The Omnivore's Dilemma (Pollan, Reference Pollan2006), provided a framework for bringing together the long-term efforts of early critics with a broader public increasingly uncertain about the benefits of the conventional systems on which they depended for most of their food. The concerns expressed by the food movement are many, but can be roughly described as two-fold—on the one hand, oriented to fairness and equity, in terms of social justice, environmental justice and food justice, and on the other hand motivated by consumer concerns about the health and safety of conventional food products and the effects of large-scale agriculture on quality of life, including environmental quality, landscapes and community. The food movement, in its broadest sense, argues for the fundamental nature of food production in all human lives and works to draw attention to the health and social well-being of the people involved in the food system (including consumers), and the environmental and economic sustainability of that system (the so-called triple bottom line of economic, environmental and social sustainability).
The growing power of this movement, and its resonance with a broad array of food systems participants, including consumers, nutrition advocates, chefs, food supply firms and farmers linked to local and regional food systems, is evident in its ability to influence corporate decision-making. An increasing number of food companies are responding to the advocacy of the food movement: local food is considered a top consumer trend by supermarkets (Packaged Facts, 2017); food marketers recognize consumer desire for transparency in the food supply (Food Marketing Institute, 2017); and most large supermarket chains have a natural or organic private label brand (Dimitri and Oberholtzer, Reference Dimitri and Oberholtzer2009). Food companies strive to at least appear to be actively engaged with sustainability, with initiatives addressing nearly every food-related issue, including water stewardship, sustainable agriculture, climate change and so on (Smith, Reference Smith2008; Ceres, 2016; 2017). The broad participation in such initiatives is indicative of corporate perception of consumer demand and investor requirements (Ceres, 2016).
In addition to corporate responsiveness to the food movement, several other developments reflect the success of the food movement in influencing agricultural production and food marketing. Increased demand for higher quality diets appears to have affected the number and size of farms growing fruits, nuts, and vegetables. Related to those changes, local and regional food systems and organic food production represent growing alternatives in the food system that support food movement goals.
Impacts of changing consumer demand on agricultural production
Consumer demand for healthier diets appears to have had a measurable impact on the farm sector as reported by the Census of Agriculture, often through local and regional markets served by smaller farms producing a mix of consumer-preferred fruits and vegetables. Generally speaking, farms marketing locally and regionally are more likely to produce vegetables, fruit or tree nuts (Low and Vogel, Reference Low and Vogel2011). While the number of farms producing fruit and tree nuts declined between 1982 and 2012, the number of vegetable farms declined only until 2002, then increased over the next two census periods. The number of berry farms also increased, showing a marked jump between 2002 and 2007 (see Fig. 7).

Fig. 7. Number of farms growing specialty crops, 1982–2012. Note: The number of fruit, nut and berry farms in each category was aggregated from the individual crop level. The number of vegetable farms is an aggregate reported by the census. Source: Author calculations from the Census of Agriculture, between 1959 and 2012. USDA-NASS, 1981, 1997, 2004, 2009, 2014.
Growth in the number of berry and almond farms (the only tree nut to see an increase in farm numbers) is reflective of greater consumption of these products (Lin and Lucier, Reference Lin and Lucier2008; Perez and Ferreira, Reference Perez and Ferreira2017). Vegetable consumption, however, has not increased, with per capita consumption declining between 2003 and 2013 (Lin and Morrison, Reference Lin and Morrison2016). Industry studies report modest increases in sales of locally produced fruits and vegetables, however, which could account for the growth in number of farms (Packaged Facts, 2017).
Most of the crops that saw increases in farm numbers also saw steady or declining average farm size during the time period and of those, all but one (berries) were vegetables (see Table 1). Vegetables are also most common among crops available through local and regional markets. In 2015, 92% of food hubs, defined as intermediaries that specialize in locally or regionally produced foods, carried vegetables and herbs (Hardy et al., Reference Hardy, Hamm, Pirog, Fisk, Farbman and Fischer2016). Of the top 12 products sold directly by farms to institutions in New England in 2015, seven appear in Table 1 (Richman, Reference Richman2016).
Table 1. Farm numbers and average size, for crops with increased farm numbers between 2007 and 2012.

a Denotes crops where the average size increased between 2007 and 2012.
Source: 2012 Census of Agriculture, USDA-NASS, 2014.
Greenhouse production also increased for vegetables, fruits and berries (see Table 2). That might reflect growth of urban agriculture, although other factors may be the underlying cause of the increase; in the USA, local and regional producers also grow vegetables, herbs, fruit and berries in greenhouses. Producing different products throughout the year in the greenhouse is a best practice for profitability of the operation (Greer and Diver, Reference Greer and Diver2000). In addition, some farmers grow crops under cover to extend their production and marketing seasons.
Table 2. Number and average size of greenhouses by crop category, 2007 and 2012.

na, not available.
Source: 2012 Census of Agriculture, USDA-NASS, 2014.
The Census figures cannot speak to causality between growth in local and regional food markets and the changing number and size of fruit and vegetable farms and the growth in greenhouse-grown crops; and the same caveats noted in the discussion of overall farm structure apply to these observations of increasing numbers of smaller operations—that the farm definition used by NASS may overstate the number of smaller farms, particularly the change in those numbers over time.Footnote 3 But they do suggest a possible change in the structure of specialty crop farms counter to the larger trends that is intriguing and worth further investigation.
Local and regional food systems
Local and regional food systems entered the mainstream of the US food retail system in the first 5 yr of the 21st century, with large supermarket chains and big box stores responding to consumer demand by offering local foods for sale. That outcome is the culmination of efforts going back to the 1980s. Feenstra (Reference Feenstra1997) identified 66 publications from the late 20th century that examine links between sustainable communities and local food systems. Her review highlights many of the themes considered important in today's food movement. She identifies studies on local food systems from the early 1980s that introduce the concept of the foodshed (production and marketing areas that serve specific geographical areas), uncovers work targeting urban food systems and food insecurity that incorporate the concept of food justice, and unearths the introduction of the newly created organization type, the food policy council, that highlights the role for community empowerment in local food systems.
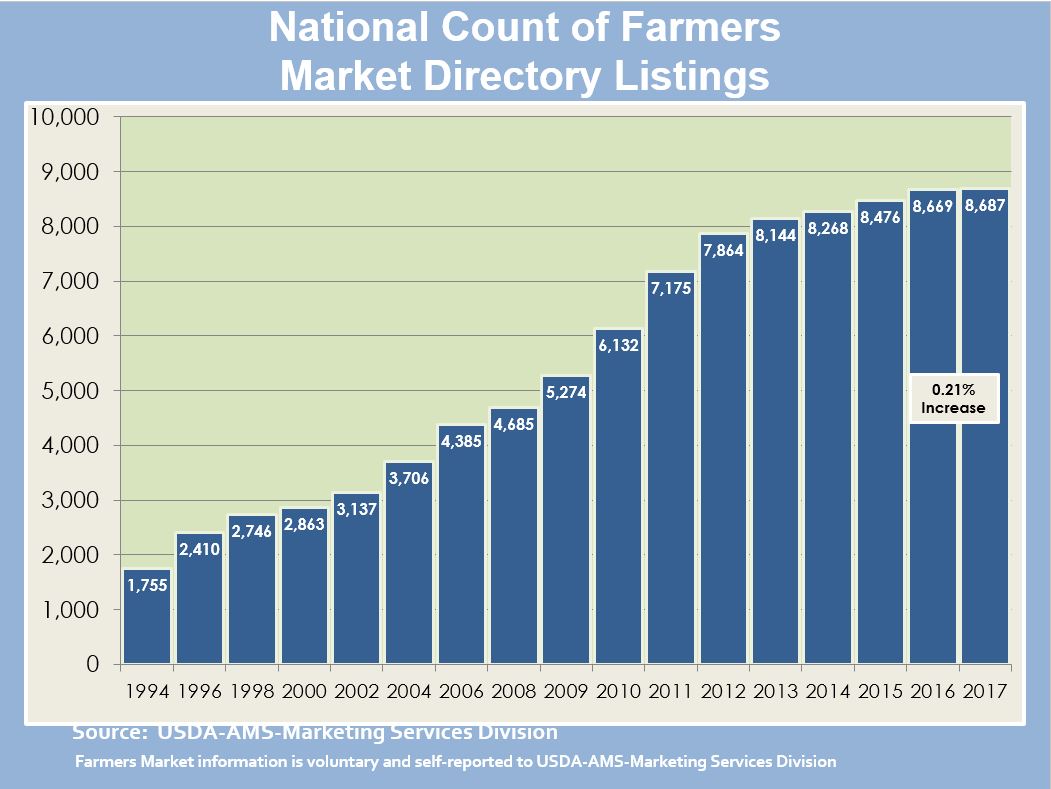
More recent work identifies local and regional food systems as important channels for supporting small- and medium-sized farms (Lyson et al., Reference Lyson, Stevenson and Welsh2008). In the early years of developing these local marketing systems, local foods were mostly sold direct to consumers in farmers markets or other dedicated outlets. The number of markets increased during the years 1994 and 2017, with growth leveling off after 2012 (see Fig. 8). The overall increase in the number of farmers markets masks potential problems with viability, as there are indications that many farmers markets fail (Stephenson et al., Reference Stephenson, Lev and Brewer2008). More recent slowing growth may be the consequence of farmers market expansion in easy high demand-dense population areas reaching a limit (Kurtzleben, Reference Kurtzleben2013).

Fig. 8. Number of farmers markets: 1994–2017. Notes: Data are self-reported by farmers market managers to USDA. Source: USDA Agricultural Marketing Services (USDA-AMS, undated).
The market channels for local and regional foods have broadened beyond direct to consumer sales in the 21st century by adopting new strategies or business forms, including regional food hubs, direct to institution sales and intermediated sales. Regional food hubs are businesses that aggregate, store, process or market food as locally or regionally grown (Barham, Reference Barham2013). Direct to institution market sales include agricultural products sold to schools, colleges, universities or other institution (USDA-NASS, 2016a). Intermediated market sales are those made to grocers or wholesalers to sell foods marketed as locally or regionally produced (Low and Vogel, Reference Low and Vogel2011). While direct to consumer sales remain important, the new market channels have created new opportunities for farmers to participate in local and regional markets, consequently expanding the availability of local foods. In 2015, the inaugural version of USDA's Local Foods Marketing Practices survey revealed that 39% of the $8.7 billion in sales of local foods were made directly to institutions and intermediaries (including food hubs); 27% were direct to retailers; and 35% were direct to consumers (USDA-NASS, 2016a).
Organic food and agriculture
The year 2002 marked a turning point for the organic sector, as it shifted from a fringe movement into a food and agriculture industry newly regulated by the federal government (Dimitri and Oberholtzer, Reference Dimitri and Oberholtzer2009; Youngberg and DeMuth, Reference Youngberg and DeMuth2013). Since that point in time, organic food products of all types have been available for sale in stores in rural and urban areas, with the participation of large and small food companies and farms. The sector saw an increase in retail sales from $8.6 billion in 2002 to $43 billion in 2015, according to industry sources (Greene et al., Reference Greene, Ferreira, Carlson, Cooke and Hitaj2017; Nutrition Business Journal, 2010). The number of certified organic farms was relatively slow to respond to growing demand, but recent data find an 11% increase between 2015 and 2016 (USDA-NASS, 2017). Operations certified to the USDA standards numbered approximately 21,600 in 2015, with 60% certified as farming operations and 40% as handling facilities (Greene et al., Reference Greene, Ferreira, Carlson, Cooke and Hitaj2017). With the exception of biotechnology, which is prohibited by the organic standards, organic farmers have access to the same technological advances used on many farms. For example, precision agriculture is used on organic grain farms (Martens, Reference Martens2003).
At the farm level, the profile of the organic sector differs from that of the overall farming sector. Organic farm-level sales are more heavily weighted toward vegetables, fruit and milk, in both 2008 and 2016 (see Table 3), which reflects the most popular organic products at the retail level. In comparison, farms overall are heavily weighted towards livestock and grain, which accounted for more than half of farm-level sales in both 2007 and 2012. Organic farm-level sales show that the contribution of grain sales in 2008 was greater than the share in 2016, which supports the common perception that not enough domestic organic grain is produced to meet consumer demand for organic grains, including those needed by organic livestock producers. This inability to keep pace with demand has forced the organic food industry to rely on imported ingredients, which is complicated by questions regarding the integrity of organic imported grains. Concerns about the potential for fraud in organic imports led the USDA Office of Inspector General to recommend stricter enforcement of organic products at the border (USDA-OIG, 2017).
Table 3. Organic and all farm-level sales by category

Beyond farming practices, the profile of organic farms differs from that of all farms in several ways. Organic farms are typically smaller, with an average 351 acres in 2016 compared with 434 acres for all farms in 2012 (USDA-NASS, 2017, 2014). The number of organic farms is increasing while the number of farms overall is decreasing. Organic farms tend to be less specialized than the overall average (see Fig. 9). Using the same measures as in the discussion of farm specialization above, the typical organic farm produced close to two products on average in 2008 and slightly less, 1.9, in 2016. For organic farms producing commodity crops, farms are more specialized, with the typical certified organic farm producing 1.5 products in 2008 and 1.4 in 2016.Footnote 4 In comparison, for all farms, in 2012, the specialization index was 1.14 for commodity farms only and 1.32 when specialty crops were included.

Fig. 9. Specialization on organic farms: 2008, 2011, 2014–2016. Notes: Note there are inconsistencies in the data series, as USDA included certified farms 2011, 2015 and 2016 and certified and exempt (those with sales below $5000 a year) in 2008, 2014. The chart reflects certified and exempt for 2008 and 2014. Source: Author calculations from the Organic Surveys conducted in 2008, 2011, 2014, 2015 and 2016. USDA-NASS, 2010, 2012, 2015, 2016b.
Farm and food policy: the Farm Bill in the 21st century
Just as agriculture and food systems have been witnessing change in response to consumer preferences and the food movement, so have the policies that address farming and food. Policy attention to consumer concerns in the USA dates at least as far back as the food safety movement of the late 19th and early 20th centuries that brought about the Pure Food and Drugs Act in 1906 and subsequent regulations governing sanitary food processing and the safety of food additives. Consumer concerns became attached directly to farm policy in the Agriculture and Consumer Protection Act of 1973, the first omnibus Farm Bill on two fronts. With food prices rising rapidly, consumers called for reduced support for production agriculture, and the Food Stamp program, first made permanent by the Food Stamp Act of 1964, became a title in the Farm Bill. Subsequent farm bills have increasingly addressed policy areas focused on broader social goals, expanding nutrition assistance and including environmental requirements and incentives, rural community viability, and most recently, support for alternative farming and marketing systems.
Recent consumer advocacy specifically targets policy support for food systems reform, including increased support for local and regional food infrastructure, specialty crop production, availability of fruits and vegetables in food assistance programs, and assistance for small- and medium-sized farms, also called agriculture of the middle (Lyson et al., Reference Lyson, Stevenson and Welsh2008). The success of that advocacy can be seen in the growing number of provisions in the farm bills of the 21st century that address those issues. While the core of farm policy remains provisions that by and large support conventional agricultural producers, and the largest share of outlays remains dedicated to the former Food Stamp Program, now called the Supplemental Nutrition Assistance Program (SNAP), a number of new policies and programs have begun to address priorities of the food movement (see Table 4).
Table 4. Select 2008 and 2014 Farm Act provisions related to ‘food movement’

Dollar amounts are for the Farm Act's 5-yr period.
a Prior to the 2014 Farm Act, US Department of Health and Human Services and the US Treasury operated the Healthy Food Financing Initiative.
Sources: Johnson and Cowen, Reference Johnson and Cowan2016; Johnson and Monke, Reference Johnson and Monke2018; Johnson Reference Johnson2008.
Commodity policy: from income support to risk management
US commodity policy originated in the 1930s to support what was then a large agricultural sector of diversified farms. A combination of price support policies for field crops and hogs, and surplus disposal and marketing controls for perishable crops provided support across the range of commodities produced commercially on the mid-20th century farms. Since that time, specialization and consolidation have changed the structure of US farming and the way that commodity policies support farming. On average, farm household incomes are no longer below the US median, largely because most farm households support themselves through off-farm income (USDA-ERS, 2018c). At the same time, commercial farms depend on annual operating credit to support production, while facing potentially wide variations in annual revenues (Key et al., Reference Key, Prager and Burns2017). As a result, the policy support system has moved towards providing tools for farmers to manage that risk.
That move towards risk management became fully evident in the latter decades of the 20th century. Fixed direct payments based on historical production and decoupled from current planting decisions introduced in the 1996 Farm Bill removed the link between program payments and production of particular commodities. Following a series of ad hoc supplemental payments, the 2002 and 2008 farm bills added supplemental payments to the original fixed payments to provide assistance during periods of economic stress from steep price and revenue declines (Johnson and Monke, Reference Johnson and Monke2010; Becker Reference Becker2002). Those supplemental programs remained linked to the historical base underlying the original fixed direct payments. Soon after passage of the 2008 Farm Bill, however, the farm economy boomed while the rest of the economy faced recession, leading to the end of fixed decoupled payments that had made payments to producers even as their incomes rose. The 2014 Farm Bill established two new programs, Agriculture Risk Coverage (ARC) and Price Loss Coverage (PLC), still decoupled from production and using historical base, but providing payments only when prices or revenues decline below levels likely to create stress in the farm economy (Motamed et al., Reference Motamed, Hungerford, Rosch, O'Donoghue, MacLachlan, Astill, Cessna and Cooper2018). The 2014 Farm Bill also moved the longstanding dairy program from a price support program to a program that insures the margin between milk prices and feed costs (Motamed et al., Reference Motamed, Hungerford, Rosch, O'Donoghue, MacLachlan, Astill, Cessna and Cooper2018). Recent farm bills have added new programs for research and market development for specialty crops, while continuing longstanding marketing orders and surplus purchase programs.
Simultaneously, since 2000, the crop insurance program has been revised and expanded to encourage greater participation by both private insurers and farmers. Federal crop insurance is a public/private system in which private companies sell and manage policies to insure farmers against multiple yield and revenue risks and government reimburses insurers for delivery costs and reinsures their risk, as well as paying a share of farmers’ premiums (USDA-RMA, 2018a). The combination of introducing revenue protection in the mid-1990s and the increasing shares of premium paid by government since 2000 has, as intended, greatly expanded participation (Motamed et al., Reference Motamed, Hungerford, Rosch, O'Donoghue, MacLachlan, Astill, Cessna and Cooper2018; USDA-RMA, 2018b). Developments in crop insurance to include policies for pasture and rangeland and to improve policies for specialty crops, diversified farms and livestock has continued to expand participation. The combination of expanded crop insurance and the establishment of related disaster programs for uninsured crops and livestock since 2000 ended the nearly annual cycle of ad hoc disaster payments in the first decade of the 21st century (CRS, 2018).
Local and regional food systems
Beginning in 1996, provisions oriented to supporting local and regional food systems have become a regular part of the Farm Bill and the range of programs and level of their funding has increased steadily. The earliest programs focused on supporting community food security by connecting local food production and nutrition programs. Community food security grants provided funds to meet nutrition needs of low-income households by addressing local food production and distribution, including improved access to fresh, nutritious food through such wide-ranging approaches as infrastructure and planning, innovative marketing, farmland protection and job training. Other provisions have expanded the links between nutrition programs and local and regional food providers, allowing the use of food assistance program benefits at farmers’ markets and other direct-to-consumer outlets, including Community-Supported Agriculture (CSA) programs. Programs have supported links between local food producers and school lunch and breakfast programs, especially to increase access to fresh fruits and vegetables (USDA-ERS 2002, 2008, and 2014).
Provisions have also been added to provide direct support for local food systems. Begun in 2002, the Farmers’ Market and Local Food Promotion Program has grown from supporting farmers markets and other direct-to-consumer sales to include support for agri-tourism and most recently to include intermediary businesses that handle food between farm and consumer—e.g., storage facilities, processors, distributors and retailers. The Value-Added Agricultural Product Marketing Development program has included set-aside priority funding to support local and regional food projects that link to underserved communities and projects that support beginning and socially disadvantaged farmers and mid-tier value chains since 2008. Dedicated support was extended to military veterans in 2014 (USDA-ERS, 2002, 2008, and 2014) (see Table 4).
The 2014 Farm Bill also provided for improved credit access for local and regional producers, affirming USDA's authority to make operating loans to local and regional producers and requiring that USDA develop methods to measure the production value of local and regional food crops in order to improve access to credit. Finally, data collection requirements in the 2014 Farm Bill, through the Local Food Marketing Practices Survey, brought added legitimacy to local and regional food marketing by facilitating tracking of its growth and economic contributions (USDA-ERS, 2014; USDA-NASS, 2016a).
Organic agriculture
Organic agriculture made its first appearance in the Farm Bill in 1990, as the Organic Foods Production Act, and established the National Organic Standards under USDA authority (USDA-ERS, 1991; Organic Foods Production Act, 1990). The National Organic Standards took more than a decade to be implemented, and were finally launched in October 2002. With the new organic certification program up and running, the 2002 Farm Bill established a National Organic Certification Cost-Share Program that would pay up to 75% of the costs of achieving certification to help producers meet the considerable costs of transitioning to organic production. In 2008, funding for the certification cost-share program increased from $5 to $22 million, and in 2014, it was increased again to $57.5 million (USDA-ERS, 2002, 2008, and 2014).
Just as it has for local and regional foods, data collection allows analysis of the economic impact of organic agriculture and plays an important role in raising the profile and bringing legitimacy to the sector. Beginning with the 2008 Farm Bill, mandatory funding was provided for dedicated data collection through special surveys and requirements for price reporting and analysis of organic production throughout the processing and distribution value chain. Increased funding and expanded coverage for research also appeared in 2008 and included genomics, field trials and plant breeding, as well as production, marketing and policy constraints to expanding organic agriculture (USDA-ERS, 2008, 2014) (see Table 4).
Further provisions in the 2008 Farm Bill added special attention to organic production in conservation programs, including technical assistance for transitioning producers, financial assistance for organic practices through the Conservation Stewardship Program, and the Environmental Quality Incentives Program, support for developing field buffers through the Conservation Reserve Program, and reimbursement of a share of the costs for organic certification. Producers transitioning to organic certification could also make use of conservation loans. The 2008 Farm Bill made changes in the approach to insuring organic crops, first made available in the Agriculture and Risk Protection Act of 2000 (ARPA, 2000), requiring studies to document the need for premium surcharges for the supposed increased risk of organic production methods. The 2014 Farm Bill required the crop insurance program to expand availability of organic price options to better reflect the price premium producers receive for organic commodities (USDA-ERS, 2008, 2014).
Farm bill support programs for organic agriculture programs have become well-established, having now been in place for decades, and they have seen steady increases in funding. In 2002, the National Organic Certification Cost-Share Program and the Organic Agricultural Research and Extension Initiative together totaled approximately $20 million in authorized mandatory spending.Footnote 5 By 2014, mandatory spending on those two programs and more recently added organic data collection had reached close to $170 million, a ninefold increase and reflective of the growing economic strength of the sector (USDA-ERS, 2014).
Concluding thoughts
As US agriculture has entered the 21st century, longstanding trends in consolidation and specialization have continued, as have the technological change and productivity growth that drive them. To those longstanding trends, however, have been added a growing interest and concern among consumers, often though not always urban-based, with the way their food is produced. Moving beyond traditional consumer concerns about food safety, abundance and choice, the newer concerns have expanded to encompass production practices, land and environmental quality, the community impacts of conventional agriculture, and the wider system of food production and distribution.
While many of these concerns were becoming apparent in the latter decades of the 20th century, they have now entered the mainstream and are influencing behavior of private agriculture and food businesses as well as public policy. Debates surrounding the recurrent Farm Bill cycles, as new farm legislation is considered every 5 yr or so, bear witness to the growing diversity of views about what the US agriculture and food system should look like. Growing pressure to transform the Farm Bill profile from a legislative vehicle for supporting the incomes and productivity of farmers to a vehicle for transforming the food production and marketing system and food assistance approaches, has affected the longstanding political coalition that stood behind farm policy since the middle of the last century.
In addition to increased spending on food movement priorities, recent farm policy has seen a significant shift away from price supports that insulate farmers from market and production risks (see papers by other authors in this special issue). Such shifts include the growth of crop insurance for risk management (a public/private system requiring farm business investment and risk planning), the transition of the dairy program from market price support to margin insurance, and the decline in prioritized research on conventional production, including the cutting edge fields of biotechnology and precision farming. These changes have been moving production agriculture toward a focus on business risk management and greater reliance on private research and technology development, as public support for payments to large-scale conventional agriculture appears to be shrinking. In other words, although the Farm Bill has not yet made a marked shift to food movement priorities, recent Farm Bills reflect the influence of changing consumer priorities in that direction. It seems likely that we will continue to see a growing bifurcation of the US agriculture and food system. The trends to date suggest that large-scale producers and food firms will increasingly focus on private technology development and risk management and on private standards and labeling to meet consumer demands, while smaller scale producers and food marketing firms will focus on local and regional food systems that provide access and attributes not available through the large-scale conventional system. In such a scenario, farm and food policy may move further in the direction of becoming the vehicle for overseeing the balance between the two systems. Whatever the outcome, however, continuing to follow the development of the US farm and food system as the 21st century unfolds can hardly fail to be interesting.
Acknowledgements
The authors thank James MacDonald, Marion Nestle and Nina Ichikawa for their insightful comments.
Note: The findings and conclusions in this article have not been formally disseminated by the US Department of Agriculture and should not be construed to represent any agency determination or policy.
C. Dimitri is a faculty member in the Department of Nutrition and Food Studies, New York University. A. Effland is a Senior Economist with the Office of the Chief Economist, US Department of Agriculture.


