


1. INTRODUCTION
By using a large sample of male heights covering different socioeconomic contexts, this article analyses the evolution of net nutrition inequality in Spain. Two perspectives of socioeconomic analysis (macro and micro) are combined in order to study the evolution of male anthropometric inequalities over the long term. The objective is to determine which socioeconomic scenarios contributed to increases or decreases in height differentials and in which social segments the potential anthropometric convergence or divergence took place. We will start with the hypothesis that historical contexts with high environmental stress contributed to an increase in anthropometric inequality in the absence of significant institutionalised social provisions. In such contexts socioeconomic status would condition, to a greater extent, access to an adequate diet in quantitative and qualitative terms, as would the burden of disease and physical effort in pre-adult ages. These aspects are usually highlighted by auxology as the two main factors of energy extractions which influence the net nutritional status of an individual (Bogin Reference Bogin2001).
In recent decades, anthropometric measurements have become consolidated in the field of social science as alternative or complementary indicators to the classic indicators for analysing the different aspects of human well-being. Specifically, adult height is a widely accepted proxy of the nutritional health and biological standard of living of populations and economic history studies in particular have incorporated this dimension of human well-being in their contemplation of living conditions of past populations and their underlying factors (e.g., income, diet, physical effort or the burden of disease) (Steckel Reference Steckel1995; Fogel Reference Fogel2004; Deaton Reference Deaton2007; Bozzoli et al. Reference Bozzoli, Deaton and Quintana-Domeque2009; Komlos and Kelly Reference Komlos and Kelly2016; Galofré-Vilà Reference Galofré-Vilà2018). These factors affect the growth cycle in a cumulative manner from pre-natal life to adulthood as they condition the degree to which the genetically established anthropometric potential of each individual is reached (Bogin Reference Bogin2001; Silventoinen Reference Silventoinen2003). The abovementioned factors also have a distributive dimension. In fact, the potential residing in height records extends to the study of this dimension as they are often accompanied by other socioeconomic information.
The fundamental interest in the study of the socioeconomic differentials of height is based on the association between height trends and economic modernisation (Fogel and Costa Reference Fogel and Costa1997; Fogel Reference Fogel2004; Deaton Reference Deaton2008, Reference Deaton2013; Hatton Reference Hatton2014). Interestingly, the evolution of economic well-being has not always matched that of physical well-being as demonstrated by the debate on the phenomenon known as the «early-industrial-puzzle» or «antebellum puzzle» (the reduction in height at the beginning of the industrialisation process coinciding with an increase in wealth and income and also inequality) (Craig Reference Craig, Komlos and Kelly2016; Komlos and A'Hearn Reference Komlos and A'hearn2017; Komlos Reference Komlos2019).
Inequality as a specific dimension of living conditions is the field of study within anthropometric research that is currently experiencing the most growth, adopting very diverse approaches, both at macro- and micro-levels: differences in height between individuals from different countries and regions, between socioeconomic groups within the same country or by fields of rural–urban residence (Alter et al. Reference Alter, Neven and Oris2004; Boix Reference Boix2015; Blum Reference Blum, Komlos and Kelly2016). For example, it is a proven fact that a positive correlation exists between the socioeconomic status of individuals and final adult height (Komlos and Kriwy, Reference Komlos and Kriwy2002) and that, at a contextual level, there is a significant correlation (negative) between the average height of the population and certain indicators of economic inequality such as the Gini index in former societies (Boix and Rosenbluth Reference Boix and Rosenbluth2014). Nevertheless, there is no unequivocal evidence regarding the evolution of the differentials over time.
Some studies carried out in European countries have revealed a decrease in the differentials between social classes which is associated with economic progress and the diffusion of the welfare state in the final decades of the 20th century (Hauspie et al. Reference Hauspie, Vercauteren and Susanne1996; Bodzsár and Susanne Reference Bodzsár and Susanne1998). There is also evidence of convergence between territories in countries such as Spain or Italy throughout the 20th century, but not between European countries (Martínez-Carrión Reference Martínez-Carrión2012; Martínez-Carrión and María-Dolores Reference Martínez-Carrión and María-Dolores2017). In fact it is obvious that, despite the economic progress and diffusion of the welfare state during the 20th century, considerable inequalities in the nutritional status still prevail today within the most advanced industrialised societies, not to mention in developing countries (Komlos and Baur Reference Komlos and Baur2004; Bredenkamp et al. Reference Bredenkamp, Buisman and Van De Poel2014).
In Spain, anthropometric research has revealed the principal trends in male height since the end of the 18th century and their probable socioeconomic determinantsFootnote 1. There is also a growing number of studies that analyse the height differentials from different perspectives: territorial differences, fundamentally during the 20th centuryFootnote 2, rural–urban differences, differences between diverse rural contextsFootnote 3, intra-urban differencesFootnote 4, differences in household composition (Ramon-Muñoz and Ramon-Muñoz Reference Ramon-Muñoz and Ramon-Muñoz2017) and social class or educational differencesFootnote 5. These studies have contributed to the analysis of inequality and its evolution during the socioeconomic modernisation processes, given the scarcity of sources on household income distribution until the 1970s. The results obtained are conclusive in some respects. Invariably, we always find large proprietors or entrepreneurs, liberal professionals, white collar workers and students among the tallest segments of the population; in the shorter segments we find a varied group of unqualified workers, day labourers, servants, etc.Footnote 6. For example, it has been shown that in the 19th century, the groups belonging to the socioeconomic elite classes recorded adult heights that can be considered as «modern» (averages of over 170 cm in the case of men) in comparison with averages that hardly exceeded 160 cm for the male population as a whole (for instance, Cámara and García-Román Reference Cámara and García-Román2010; Fuster Reference Fuster2017). At the end of the 19th century, in the city of Murcia, the differences in height in favour of university students were 7 and 8 cm with respect to day labourers and servants, respectively. Servants were found at the lowest level of the nutritional status with average heights of 159 cm. At the beginning of the 20th century, a sample of male students from the Complutense University of Madrid born in the second half of the 19th century recorded an average height of 167.3 cm, when the average for the Spanish male of 21 years of age was around 164.4 cm (Fuster, Reference Fuster2017).
Hereafter, this paper contains four sections. Section 2 describes the height sample, presents the value of some anthropometric parameters as well as the height distributions by a number of key variables and it also details the indicators that are used to cope with inequality. Next, Section 3 presents trends in height and height differentials by birth cohorts and socioeconomic groups. In Section 4, the main results obtained are discussed and Section 5 concludes.
2. DATA AND METHODOLOGY
The analyses carried out are based on an anthropometric sample of more than 350,000 cases which constitutes the largest data sample used to date for the Spanish case. These data correspond to nineteen municipalities distributed over a good part of the Mediterranean region of Spain and are located in the provinces of Castellón (Castellón de la Plana and Villareal), Valencia (Alcira, Gandía, Requena and Sueca), Alicante (Alcoy, Elche, Orihuela, Pego and Villena), Murcia (Yecla, Jumilla, Murcia, Cartagena, Cieza and Torre Pacheco), Albacete (Almansa) and Almería (Vera). This selection of municipalities includes different economic specialisations: from prominent industrial centres, such as Elche and Alcoy, to municipalities with a distinct agricultural nature, such as Sueca, Pego or Requena, also including tertiary or mixed centres such as Castellón de la Plana or Orihuela.
The heights correspond to males aged between 19 and 21 who were registered in the compulsory military recruitment system between 1860 and 1984, corresponding to the cohorts born between 1840 and 1964Footnote 7. The analyses include both the conscripts who were native to each municipality and those born outside. The reason for not excluding the latter is that, in the majority of municipalities, the immigrant component was marginal. In the cases where this component is more significant in certain periods (such as in Elche or Alcoy during their industrial development), we have determined that a significant proportion of the non-native conscripts were from the same region and that, in any event, the results obtained hardly differ from the inclusion or exclusion of these subjects (results not included and available on request).
Within the age bracket mentioned (19–21), we can observe a certain margin of growth (particularly among populations exposed to different factors of nutritional stress). This has led to most of the studies analysing time series to opt for different height correction techniques in ages below 21 years (Martínez-Carrión and Moreno-Lázaro Reference Martínez-Carrión and Moreno-Lázaro2007; Cámara Reference Cámara2009; Ramon-Muñoz Reference Ramon-Muñoz2009). In this study, the available data enable the application of a standardisation based on the 50th percentile (Ramon-Muñoz Reference Ramon-Muñoz2009). As a result, 1.4 cm has been added to the heights of the individuals of 19 years of age, and 0.4 cm to those of 20 years (Table 1). This result is, in any case, very similar to that obtained in the studies mentioned using other techniques.
TABLE 1 INCREASE IN THE HEIGHT OF THE CONSCRIPTS BORN BETWEEN 1876 AND 1890
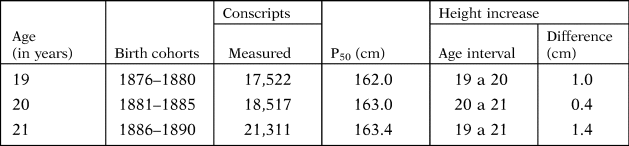
Source: Calculated with data from Actas de Clasificación y Declaración de Soldados y Suplentes.
The height distribution of our sample is approximately normal as we can observe in Figure 1. The same analysis was carried out for different periods (i.e., cohort groups) which rendered very similar results in terms of the shape of the distribution and the descriptive statistics that are calculated (not shown; available on request). The standard deviations are within the margins established for this anthropometric variable based on medical examinations carried out in contemporary populations (Cole Reference Cole2000). Furthermore, there is no truncation of the data, a problem which has been discussed by the anthropometric history literature, as the height measurements in Spain during the period analysed were conducted before the conscripts were declared as being fit or unfit for service. Those heights that are clearly wrong in the records or tabulation were excluded from the analysis as were those lower than 110 cm and over 200 cm (residual percentages in both cases).
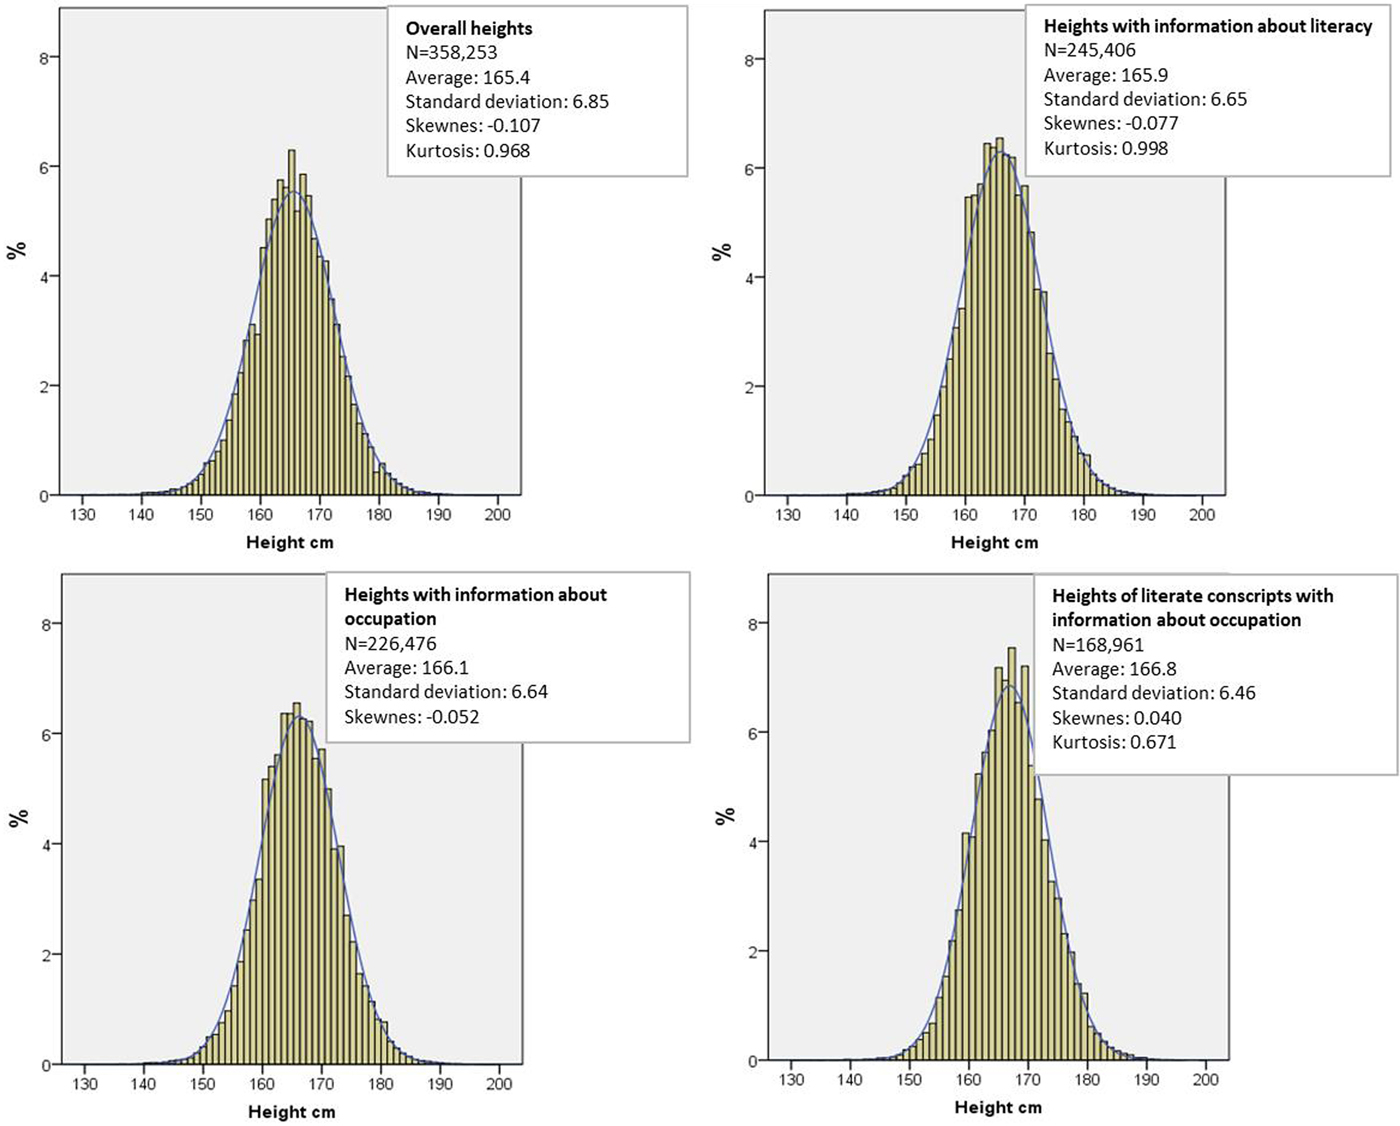
FIGURE 1 RELATIVE HEIGHT FREQUENCIES STANDARDISED AT 21 YEARS OF AGE INCLUDED IN THE STUDY. BIRTH COHORTS, 1840–1964.
Given that the main indicators used in this study are related to the heterogeneity of the sample distribution, it is appropriate to examine the potential correlation between the standard error of the mean and the standard deviation. Figure A1 of the appendix shows that the variation of both parameters is quite narrow over the whole period analysed but it is important to note that the change in the standard deviation (this parameter together with the mean base the calculation of the coefficient of variation) does not correlate with the change in the standard error in a manner that invites us to consider a statistical artefact when analysing the evolution of the coefficient of variation over time. For instance the two cycles of increasing inequality that will be pointed out in the results section match, (1) a noticeable relative decrease of the standard error of the mean (19th century) and (2) a technical plateau of the standard error of the mean (20th century). Overall, and given the small variations of the standard deviation over time, this analysis suggests that the change in the standard error of the mean over time is associated with the increase in the sample size rather than with the measurement error (i.e., the quality of the data in itself).
The analysis of inequality is a many-sided concept which can be approached from different perspectives and encompassed in different indicators. In our case, there are two underlying problems: (1) height is a physical trait which, therefore, not only depends on environmental factors but also on genetic factors and (2) height has the property of being normally distributed in statistical terms. In other words, (1) not all individuals of the lower classes recorded short heights or vice versa and (2) it is expected that specific segments or sub-populations will maintain a normal distribution, irrespective of whether the averages vary. Therefore, not all anthropometric differences are interpretable in terms of inequality in the field of nutritional health, that is, as an unfair and avoidable difference. With these clarifications, two approaches are proposed to estimate socioeconomic inequality based on height.
First, an analysis of the height distribution from a cohort perspective is carried out for which the conscripts have been divided into groups of consecutive 5-year birth cohorts. In this analysis, a measure of the central tendency (the arithmetic average) is compared with a measure of relative dispersion such as the coefficient of variation, resulting from dividing the standard deviation by the arithmetic average (Blum Reference Blum, Komlos and Kelly2016). In a seminal work, Baten (Reference Baten2000) found a high correlation between the coefficient of variation and the differences in average height of different social groups. Based on this evidence, this statistical indicator of heterogeneity has been used as a proxy measure of anthropometric and therefore socioeconomic inequality in historical perspectiveFootnote 8. The logic behind this type of analysis is simple: it seeks to determine whether the height cycles are associated with significant variations in the distribution of this variable (greater or lesser internal heterogeneity measured through the deviations with respect to the mean). For example, as a hypothesis, it is expected that the deterioration of living conditions reflected by a downward cycle of height translates into an increase in the internal heterogeneity of the distribution of heights. The reason is that not all social segments would be exposed equally to the mechanisms of this deterioration (e.g., economic factors). Otherwise (an overall deterioration of living conditions), changes in the dispersion of heights with respect to the average would not be expected, given that the deviations would be proportional in all social segments.
Second, this analysis is complemented by another based on the comparison of socioeconomic groups between which differences in average heights should theoretically exist. In this case, the analysis seeks to confirm whether the hypothetical variations in the internal heterogeneity of the distribution of heights have a social correlative. To this end, the information available regarding both literacy and occupation (whether individuals are able to read and write and whether individuals’ occupation was recorded as «students») has been used. In other words, we established three social categories, illiterate, literate (not students) and students, which serve to stratify the cohort height series.
This analysis is based on the evidence of the positive association between socioeconomic status at a household level and access to schooling, particularly higher education. As we know, the occupation of «student» (dedication to study) until the end of the 20th century was fairly representative of the elite and wealthier middle classes in Spain (Fuster Reference Fuster2017). Admittedly, this association loses consistency when we analyse cohorts whose life cycle developed within a context of greater social mobility and/or democratisation regarding access to formal higher education. It should also be mentioned that the information regarding both the literacy and the occupation of the conscripts is rather exceptional in the documentary sources until the 1880s (birth cohorts born since the 1860s; Table A1 of the Statistical appendix), and these clarifications should be taken into account when interpreting the results.
The calculations include the standard error of the mean in order to construct confidence intervals. Also, the maximum and minimum potential value for the variation coefficient (i.e., computed from the lower and the upper limit of the mean respectively) are presented, showing the high solidity of the parameters used in the analyses. This information is included in Table A2 of the Statistical appendix and the intervals are represented in certain results, where required. In the rest of the results, the differences in height across birth-cohort groups are always statistically significant at the 95 per cent confidence level.
A final technical note refers to the territorial representativeness of the information contained in different analyses. The cohort height series that opens the results section includes a minimum of twelve municipalities for each 5-year cohort group. As we can observe in Table A2 of the Statistical appendix, it is usual for the territorial representativeness to be higher for the majority of the cohort groups. The socio-occupational tests do not include the municipalities of Murcia and Cartagena for which this information was not gathered.
3. RESULTS. HEIGHT TRENDS AND DIFFERENTIALS APPROACHING SOCIOECONOMIC INEQUALITIES IN NET NUTRITION
Figure 2 shows the evolution of male cohort average height in the sample of municipalities studied. The trends obtained are shared, with some nuances, by diverse series elaborated in Spain at a local, provincial or regional level. The first noteworthy evidence refers to the absence of a secular trend in the long term. That is, the cohort height trend in Spain during the period analysed was not always upwards, and when it was, the trend was not linear. This impression is confirmed by the rates of changes in height across birth-cohort groups shown in Table 2.

FIGURE 2 MEAN MALE COHORT HEIGHT AND HEIGHT STANDARDISED AT AGE 21 (CM) 1840–1964.
TABLE 2 ANNUAL RATE OF CHANGE IN MEAN COHORT HEIGHT (%)

Source: Calculated with data from Actas de Clasificación y Declaración de Soldados y Suplentes.
The lack of progress of the anthropometric indicator during the central decades of the 19th century is a well-known fact by Spanish anthropometric history but still noteworthy and transcendent for the debate regarding the standards of living during the economic modernisation process in this country. The cohorts of conscripts born between 1840 and 1889 invariably recorded an average height of around 163 cm. Therefore, in this period of practically half a century, the conscripts registered in the eastern region of Spain hardly recorded positive changes in their net nutritional status.
The immediate factors indicated in previous studies relating to the stagnation of height are associated with the tortuous path of Spain's economic modernisation (Prados de la Escosura Reference Prados De La Escosura2017). Therefore, from the 1850s, there were episodes which constituted setbacks for the biological well-being of the population. Among these episodes we can highlight the upward trend of the prices of subsistence products associated with international wars, domestic financial crises, cycles of poor harvests, etc. (Sánchez-Albornoz Reference Sánchez Albornoz1977; Maluquer de Motes Reference Maluquer De Motes2014). In addition to the inflationary spiral of the prices of basic goods, the deterioration of the net nutritional status revealed by the height series is also explained by the increased morbidity, deducted from the increase in overall and infant mortality (Pérez-Moreda et al. Reference Pérez Moreda, Reher and Sanz Gimeno2015), and the spread of child labour in both the rural environment and the urban context (Borrás-Llop Reference Borrás-Llop and Martínez-Carrión2002). Anthropometric data show harsh working conditions and unhealthy environments for child growth in workshops, factories and mines, which caused stunting (Martínez-Carrión et al. Reference Martínez-Carrión, Puche, Cañabate and Borrás-Llop2013).
A second distinguishable cycle can be observed among the cohorts born approximately between 1890 and 1919. In this period, there was a moderate increase in average height until the approximate threshold of 165 cm. Finally, after the interruption of this trend between the cohorts of conscripts born during the 1920s, the beginning of what we could call the «great Spanish leap forward» in terms of the biological standard of living took place; corresponding to the cohorts born after 1930, particularly those born after 1950. Between the cohorts of the 1930s (measured in the 1950s) and those of the 1960s (measured in the 1980s), there was an increase in average height of 5 cm. What happened among the cohorts born in the 1920s?
If we analyse the degree of potential exposure to contexts of environmental stress throughout the whole growth cycle, we can observe that these cohorts were most exposed to the most dramatic episodes of Spanish contemporary history in terms of living conditions (the Civil War and the first decade of the post-war period) (Martínez-Carrión et al. Reference Martínez-Carrión, Puche, Ramon Muñoz, Segura, Mayayo and Abelló2012; Cámara Reference Cámara2015; Puche et al. Reference Puche, Cámara and Martínez Carrión2016). With respect to the harshness of the environmental context, there was a high prevalence of deficiency and consumptive diseases, such as avitaminosis and pulmonary tuberculosis (Pérez-Moreda et al. Reference Pérez Moreda, Reher and Sanz Gimeno2015), or those related to food hygiene and the water cycles such as typhoid fever and enteritis in childhood (Castelló-Botia Reference Castelló-Botia2011). In addition, the implementation of a strong interventionist food rationing system, which exacerbated the scarcity and lack of food, the decrease in per capita income and the consumption of energy and nutrients were just a few of the most relevant indicators of economic well-being (Barciela Reference Barciela, Llopis and Maluquer de Motes2013). All of this resulted in an increase in the prevalence of malnutrition which is reflected in the increase in the percentage of conscripts who did not reach the minimum height necessary for recruitment (Puche Reference Puche2010; Cañabate and Martínez-Carrión Reference Cañabate and Martínez-Carrión2017).
Previous and subsequent cohorts to those born during the 1920s were able to partially compensate the significant nutritional deficiencies associated with the above-described contexts. Specifically, the average height of the cohorts born after the 1950s (within a context of food security for the majority of the population) reflects the rapid progress of the country within the framework of nutritional and epidemiological transition (Spijker et al. Reference Spijker, Cámara and Blanes2012; Martínez-Carrión Reference Martínez-Carrión2016).
From all of the above we can conclude that in the century and a half covered by the study and until the last cohorts included were examined (1984), there were two periods of crisis for the net nutritional status of the male population of Spain's eastern region. The first, during the central decades of the 19th century, can be considered as a structural situation; the second, associated with the generations born in the 1920s, can be considered as a more temporary situation; that is, derived from the political and economic events of the 1930s and 1940s.
In Figure 3, the relationship between the cohort average height and the internal heterogeneity of the sample of heights represented by the coefficient of variation is analysed. Two main results can be highlighted. The first is the existence of a general pattern which reveals the incompatibility between tall average heights (indicative of good net nutritional status conditions) and high values of the coefficient of variation (indicative of relatively high levels of inequality). In other words, a population cannot reach a tall average height or one which is comparable with contemporary standards when one or several of its segments diverge significantly from the average. In the graphic representation, this is shown by the absence of data in the top right panel.
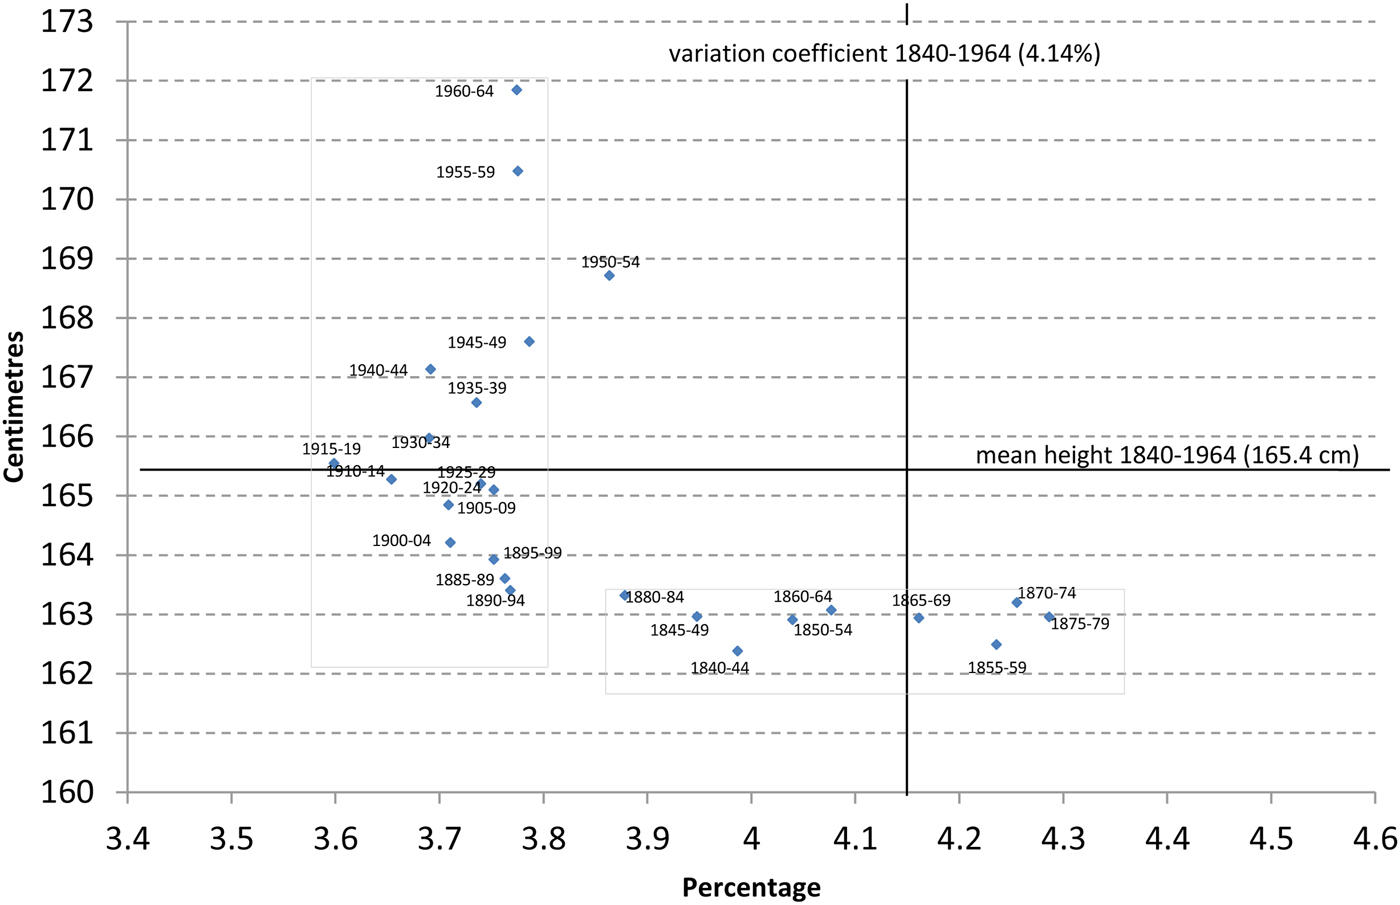
FIGURE 3 SCATTER PLOT. AVERAGE COHORT HEIGHT (CM) AND COEFFICIENT OF VARIATION (PER CENT).
The second result worth highlighting is that the correlation existing between the two indicators (average height and the coefficient of variation) is not linear, nor is it established in strictly diachronic terms. In other words, although all of the cohorts born during the 19th century recorded relatively low average heights, there is a remarkably wide range in the values of the coefficient of variation and these values are not ordered in time. In the 20th century we can observe the opposite scenario: a vertical cluster, indicative of a significant improvement in the net nutritional status with no notable variations occurring in the coefficient of variation.
Nonetheless, conclusions could be established based on a wider chronological perspective: the values of the coefficient of variation stabilise at low levels, coinciding with the first phase of sustained progress of height (the cohorts born from the end of the 19th century; this can be tested by comparing the composition by cohorts of the two clusters represented, namely the horizontal and the vertical).
Figure 4 complements the previous analysis, revealing that the decrease of the coefficient of variation occurs continually between the cohorts born in 1880 and 1919. Subsequently, this indicator had an upward trend, although moderate and with the setbacks of the brief slump in height among the cohorts of the 1920s and the sustained upward cycle of height corresponding to the cohorts born after the 1930s.
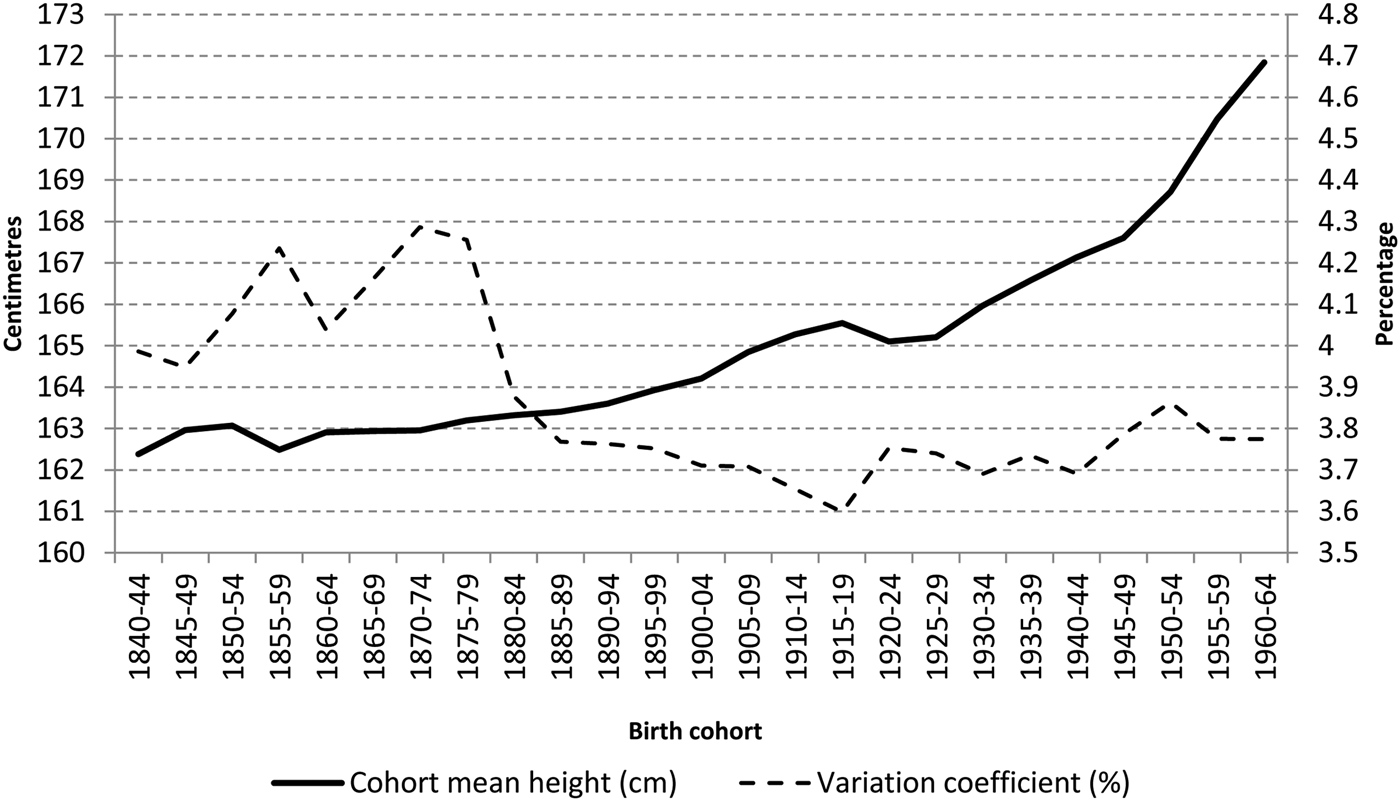
FIGURE 4 EVOLUTION OF AVERAGE HEIGHT (CM) AND THE COEFFICIENT OF VARIATION (PER CENT). BIRTH COHORTS 1840–64.
Figure 5 displays the evolution of different percentiles of height distribution across birth-cohort groups. It is notable that the tendencies are practically parallel, which is confirmed by several gap and percentile ratio analyses (not shown; available on request). However, there are two interesting discrepancies in this general pattern. The first is the lower sensitivity of the segment of tall heights during the period of exposure to the war and early post-war period of the 20th century. The second is that the low average height records of the central decades of the 19th century and, intuitively, the high values of the coefficient of variation, are associated with sagging in the lower height segment with respect to the proportional distance that exists between the other percentiles.
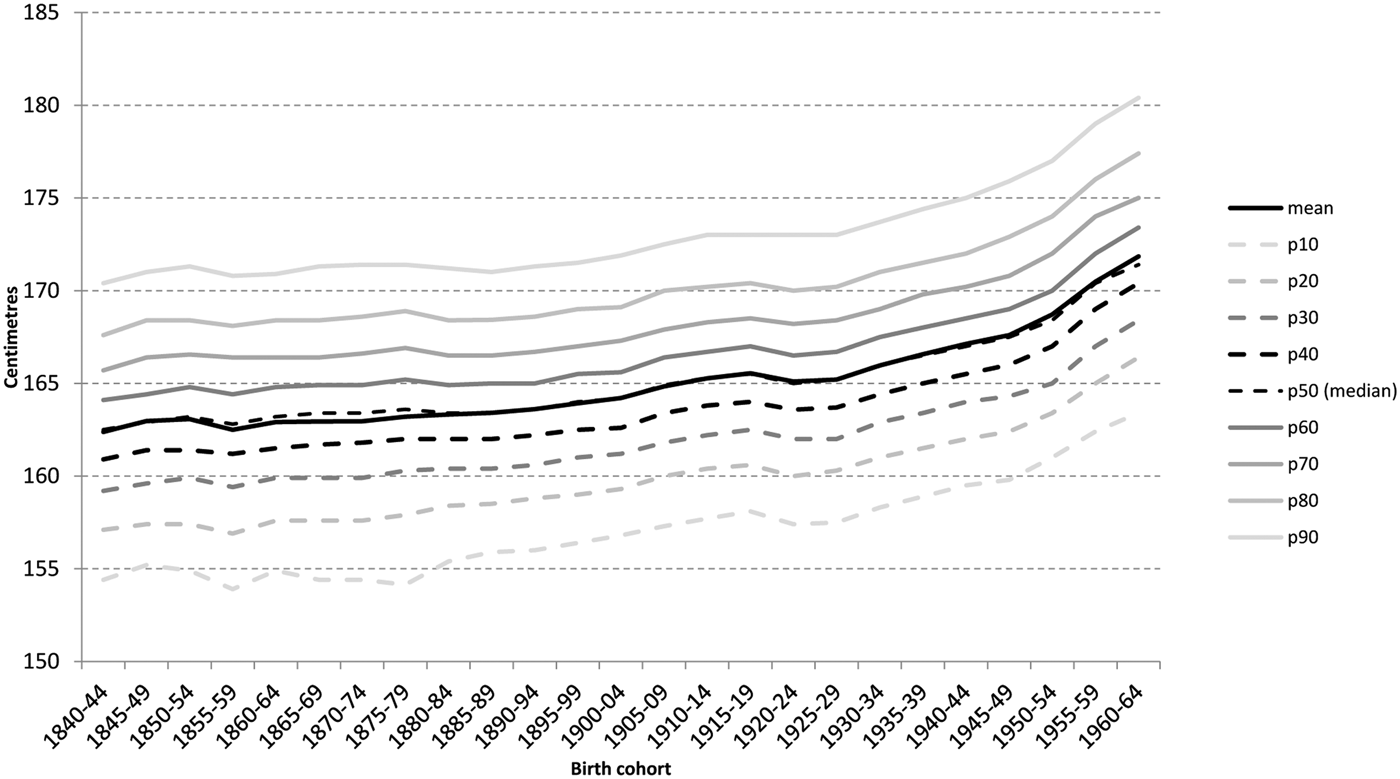
FIGURE 5 EVOLUTION OF HEIGHT PERCENTILES. BIRTH COHORTS 1840–1964.
The results shown in Figure 6 confirm this last impression. In this case, when comparing the extremes of the distribution (highest 1 per cent and lowest 1 per cent), we can observe that the advantage of the tallest segment of the population remained practically unchanged with respect to the average. In contrast, the disadvantage of the shortest segment of the distribution was more notable among the cohorts born between 1840 and 1880. We cannot ignore the fact that the average differences between the two extremes of the distribution reached values higher than 34 cm during part of the 19th century (34.6 cm in the group of cohorts corresponding to 1870–74) and then reduced slightly in subsequent stages and stabilised during the second half of the 20th century at around 30 cm.
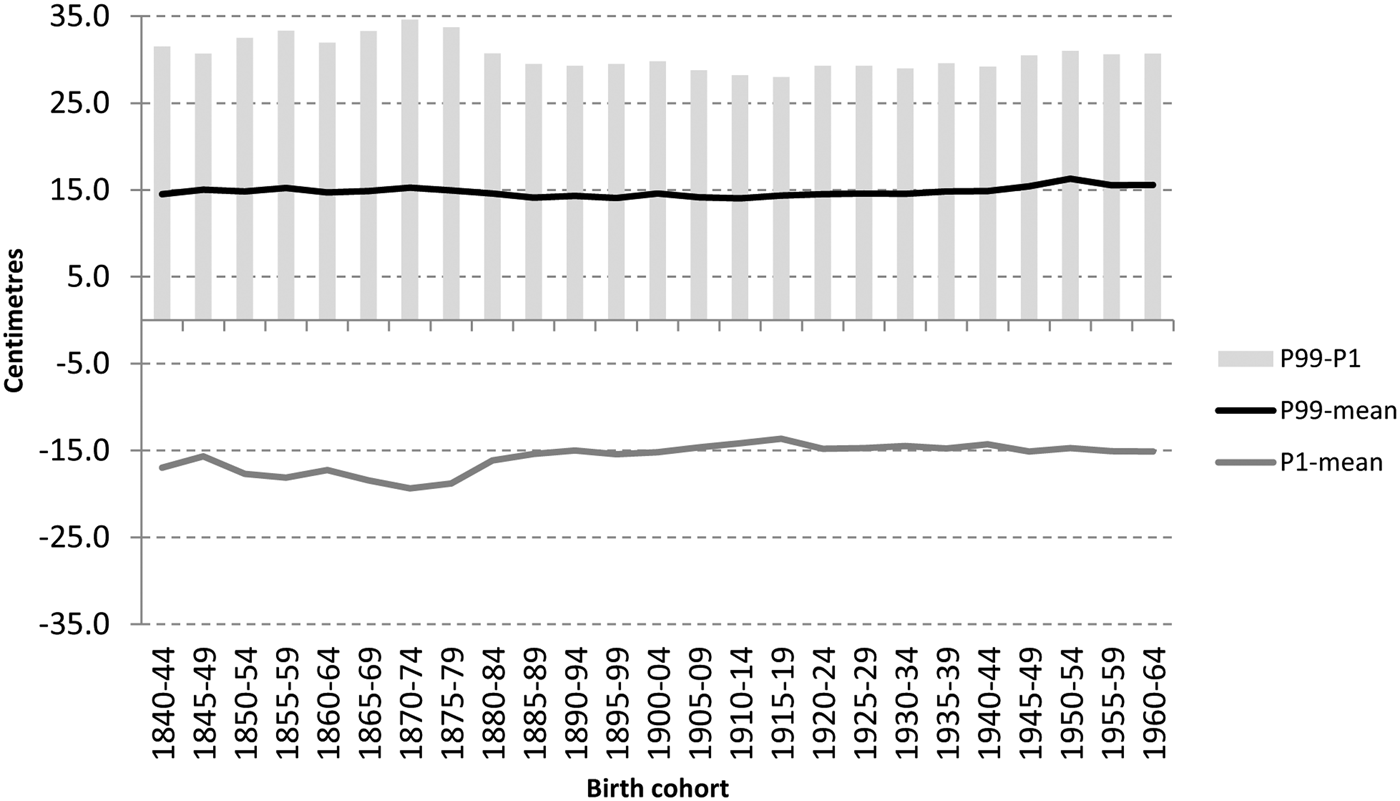
FIGURE 6 DIFFERENCES BETWEEN SEGMENTS OF THE HEIGHT DISTRIBUTION (CM) BY BIRTH-COHORT GROUPS.
Finally, Figure 7 shows the evolution of average height in accordance with the socio-occupational categories constructed (illiterate, literate non-students and students). First, it is worth mentioning the clear and persistent stratification of the net nutritional status in accordance with the socioeconomic proxy used. As we can observe in the trajectory of the confidence intervals of the mean, the differences between the groups are not only statistically significant throughout the whole period analysed but they increased considerably among the cohorts born in the 20th centuryFootnote 9.
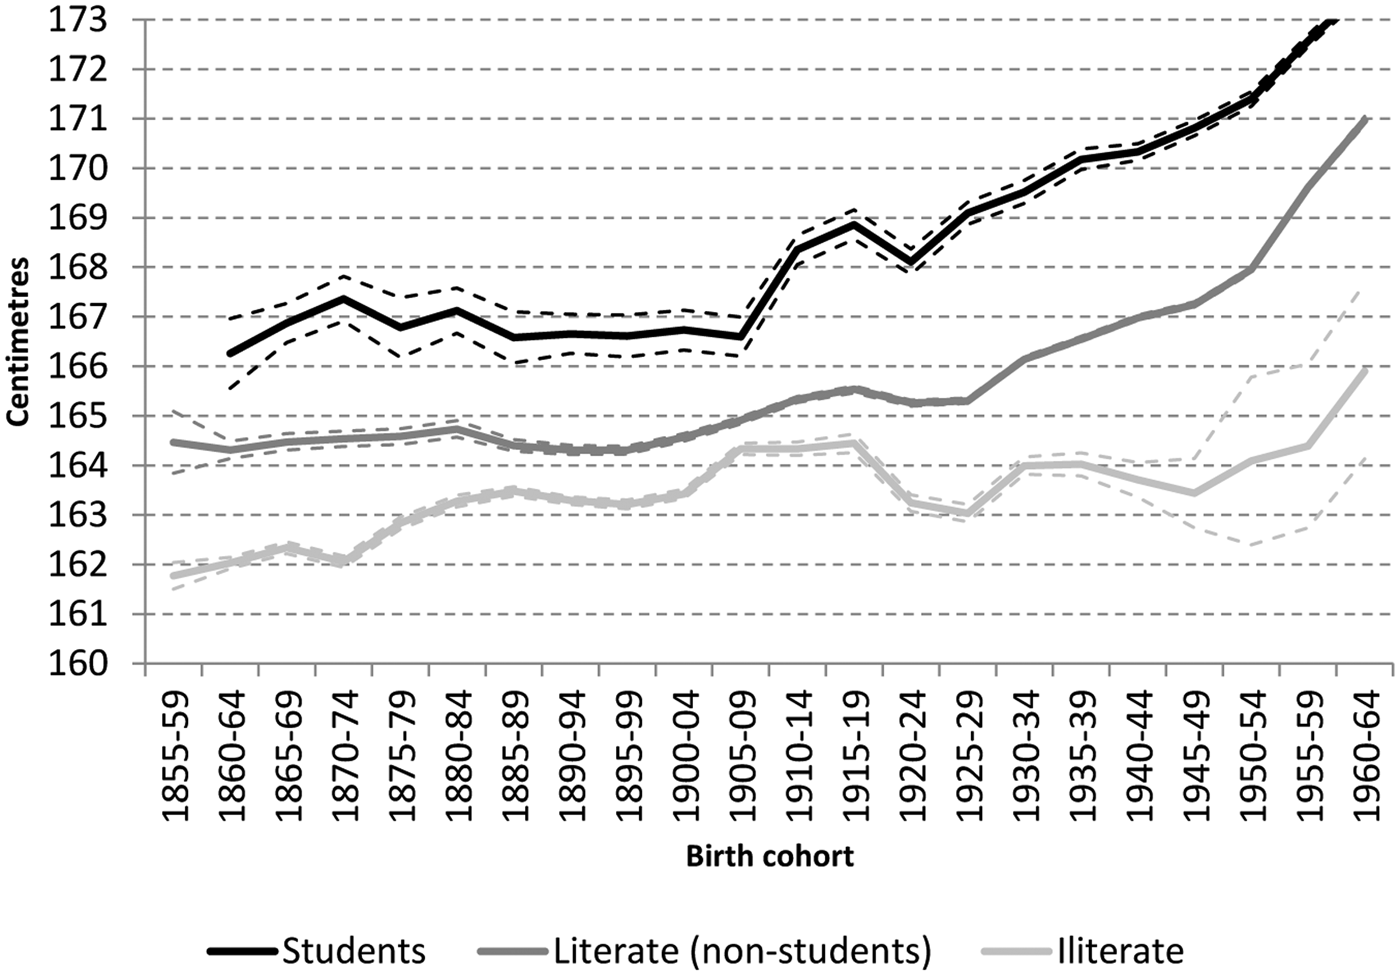
FIGURE 7 COHORT AVERAGE HEIGHT BY SOCIO-EDUCATIONAL CATEGORY (CM).
In our opinion, particular attention should be paid to the trend followed by the illiterate conscripts. Starting with considerable differences with respect to literate conscripts and students during the central decades of the 19th century, they underwent a convergence process between the end of that century and the 1920s. Therefore, coinciding with the greater potential exposure to the structural deficiencies of the war (1936–39) and the post-war period during their most critical growth periods (childhood and adolescence), the group diverged with respect to the rest of the male population. In other words, if we were to identify a penalty associated with the war and post-war period in anthropometric, and therefore nutritional terms, this would undoubtedly be that experienced by the lower classes which are identified in this study through illiteracy. Therefore, the differences between students and the illiterate conscripts which vary between 4 and 5 cm among the cohorts born during the 19th century increase to 6 cm among the cohorts born at the beginning of the 1940s and, taking into account the confidence intervals of the mean, could vary between 6 and 8 cm among the successive cohorts. A similar trend can be observed in the differences among the literate (non-student) conscripts.
There is no doubt that these results could be due, in part, to the change in the socioeconomic extraction of the conscripts making up each stratum (e.g., students and/or illiterate). This means that, for example, the illiterate population represents more impoverished segments of the population with the passing of time. However, it is convenient to remark that the social divergence observed in anthropometric terms cannot be interpreted as a mere artefact of such a potential composition effect as the coefficient of variation actually indicates an increase of the internal heterogeneity within the height sample (this is displayed in Figure 4). Also, it seems appropriate to insist that the divergence process occurred among the cohorts whose growth cycle developed in substantially better environmental conditions that those experienced in preceding periods. In other words, by way of conclusion, the results shown in Figure 7 indicate that the progressive normalisation of the environmental conditions in terms of both food inputs (upward trend) and the burden of disease (downward trend) contributed in this phase of the 20th century to giving visibility to a dimension of net nutritional inequality probably hidden in the previous century by the extraordinary burden of environmental stress that was carried by the population as a whole.
4. DISCUSSION
In this paper, trends and differentials of cohort height have been studied using a large sample of males from nineteen municipalities in eastern Spain. The growth cycle of the cohorts of conscripts analysed covers the period between 1840 (birth year of the first cohort of the study) and 1984 (year in which the last cohort of the study, born in 1964, was measured). The anthropometric differentials have been analysed using two complementary approaches: the heterogeneity of the height sample in successive groups of cohorts of conscripts (study of percentiles and coefficient of variation) and average height differentials among three socio-occupational groups: illiterate conscripts, literate conscripts and conscripts who declared their occupation as «student».
With respect to the first approach, evidence shows that the first phase of the increase in male cohort height in the eastern region of Spain, after the stagnation during the central decades of the 19th century, was associated with a decrease in the coefficient of variation. The explanation for this association seems to reside in the dynamics of the low percentiles which, in fact, prove to be more eco-sensitive and are those which, ultimately, determine the average height cycles. In contrast, the high percentiles remain stable over time. For this reason, when the heights of the lower part of the distribution increase, the internal heterogeneity of the sample decreases (i.e., with respect to the mean), which can be interpreted as a reduction of inequality. Subsequent increases in cohort height are not associated with decreases in the coefficient of variation. The explanation which can be given is, for now, hypothetical: the progressive standardisation of the environmental conditions would contribute to a statistical standardisation of the values so that, probably, the composition of the height distribution segments is increasingly more attributable to genetic factors than socioeconomic factors. This hypothesis could be tested in future research by comparing the relative weight of the social groups or classes of the population as a whole, and of each segment of the anthropometric distribution, with the difficulty involved in defining these groups or classes from a diachronic perspective. Focusing on the results of this study, we could claim that the increases in average height were related to the reduction in inequality during the first globalisation period and that this relationship lost consistency in subsequent periods.
In line with previous studies, the trends and rates of variation of cohort height reveal two critical periods for the nutritional status of the population: the central decades of the 19th century (cohorts born between approximately 1840 and 1880) and the environmental context related to the Civil War and the early post-war period which particularly affected the cohorts born during the 1920s.
With respect to the nutritional crisis of the 19th century, the underlying factors have already been commented on: it was a period in which a succession of economic crises occurred, which, in specific cases, lowered the standard of living to the subsistence level. The frequency of these crises hardly gave the growth cycle of the above-mentioned birth cohorts the chance to activate the compensatory mechanisms of physical growth during the period preceding the end of the cycle (Beekink and Kok Reference Beekink and Kok2017). Within this context, our results reveal an association between relatively high values of the coefficient of variation and relatively low values of average height. In other words, there was a poor nutritional status that was unequally distributed. In particular, we can observe that the internal heterogeneity of the sample and the low average height records are, to a large extent, derived from the behaviour of the lower extremes of the distribution, undoubtedly identifiable with the most impoverished social sectors in terms of nutrition (the differences between this segment of the population and the highest segment were as high as 35 cm in the 19th century). Based on a specific height threshold (165 cm) recorded during the last quarter of the 19th century, the inequality in the distribution of heights moderated and, in fact, reached its minimum levels among cohorts who experienced a moderate average growth, namely those born between 1880 and 1919.
According to the socio-occupational differentials, the results reveal a clear socio-anthropometric stratification in the 19th century. Then the groups tended to converge from the end of this century and during the first two decades of the 20th century (a period which economic historiography has named «the first globalisation»). Finally, the differentials increased during certain periods of the 20th century. This timing of the differentials coincides with the observations of previous studies for other countries and regionsFootnote 10. Our findings suggest that the first globalisation and the agricultural crisis at the end of the century (crisis agraria finisecular) could have favoured the improvement in the net nutritional status. The fall in prices of food products and the improvement in real wages, accompanied by improvements in the production and distribution processes of the food chain had a positive impact on the quantity and quality of the nutrients available. It should be noted that the fall in the prices of the most basic food products at the end of the 19th century essentially coincided with the more significant decrease in the anthropometric differentials. In this sense, one of our initial hypotheses is confirmed: periods of poor nutritional health were accompanied by greater inequality and after the phases of widespread improvement, the inequalities were smaller.
The nutritional crisis of the Civil War and the 1940s, experienced mainly by the generations born in the 1920s and 1930s, is, undoubtedly, the largest crisis in Spanish contemporary history; at least the largest recorded in terms of net nutritional status indicators such as height. Our results indicate that recovery from this severe nutritional crisis was not accompanied by a reduction of inequality (when measured using both the coefficient of variation and the differentials between socio-occupational groups). Thus, the results do not verify our second hypothesis (i.e., that of the reduction of inequality in a stage of relative improvement of nutritional conditions and of the potential implementation of the welfare state provisions). Therefore, cohorts of Spaniards who lived a good part of their growth cycle under progressively better environmental circumstances experienced unequal growth. Recent studies point in this direction and highlight that malnutrition and inequality in the net nutritional status persisted beyond the years of hunger (1940s), even into the early 1960s, especially in poorer and backward areas of Spain (Cañabate and Martínez-Carrión 2018; Tormo et al. Reference Tormo-Santamaría, Trescastro-López, Galiana-Sánchez, Pascual-Artiaga and Bernabeu-Mestre2018). Therefore, in our opinion, the results obtained in this work would not be completely attributable to the variation in the internal composition of the socio-educational groups established, as the coefficient of variation increased (moderately) among the cohorts born from the 1920s. In fact, in the cohorts corresponding to the period 1950–54, this indicator reached a value that had not been recorded since 1880–84.
In this respect, it is worth analysing the real magnitude of the intervention of the incipient welfare state in Spain (Espuelas-Barroso Reference Espuelas-Barroso2017) and also exploring the socioeconomic differentials at a micro-level perspective in greater depth (i.e., through other alternative estimates of socioeconomic status than those used in this study). That said, and taking the results obtained with caution due to the change in the internal composition of the groups established (students and illiterate conscripts are obviously not representative of identical socioeconomic strata with the passing of time), we should not ignore the null convergence in height among the birth cohorts brought up during the fascist autarchy. On the one hand, the percentiles and the coefficient of variation reveal that the internal homogenising process of the height sample (with respect to the mean) stopped during this period. On the other hand, and more clearly, the height series by socio-educational categories did not experience any significant convergence among the students and the rest of the literate population, while beforehand the opposite case was true; there was a distinct divergence due to the downward trend of the illiterate group. This result is in line with the findings of previous studies which used other socioeconomic categorisations (Ayuda and Puche Reference Ayuda and Puche2014). We agree that the improvements in the standard of living associated with economic progress could have mainly benefited the middle classes and to a great extent marginalised the lower classes. For example, Ayuda and Puche (Reference Ayuda and Puche2014) find that the anthropometric differences between the group defined as HIS2 (Hisclass—middle income class) and HIS5 (Hisclass—lower income class) not only did reduce during the 20th century but doubled between 1910 and 1980. Similar observations can be made between the socio-educational categories analysed in this study during the second half of the 20th century.
It is important to point out that the epidemiological context was evolving during this period towards a phase with a much lower burden of disease, which would lead the nutritional balance or net nutritional status to depend to a greater extent on the inputs and to a lesser extent on outputs which, in the past, were high for the population as a whole. This seems to be testified in the studies that have addressed the relationship between indicators of health and height (Pérez-Moreda et al. Reference Pérez Moreda, Reher and Sanz Gimeno2015). This takes us to a central issue: that of the inequality in terms of nutrition which existed in Spain during the Franco period, with large sections of the population (particularly the poorer classes) with diets at subsistence levels until well into the 1950s. Poverty and inequality therefore constituted a duo that probably contributes to explaining the results obtained in this study.
Finally, we believe that it is interesting to compare the results obtained (inequalities in nutritional health) with those produced in the economic field. Broadly speaking, this comparison reveals that the factors of net nutritional status reflected in the adult height only depend on economic inequality to a certain point. Prados de la Escosura (Reference Prados De La Escosura2008) addresses the evolution of inequality from the mid-19th century to the year 2000, analysing the gap between the average incomes of capital owners and workers together with the dispersion within each group. In accordance with the Gini index, economic inequality grew sharply until the end of the First World War (a period in which we have found convergence in anthropometric terms), there was a marked reduction until the Civil War, after which it grew notably until the mid-1950s (which seems to coincide with our results). Therefore, in this respect, we must conclude that the inequality in the net nutritional status is not correlative of economic inequality, which is understandable based on the fact that not all of the contributing factors to the net nutritional status depend on income and economic growth. However, we should say that this is a field in which we believe more in-depth analysis is required in future studies given the probable dissimilarity of the cohort patterns and trends of inequality in different environmental contexts, at both geographical and socioeconomic levels.
5. CONCLUSIONS
In terms of height trends the results of this paper largely support the existing empirical evidence on the evolution of Spaniards’ net nutritional status during the socioeconomic modernisation process. In the long run, the large sample of heights from eastern Spain that has been used confirms two crises of the net nutritional status. These crises were of different nature, that is to say, they present clear contrasts in their causality.
The first one is observed among the birth cohorts of the central decades of the 19th century. Even though the net nutritional status of the population was poor at the time in Spain (and also among most European societies), the decades of 1840–1870 witnessed the stagnation of cohort height and even drop cycles of this indicator in this country. The key factor that has been underlined in this and previous studies is the synergy between poor harvests, the increase in the prices of basic goods and the subsistence crises together with the expansion of pre-adult labour in poor and/or unhealthy conditions (including, among others, factories, workshops and mines). As a consequence, the rise of morbidity which is indicated by an increasing trend in mortality during this period also contributed to the deterioration of the net nutritional status. Actually, Spaniards’ height ranked among the shortest in Europe which probably had a negative effect on labour productivity at the time.
The second period of deterioration of the net nutritional status principally affected the cohorts born during the decade of the 1920s. In this case, the increasing evidence provided by recent research in Spanish anthropometric history tends to point to the political and economic events which occurred during the decades of the 1930s and 1940s as the mechanism which triggered the stagnation of male cohort height. In this regard, we believe that the severe deprivation related to the Spanish Civil War and, especially, to the autarchic policies of the 1940s (the hunger years) leads to stunting in broad segments of the Spanish population. The anthropometric evidence is consistent with other indicators such as per capita income, real wages and food consumption, all of which worsened during that period.
Our work has also looked at height differentials associated with the socioeconomic status approached by educational attainment which is in close relation with income distribution at a society level (Bleakley et al. Reference Bleakley, Costa, Lleras-Muney, Boustan, Frydman and Margo2014; Lundborg et al. Reference Lundborg, Nystedt and Rooth2014). This has also been done over time (i.e., across birth-cohort groups whose physical growth cycle took place during the different socioeconomic contexts described in this paper). In this regard, evidence obtained confirms the ability of anthropometric history to analyse socioeconomic inequality. Also, and more importantly, our results indicate that inequality may play a major role in the explanation of the cycles of deterioration of the net nutritional status as displayed by the stagnation and/or decrease of cohort mean height. We found a solid association between the major episodes of crisis of the net nutritional status and the largest height differentials by social groups. For instance, the largest height gap between the poor (illiterate) and the well-off (students), which also coincides with the highest values of the variation coefficient, is associated with the structural crisis of the net nutritional status experienced during the central decades of the 19th century. Also, the stagnation or drop of cohort height had more to do with the negative performance of the lowest percentiles of the height distribution which, again, is mainly attributable to the situation of lower classes. A similar relationship between height trends and height inequalities has been found among cohorts born during the 1920s. On the contrary, mean height increased more rapidly as the variation coefficient and height differentials by socioeconomic status moderated.
A last, but not unimportant, conclusion of this paper refers to the interpretation of the impact of environmental conditions through the physical growth cycle which extends from pre-natal life to adulthood. Our results indicate that the influence of such environmental conditions on height must be taken into account in a cumulative manner and not simply departing from one of the critical periods for physical growth (i.e., early infancy). Aside from infancy, in line with a growing body of literature which emphasises the consequences of environmental disruptions on the adolescent growth spurt (Bogin Reference Bogin, Gillman, Gluckman and Rosenfeld2013; Hirvonen Reference Hirvonen2014; Beekink and Kok Reference Beekink and Kok2017; Depauw and Oxley Reference Depauw and Oxley2018), this work demonstrates the major role that pre-adolescent and adolescent living conditions may play in explaining the results of the final height a cohort attains in adulthood. We believe that this is particularly the case of developing societies and/or low-income contexts at both macro- and micro-levels. In the case of Spain the effect of the autarchic period on one of the two critical periods for physical growth (pubertal growth) is apparent, thus hampering the potential growth attainable during adolescence and the late stage of physical development.
ACKNOWLEDGEMENTS
This study was funded by the projects HAR2016-76814-C2-2-P (MINECO/FEDER/UE) and 19512/PI/14 (Fundación Séneca, Agency of Science and Technology of the Region of Murcia). JM Martínez Carrión has benefited from the help by «Jiménez de la Espada» (FS. Ref.: 20171/EE/17). We firstly thank the anonymous referees who have largely contributed to the improvement of the original version of the manuscript. We also acknowledge comments and criticism to early versions of the manuscript, namely: the conference and workshop audiences at the 12th International Conference of the Spanish Association of Economic History (AEHE), the Socioeconomic Meeting of the Society for the Advancement of Socioeconomics (SASE), the 18th World Economic History Conference, the 38th edition of the Spanish Health Economics Association (AES) Conference, as well as the participants of the economic history seminars at the Autonomous University of Barcelona (CED-UAB), University of Buenos Aires (UBA), Torcuato Di Tella University (UTDT), Instituto Ravignani, Universidad de los Andes (Uniandes), University of the Republic (Udelar) and the Universidad Santiago de Chile (Usach).
STATISTICAL APPENDIX
TABLE A1 COMPOSITION OF THE SAMPLE BY BIRTH COHORT
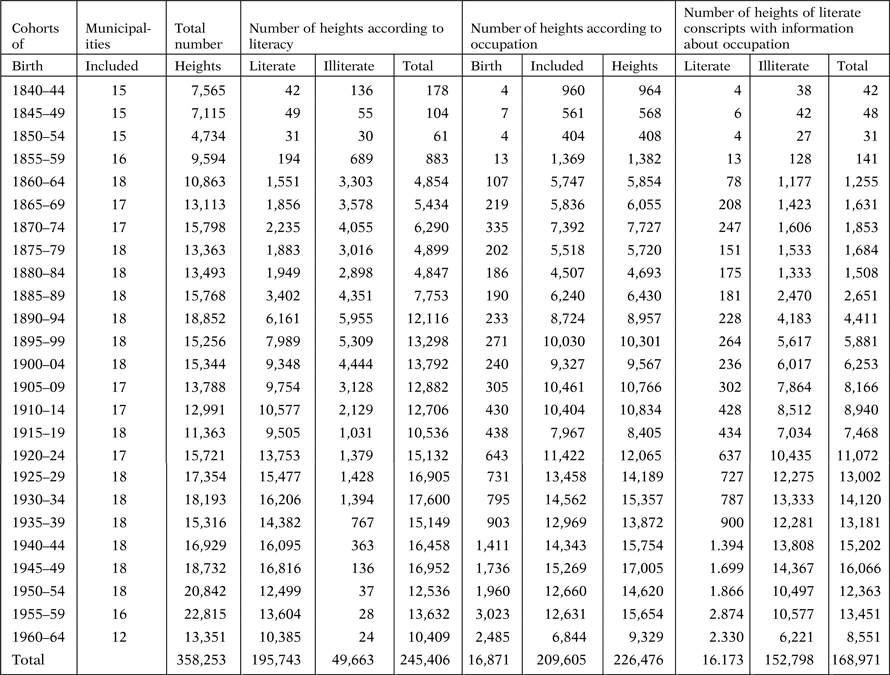
TABLE A2 DESCRIPTIVE STATISTICS OF THE SAMPLE BY 5-YEAR BIRTH COHORTS (1840–1964)
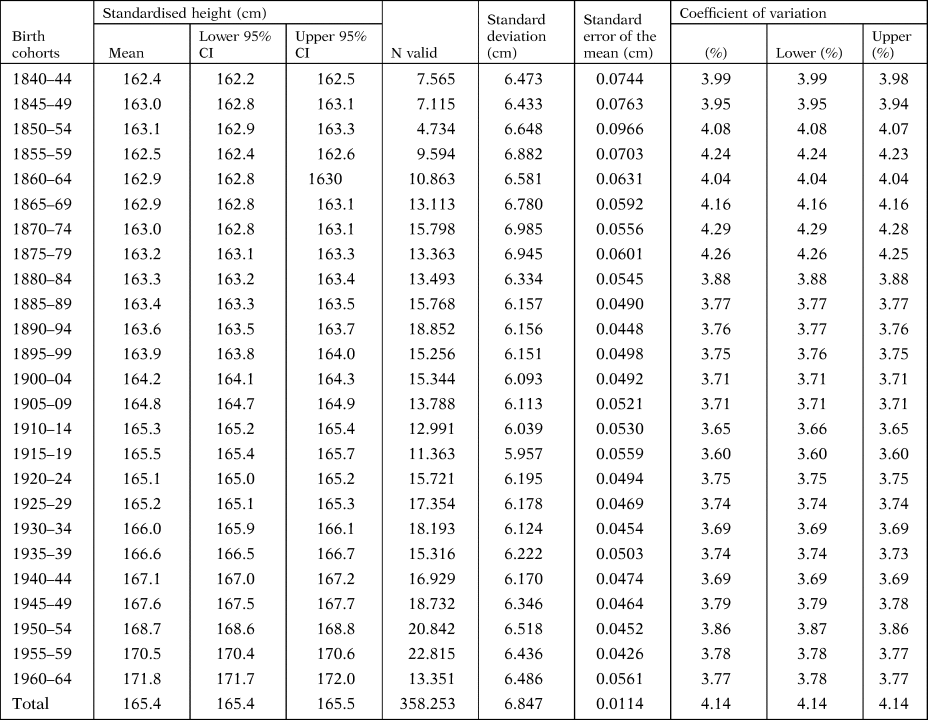
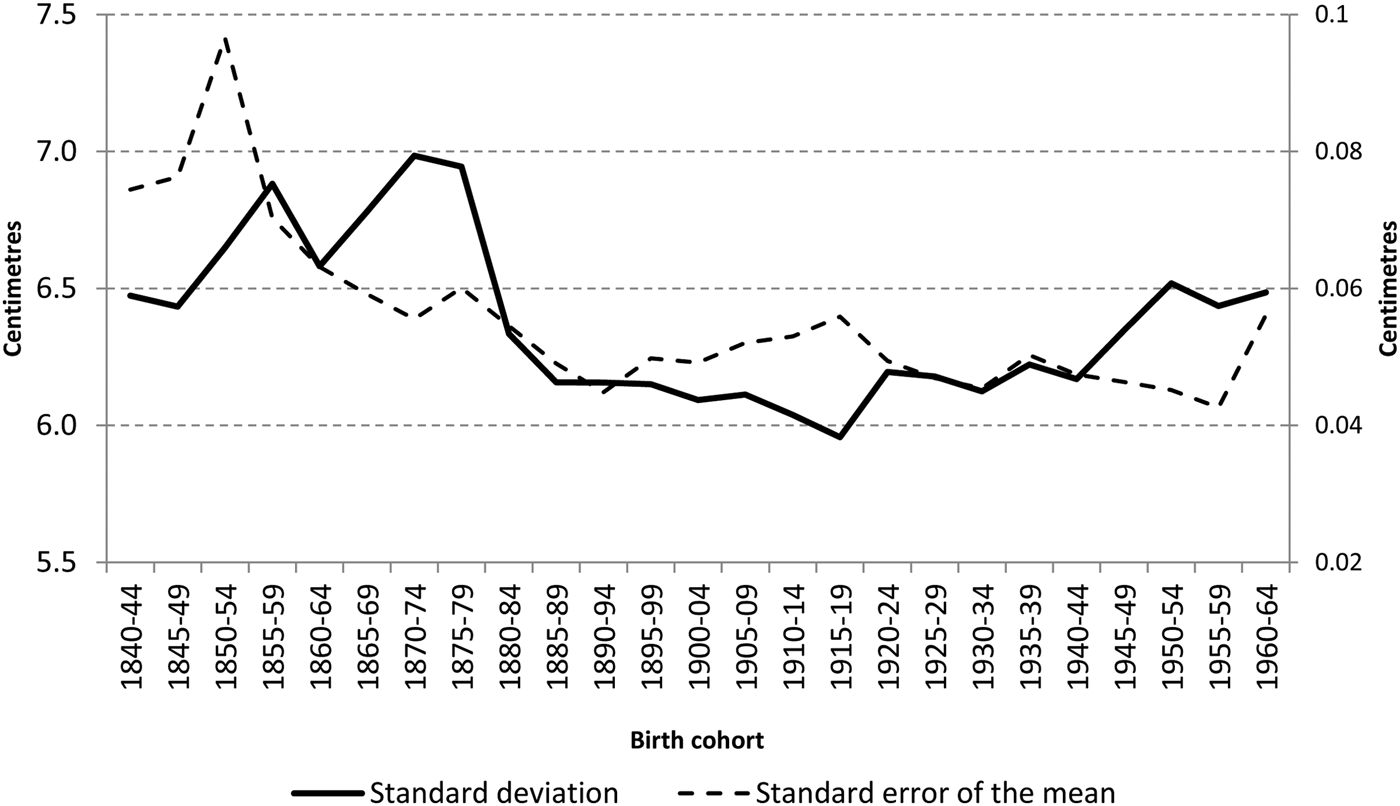
FIGURE A1 EVOLUTION OF THE STANDARD ERROR OF THE MEAN AND THE STANDARD DEVIATION (CM) ACROSS BIRTH-COHORT GROUPS.


