1. INTRODUCTION
The purpose of this paper is to provide the first systematic attempt at reconstructing the yearly values of Mexico’s foreign trade during a period characterised by internal turmoil and external threats. It begins with Mexico’s independence from colonial rule (in 1821) and ends 3 years after the restoration of the republican government after the Maximilian Empire’s interregnumFootnote 1 . During this period, Mexico experienced a complex process of building a nation amid rather unstable politics, a reason why it has sometimes been called the «era of chaos». This label has received criticism from scholars who consider that there is some logic to be found behind the apparent disorder. Nevertheless, it remains true that the first 50 years of national history were not only eventful, but also plagued with factional struggle, predatory regimes, secessionist threats (Yucatán) which at times were accomplished (Central America, Texas), and several international wars. From the latter, one ended up in the loss of half of Mexico’s original territory (1848) and another led to the ephemeral reign of an Austrian emperor (1862-1867). The period also embraces what may be considered the pre-statistical era in Mexico’s history, as very few quantitative data are available from official sources, not only on trade but also other macroeconomic indicators. With regard to foreign trade, information only exists for 7 years within the first decade after independence, at times only for the main customhouse, the port of Veracruz. After 1828 there is only 1 year in which this kind of data are available (1856). In fact, 1871 is the last year for which no information on foreign trade is known to exist; as for the fiscal years 1872-1874, detailed statistics were published for the first time by the Mexican governmentFootnote 2 .
There has been an intense and longstanding debate about Mexico’s economic performance during this era. The (now) conventional view holds that the economy suffered a profound crisis during the independence wars and was unable to recover in the decades that followed due to the destruction of infrastructure and productive assets, capital flight, and territorial fragmentation. All these factors, together with a series of political and institutional drawbacks, would have created a prolonged condition of economic recession or stagnation (Coatsworth Reference Coatsworth1990; Cárdenas Reference Cárdenas2015). Revisionist approaches sustain that, apart from the direct impact of the independence war and the slow recovery that followed, the Mexican economy experienced alternatively periods of recession and economic revitalisation according to the circumstances. More specifically, there would have been a stage of economic recovery between the 1830s and the early 1850s followed by a 15-year recession due to the turmoil caused, first, by the civil war between liberals and conservatives (1857-1861), and later by the French intervention and the war against the Maximilian Empire (also called the Second Empire) (1862-1867). Economic recovery may not have been apparent nationwide due to the prevalent fragmentation, but would have been experienced at specific intervals at a regional level (Sánchez Santiró Reference Sánchez Santiró2010). These interpretations are contrasting and hard to reconcile. Up until now, the main obstacle to solve this conundrum has been the lack of sound statistical evidence illuminating the overall trends and features of the Mexican economy within this long and — at least in this regard — obscure period of Mexico’s history. The aim of this paper is to contribute to start filling this serious gap in quantitative information and, consequently, to help elucidate this important issue in this country’s historiography.
This paper provides a reconstruction of the yearly values of Mexico’s foreign trade (imports and exports) based on foreign sources for all the years in which some data are available between 1821 and 1870. The first section provides a general description of the sources available and a brief summary of the previous approaches to this issue; it also presents the general criteria adopted for this exercise. Section 2 portrays the sources, method and criteria for the reconstruction of exports, as well as the yearly value series that we propose at this stage of the research. Section 3 offers the same for the case of imports. To conclude, section 4 presents both series in current values and the balance of trade, as well as some reflections on the long-term performance of Mexico’s foreign trade that arise from the newly built series.
2. ANTECEDENTS, SOURCES AND GENERAL CRITERIA
2.1 The Mexican Information Available
There is great difficulty in trying to build annual series of Mexico’s trade for the period before 1870. Regarding Mexican sources, the official register of trade barely includes 8 years in total, seven from the 1820s plus the year 1856 and some of them are only for the Veracruz customhouse. The remaining 42 years are challenging in terms of statistical information from Mexican sources, particularly with regard to imports. In the case of exports, no complete data exist, but some partial information that may be useful to compare with the results of a reconstruction exercise is available. On the one hand, there is an annual series of gold and silver exports between 1825 and 1851 and a more complete series of coinage, the latter including all the mints operating in the country and embracing the entire period. While the first series may be directly compared with the reconstructed trade data, the second is not of the same nature. First, because part of the silver extracted could be exported (be it legally or smuggled) in bars. Second, because not all the precious metals coined were necessarily exported, and even if they were, this did not necessarily happen in the same year as their coinage. Part of the silver minted was used as means of payment in the domestic market, and part of it was hoarded by merchants or entrepreneurs for future use. Therefore, this latter series may only be employed as an approximation to the long-term output trends. Finally, there is a partial series of cochineal production and, for a few years, exports, which may be used to estimate exports of this dyestuff between 1821 and 1854 (Herrera Canales Reference Herrera Canales1977). As specie and cochineal were the main components of Mexico’s export basket within this period, this partial information provides an approximate figure that originates in Mexican sources and comprises about 80 per cent to 90 per cent of Mexico’s exports between 1825 and 1851 (the years for which both series are available). This is by no means a high quality or a reliable estimate, but provides something to compare with the reconstructed series stemming from external sources.
The scant information available from Mexican sources, together with other data and abundant qualitative material (laws, treaties, etc.) for the entire period, were compiled in a couple of volumes (Lerdo de Tejada Reference Lerdo De Tejada1967 [1853]; Tardiff Reference Tardiff1968). Later, Inés Herrera compiled the evidence available from Mexico’s sources in a couple of publications (Herrera Canales Reference Herrera Canales1977, Reference Herrera Canales1980). These include all the official data in existence and a detailed account of the composition of trade for most of the 1820s, the year 1856, and 3 years in the early 1870s.
On the other hand, some efforts have been made to gather the information originating in Mexico’s main trading partners for at least part of this troublesome era. All of them include at least partial data on the bilateral trade with Mexico as recorded by Great Britain, France, the United States and, at times, GermanyFootnote 3 . Other important works have dealt with the trade of particular countries with Mexico for at least part of the period under studyFootnote 4 . As valuable as these approaches are, none of them has ventured to put these figures together and assess their percentage participation in order to provide at least an approximate picture of the evolution of Mexico’s total import and export trade for the entire period.
2.2 The Partners’ Records of Mexican Trade
Our aim is to use official records of foreign trade and complementary sources (particularly consular reports) generated by Mexico’s main trading partners in order to estimate the total yearly value of imports and exports for the entire period. Consular sources may stem from consuls situated in Mexico but also in other countries, as long as they contain information that is relevant for our purpose. The results of this exercise may not be completely accurate, as sources are incomplete and the period involved unstable, but we are confident that they will reflect, with an acceptable degree of approximation, the levels and trends of Mexico’s foreign trade throughout this period.
As soon as Mexico achieved its independence, Great Britain (GB or UK) started to record its exchange with the newly born country (UK 2; UK FC 1856-1871). However, for other countries it took some time before recognising its existence and identifying it as a country separate from the rest of the Spanish empire. In the trade report corresponding to the year 1823-1824, the United States Treasury Department still included a group named Spanish South America and Mexico; it was not until the following year (1824-1825) that Mexico appeared as an independent entity in the United States (US) official statistics (USA 2; USA 3). As for France (FR), Mexico made its appearance as a separate nation in its records only in 1825 (France several years; France 1878). Belgium (BE) registered trade with Mexico as soon as the former came into existence as a nation (Belgium several years), while Spain (SP) started recording its international trade more than a decade later (Spain 1849-1870). Finally, there were cases in which trade was registered by sub-national units before national unification took place, such as Germany (DT) and Italy (IT). In both, we have considered data available from those units as an approximation to the country’s totalFootnote 5 . In summary, although some flows of exchange may be traced from the initial year, it is only starting in 1825 that the main commercial powers included Mexico as a separate country, thus making a more complete view of its international trade possible.
For some years within the period, there is also scattered trade information from other countries, such as the Netherlands, Chile and JamaicaFootnote 6 . However, this information is less reliable, as it comes from sporadic consular reports instead of regular official figures, and in most cases is of little statistical significance. For these reasons, we decided to include this evidence only for the purpose of contrasting it with a series based on a smaller but more consistent sample of trade partners. This means that the reconstruction is based on the trade that Mexico sustained with the seven countries that at some point provided regular information or, as we explain shortly, information that makes it possible to estimate the gaps. In any event, once the main trading partners have been considered it does not make a large difference to pursue broader country coverage.
Perhaps the hardest issue involved in re-building trade statistics in the absence of the country’s own records is to determine the share of trade that was captured by each of the partner’s statistics available to us. For the case at hand, it is highly probable that Mexico sustained continuous even if modest intercourse with countries in the Caribbean, Central America and the rest of Latin America, and with some European countries not included in our sample. It is well known that throughout the colonial period the New Spain also held significant trade with Orient. Did this come to an end after independence, did it continue unfolding as direct trade, or did it take place indirectly, by means of other powers’ intervention? So long as this trade was no longer carried out by Spain once Mexico became an independent country, most of it was taken over by British and, later and to a lesser extent, American ships, and was probably recorded in their own bilateral trade with MexicoFootnote 7 . This was also the case of British or French colonies in the Caribbean. So, even if its geographic distribution is inaccurate, the value of this trade should be accounted for in the totals.
2.3 Some General Criteria
Trade values appear in the sources in the currency of each country. We have converted these figures into US dollars using Federico and Tena-Junguito’s (Reference Federico and Tena-Junguito2016) exchange rates. In some countries and periods, official sources provide the value of trade calculated according to fixed (official) prices. In our sample, this was the case in France (1825-1846), Belgium (1831-1845) and Great Britain for import records (1820-1852)Footnote 8 . We have revaluated the original figures using the respective export and import price indexes of each of these countries taken from Federico and Tena-Junguito (Reference Federico and Tena-Junguito2016). Whenever possible, in order to avoid duplication in the case of European countries, especially for import records, we have preferred special trade (instead of general trade), and excluded transit trade and imports that were re-exported. We do not apply this criterion to US, UK and FR exports to Mexico. First, because to the extent that either overland or maritime re-exports through the US reduced transportation costs from Europe, US traders acted as commercial intermediaries of French and especially British merchants exporting to MexicoFootnote 9 . So we assume that most of the transit and smuggling trade originating in Europe with Mexico as final destination, arrived to United States ports and was captured by US records as «exports of foreign merchandise to Mexico». Second, because we have evidence that UK re-exports to Mexico were mainly colonial produced goods, such as silk manufactures from India that exclude the possibility of double counting of exports from another European country. Finally, re-exports from France may include some transit trade but the probability is very low, because before 1870 European countries, including France, used to register export destination as the first country of landing, that is, Hamburg or British exports to France re-exported from this country to Mexico were registered as exports to France.
In all the sources employed, exports to Mexico are valued f.o.b. (free on board), that is to say, excluding transportation costs (freight, insurance and merchants’ commissions)Footnote 10 . As for commodity imports from Mexico, the US provides an equivalent to f.o.b. data (f.a.s.)Footnote 11 , while European countries present c.i.f. (cost, insurance and freight) values, that is including transportation and insurance costs. As for specie exports, the sources and method employed for the reconstruction yield f.o.b. data. In order to provide an estimate of the balance of trade, we need to have c.i.f. import and f.o.b. export values and so have estimated a freight factor for imports and commodity exports to Europe. Finally, countries used different criteria regarding the time period in which they recorded their trade. The US used fiscal years ending 30 September up to 1842 and 30 June from 1843 on, while European countries adopted the calendar year. Whenever necessary, data were adjusted to represent calendar years.
3. THE RECONSTRUCTION OF MEXICAN EXPORTS
As is well known, throughout the period under study Mexico was one of the most important silver producers in the world. At that time, many countries had a silver or bimetallic (gold and silver) monetary standard, and for this reason, silver played a crucial role in international transactions and as a reserve currency held by governments and institutions of numerous nations. In the case of Mexico, as the production of commodities for export was rather limited, silver played a crucial role in providing the country with import capacity and foreign exchange. As we will see shortly, specie exports, mainly composed of silver, were by far the most important component of Mexico’s export basket during the 19th century.
Even though this is not the place to discuss the complex theoretical issues involved in this matter, we need to establish the criteria with which we consider this type of movements as part of Mexico’s foreign tradeFootnote 12 . The fact that silver functioned as an international currency meant that Mexico’s specie exports, mostly made up of silver, could easily be carried out with purposes of monetary use. This was certainly the case of gold (in bullion and coin) and silver coins. As for silver bullion, in principle it should not be considered currency, as long as it was «sold like other commodities on markets governed by a changing demand and supply», which is to say, as «a commodity which takes its chances on world market prices that bear no resemblance to its legal value at home» (Gardner Reference Gardner1953, p. 166). Even though silver bullion exports were prohibited in Mexico for most of the period under study, there is evidence that part of the silver exported consisted of bullion. In this form, its ultimate use — for industrial or monetary purposes — is impossible to discern. For this and other reasons, specie exports not conducted by monetary authorities are usually considered as of a non-monetary kindFootnote 13 . This does not mean, of course, that silver coins transferred abroad were not used as currency and as a means of payments; it rather points to the fact that private transactions do not affect currency reserves.
However, because of the difficulty of discerning in each case «whether the movement is monetary or non-monetary», and because of «the close inter-relations» between them, «gold [or, in our case, silver] must be kept separate from ordinary merchandise transactions even though it represents a commodity movement» (Gardner Reference Gardner1953, pp. 159-160). It is for these reasons that in what follows we distinguish between commodity and specie exports, the latter including gold and silver in bullion and coin.
For the reconstruction of Mexico’s exports, we need to rely on its partners’ import records. With regard to the country coverage available for this purpose, between 1821 and 1823 only GB incorporated Mexico in its trade accounts, although it only considered commodity imports (excluding gold and silver specie). Starting in 1824 the US also added Mexico to its official statistics, recording commodity as well as specie imports. This early information provides a partial view of Mexico’s sales abroad, as it is evident that it held commercial relations with more countries than those keeping account of them. Mexico’s export trade can be properly reconstructed using its partners’ sources only starting in 1825, when the two main European powers (GB and FR) and the United States (US) kept regular registers of their commercial intercourse with this country. To this group of three countries (G3) we can add, starting in 1831, Belgium, for a G4 that kept a steady record of its bilateral trade with Mexico for the rest of the periodFootnote 14 . For Germany, there is information available on imports and exports at Bremen and Hamburg for a couple of years in the early 1840s and then starting in 1847. These reports show that imports consisted only of merchandise (not specie) and were rather small until 1850 (an average of 56,000 dollars per year), which means that by the years they gained in importance, the yearly record is available. Another important partner for Mexico should be Spain (SP), for historical reasons, but direct trade with this country was virtually suspended until 1836, for political reasonsFootnote 15 . Even though some scattered data are available for earlier years, a steady record of Mexico’s imports in Spain starts in 1849 and continues for the rest of the period. Finally, there is sporadic information of trade with Italy (before 1862, the ports of Sardinia and Naples), which includes the year 1843 and then 5 years in each of the following two decades. This makes for a group of seven countries (G7) for which the relevant figures of imports are available starting at some pointFootnote 16 . There is another small group of countries for which some trade data by country exist for part of this period and Mexico does not appear as an origin of imports, or appears on occasion with negligible values (<10,000 dollars/year); these are Venezuela, Brazil, Guatemala and Ecuador (Guayaquil)Footnote 17 . This sporadic trade is not considered separately, but estimated as part of the residual.
3.1 Commodity Export Trade
Figure 1 presents the aggregate value of Mexico’s commodity trade between 1820 and 1870 as recorded by (a) all the countries from which information is available («all partners», which represent a maximum of nine partners); (b) a group of four countries (G4), namely US, GB, FR and BE; and (c) a group of five countries (G5), including DT.
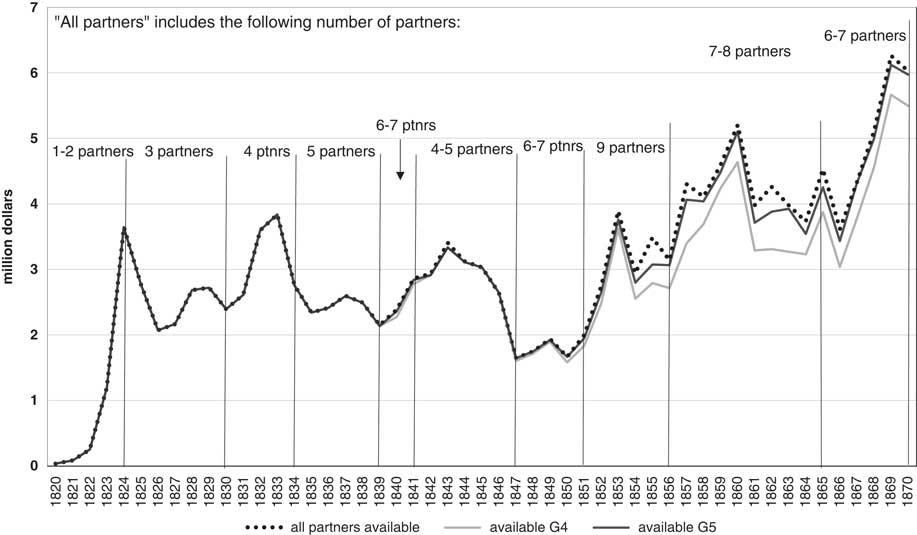
FIGURE 1 MEXICO’S COMMODITY EXPORTS VALUE: ALL PARTNERS AND AVAILABLE G4 (US, GB, FR, BE) AND G5 (+DT), 1821-1870 (MILLIONS OF DOLLARS) Note: For sources and method, see text. US: United States; GB: Great Britain; FR: France; BE: Belgium; DT: Germany.
Several things stand out. First, as previously stated, the reconstruction of commodity exports can start properly only in 1825, when information from at least three important partners is available. Second, once we have data from those three partners (GB, FR, US) the level of trade does not necessarily depend on the number of partners we add. For instance, commodity exports appear to have been larger in 1829, with a sample of three partners, than in any year between 1835 and 1839, with five partners included. Also, exports fell in the years 1847-1850 despite a larger geographic coverage (six partners). Third, exports to countries other than the G4 were of very little statistical significance before 1850. Starting in that year, the number of partners for which we have information increases, but only one, DT, is of some importance.
In fact, the difference between the G5 series and the «all partners» series in most cases is slim, and is largely explained by trade with Italy and Spain. One country’s figures cause a visible contrast in one particular year on only a small number of occasions. The most important such case is the Netherlands in 1855, as this country registered 110,000 dollars of imports from Mexico in only that year while it recorded 0 in any other year for which information is available. Chilean consular sources reported some imports from Mexico, which started in 1852 and ended in 1864 (with the following years stating 0). Their value is very unsteady, going from <10,000 dollars in some years to around 80,000 in others and as much as 200,000 in 1 year (1855). The average figure for this trade is 25,000 dollars annually. One more case is Jamaica, which registers imports from Mexico between 1835 and 1844 for an average of 10,000 dollars annually.
For the purpose of this reconstruction, we have decided to build an aggregate using a sample of the seven countries (G7) that maintained a steady trade with Mexico and for which records are more regular, namely, United States, Great Britain, France, Belgium, Germany, Spain and Italy. It is clear that none of the aggregates built with the statistics of partner countries will give us the total value of Mexico’s commodity exports. There will always be a residual, represented by the value of Mexican exports to any of these countries in years for which there is no information or to other countries not included in the sample.
The question, then, is how to assess this residual to get an estimate of the total value of Mexico’s commodity export trade. To this end, we need to have as precise an idea as possible of the actual geographic distribution of that trade throughout the period. Unfortunately we have only a few clues about this. On the one hand, the register of the number and flag of vessels which arrived at and departed from Mexican ports in 1826-1828 and the tonnage of cargo carried by them. On the other, the account, by port of origin (for 1850) and by country (for 1872), of Mexico’s import (not export) value (Tardiff Reference Tardiff1968, I, pp. 305-306, 328, 573; Herrera Canales Reference Herrera Canales1980, pp. 201-288; SHCP 1880). This information may seem fragile for the objective of ascertaining the country distribution of Mexico’s exports throughout the period. Fortunately, our purpose is more modest than that, as we only need to assess the aggregate share of Mexico’s exports that is captured by the statistics of the countries in our sample, because the rest represents the residual we need. According to these sources, the share of our G7 sample for exports went from 89 per cent (on average) between 1826 and 1828 to 94 per cent in 1850 and 96 per cent (of total import value) in 1872. Even if this information is not accurate, it depicts a clear trend towards a growing geographic concentration of Mexico’s commodity export trade. For lack of better data, we will use those percentages to calculate the residual that we will use to estimate the total yearly value of Mexico’s commodity exports. We do this by adding to G7’s commodity import value a progressively lower percentage that starts at 11 per cent of that value in the 1820s and ends at 4 per cent of it in 1870.
However, we need to take a step back in order to solve a previous question, which is how to fill the gaps in some countries’ yearly information within our sample (G7). This circumstance affects Spain, Germany and Italy (SP, DT, and IT, respectively). As mentioned earlier, in all these cases we have at least one figure of Mexico’s commodity imports for the early 1840s and a more regular account starting later in that decade. These pieces of evidence indicate that trade coming from Mexico was of lesser importance before 1850, and became larger after that year (see Figure 2). Taking that into account, we will use the few years for which information is available in the early 1840s to calculate the percentage of Mexico’s total export trade that each of those countries absorbed before they recorded it consistently. In the case of Spain and Italy, import trade stemming from Mexico represented on average barely 1.5 per cent of the estimated total for all the years in which information is availableFootnote 18 . As for Germany, estimates have to be made just for a period in which imports from Mexico averaged 2 per cent of the total. The resulting percentage for each year is then used to estimate the equivalent value of imports arriving to each of those countries in the years for which direct information is missing. Figure 2 combines the result of the estimate with the actual records of import trade from Mexico for each of these countries.
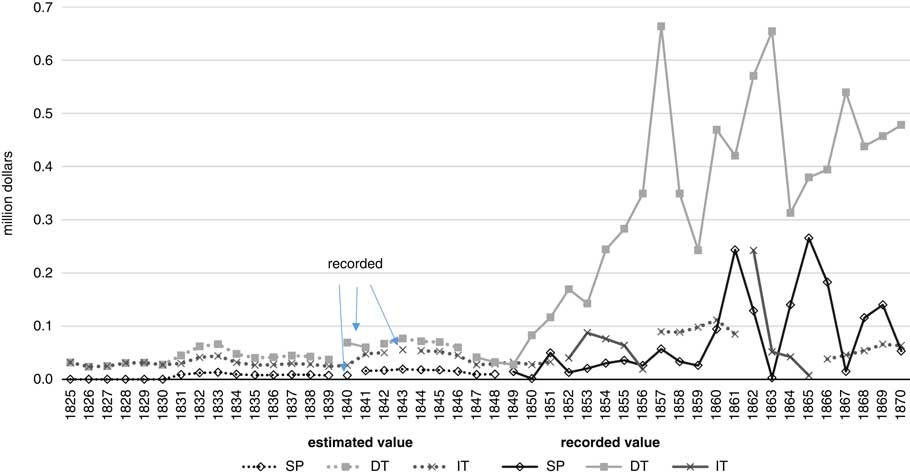
FIGURE 2 PARTNERS THAT PROVIDE INCOMPLETE DATA: ESTIMATED AND RECORDED VALUE OF COMMODITY IMPORTS FROM MEXICO, 1825-1870 (MILLIONS OF DOLLARS) Note: For sources and method, see text. SP: Spain; DT: Germany; IT: Italy.
As may be observed in Figure 2, commodity import values from Mexico were recorded in 1840 for Spain, 1840 and 1841 for Germany (Hamburg and Bremen), and 1843 for Italy (Sardinia and Naples), before being regularly registered starting in 1847 (DT), 1849 (SP) and 1852 (IT). Broken lines represent values estimated using those scattered figures, while continuous lines illustrate values stemming from recorded figures. As the regular record of trade always started before it gained in significance, a miscalculation in the early (estimated) years does not affect the total in any serious manner.
Once a complete (G7) series has been obtained, we estimated the geographic distribution of Mexico’s commodity exports to its main commercial partners, as well as the residual, for the entire period. Table 1 presents the results for one in every 5 years.
TABLE 1 ESTIMATED SHARE OF MAIN PARTNERS AND RESIDUAL IN MEXICO’S COMMODITY EXPORTS

Note: For sources and method, see text.
GB: Great Britain; FR: France; BE: Belgium; SP: Spain; DT: Germany; IT: Italy; US: United States.
Even if it may not be entirely accurate, this is the first approach that we have to the geographic distribution of Mexico’s commodity exports to its main trading partners. It is of interest to observe the strong volatility of exports to each particular country. The larger importance of the US at the beginning of the period, and the preeminence that it recovered in its last year is also noteworthy. Also interesting is the way in which Germany grew in importance while France faded to some extent, an event that was only temporarily prevented by the French intervention in Mexico in the 1860s. Finally, the table shows the estimated value of the residual, which remained fairly similar despite its decreasing share, and of total commodity exports in those years.
Using the information available and the estimates made to fill the gaps and account for the residual, we have built a complete series of Mexico’s commodity exports between 1825 and 1870. One more adjustment is necessary for the series to be usable for the purpose of calculating the balance of trade: yearly values must be f.o.b., that is to say, net of transportation and other costs. As previously explained, US import data were recorded f.a.s., thus satisfying this condition. European data, on the other hand, were always registered c.i.f. In order to convert these figures into f.o.b. values, we have calculated a freight factor and deducted it from the aggregate value of European imports originating in MexicoFootnote 19 . Figure 3 presents both estimates of the total value of Mexico’s commodity exports.
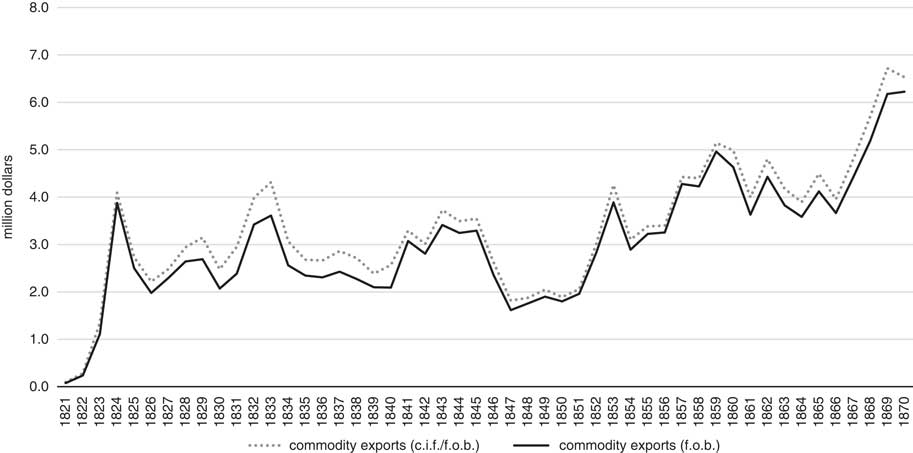
FIGURE 3 MEXICO’S COMMODITY EXPORTS, 1825-1870 (C.I.F./F.O.B. AND F.O.B. VALUES, MILLIONS OF DOLLARS) Notes: as explained in the text, the series named as c.i.f./f.o.b. combines United States (US) imports from Mexico, recorded in a f.o.b. equivalent (f.a.s.), and European imports from Mexico, compiled at c.i.f. values. The series named commodity exports (f.o.b.), on the other hand, was calculated by discounting the estimated freight factor from the value of European imports from Mexico. For sources and method, see text.
This figure has been built with all the information that, to the best of our knowledge, is at present available, and with explicit and consistent criteria. It is worth mentioning that the value of commodity exports in the final year (1870) is practically identical to the value achieved for that year in Kuntz-Ficker’s (Reference Kuntz-Ficker2010, table A.3) estimate for the period 1870-1930, even though the method and sources employed were not exactly the same. Yet, the quality of the series is not even throughout the period. On the other hand, one of the series in the graph provides figures that combine c.i.f. values (for Europe) and f.a.s. values (equivalent to f.o.b.) for the US. The other series was built by subtracting whatever costs of freight, insurance and commissions were added in the records of Mexico’s partners, providing an entirely f.o.b. value series of commodity exports.
This figure deserves some comments. First, the high volatility of Mexico’s commodity exports, which, as may be corroborated in Figure 1, is not the result of a varying number of partners used in the reconstruction, but of a changing participation of the country in foreign trade. Second, the fact that Mexico’s merchandise exports started at a very low level and remained rather small until the last years of the period. Within this general condition, the stagnation experienced by Mexico’s commodity exports before, say, the mid 1850s, is noticeable, not to mention the fall provoked by the US-Mexican war (1846-1848) and its aftermath. By contrast, starting in 1857 Mexico’s sales abroad reached a higher level and remained high for an entire decade, although always amid some volatility. It was only in 1868, in striking coincidence with the re-establishment of peace (and the republican government) after the defeat of the French army, that commodity exports experienced considerable growth, reaching an unprecedented level by the end of that decade.
3.2 Specie Export Trade
In spite of their importance, the reconstruction of Mexico’s specie exports has been a serious challenge for historians. The main reason lies in the fact that Great Britain did not include specie in its trade statistics until 1858. Starting in that year, specie imports originating in Mexico appear in those records only as a part of an aggregate of countries, from which it is, at first sight, impossible to discern Mexico’s share. The problem arises from the fact that throughout this period Great Britain was the main importer of specie, which it used in its world trade and particularly in its intercourse with Asia. This means that without this information any attempt at reconstructing the values of Mexico’s specie transfers is doomed to be inaccurate. Apart from Great Britain, Mexico exported specie to the United States and France, which kept regular accounts of those flows. Germany was a much less important destination for Mexico’s specie exports, and these appear in that country’s official statistics starting in 1846. In summary, what needs to be estimated from indirect methods is the specie directed to Great Britain, as that sent to the other important destinations is available from official records.
In order to reconstruct Mexico’s specie exports to Great Britain, for lack of better sources, we have resorted mostly to consular reports. They included specie carried in official as well as merchant vessels, which were considered to be heading for England even though occasionally they had a different destination. This means that a report of specie exports in British vessels could easily embrace exports meant to pay for imports stemming from Ecuador, Peru or Chile, and of course from China and other Asian countries. In particular, the shipping of specie to ports in Orient, handled by Spain during the colonial times, fell in the hands of Great Britain after independence, as His Majesty’s ships took care of most of Mexico’s «treasure» from the Pacific coastFootnote 20 . To the extent that this was the case, these transfers were usually included in British consular reports. Starting in the 1850s, however, there is evidence that part of these movements started to be carried out by the US. Reports state that in those years a growing share of Mexico’s specie exports from the west coast headed for San Francisco at the expense of Great Britain, due to «the demand in San Francisco for the China trade» (GBPP, Abstract 1857, 69)Footnote 21 . On the other hand, in some years in the early 1820s reports by the British consul in Veracruz also accounted for some transfers of specie to Cuba, which probably had Spain as their final destination. In sum, even if we are able to rebuild the approximate total value of Mexico’s specie exports, its distribution by country will not be entirely accurate, as all of it will be accrued to the nations controlling that trade.
For reasons of space we can only give a brief description of the method followed to rebuild these flowsFootnote 22 . It includes diverse procedures, depending on the type of sources that were used for each phase within this period. From 1821 to 1824 data come from a British consular report that provides a statement of Mexico’s gold and silver exports «as far as the same can be made out by the returns in the possession of the Mexican Government, compared with those of the British Viceconsuls» (GBPRO, FO v. 50, r. 65, pp. 155-157). Between 1825 and 1853, we gathered all the information available from consular sources reporting specie exports attributed to Great Britain (because the information related to other destinations is available from each country’s official sources, as previously noted). These sources were not only of British origin, but also French and US consular reports stemming from specific ports (mainly Veracruz, Tampico, San Blas, Guaymas and Mazatlán), and, occasionally, complementary primary and secondary sourcesFootnote 23 .
Despite being more complete and accurate, our series of specie exports to GB is not free of weaknesses. The most important one lies in the fact that even consular reports underestimated specie exports. Treasure was sent in commercial vessels as well as in His Majesty’s ships and packets. By different means, some specie was smuggled in both, so that «the amount declared at the customhouse compared with what is actually shipped is inexact»Footnote 24 . In 1825, the British consul assessed the value of «clandestine exports» as one million dollars per year, but the amount is likely to have varied over timeFootnote 25 . On the other hand, there is a phase in which even this fragile set of sources is incomplete. Between 1842 and 1851, data from some consulates are missing, a lack that becomes more serious between 1847 and 1851, that is to say during the US-Mexican war and its aftermath. For these years, missing values for some ports had to be estimated following the amounts recorded in the neighbouring years, which makes the total a rather rough estimateFootnote 26 . Between 1854 and 1857, the value of Mexico’s specie exports to GB originating in the ports of the Pacific was taken from reports of the British consul in Panama which contain that precise information. The reason is twofold; first, that the opening of the isthmus to interoceanic traffic diverted most of the more valuable trade of the west coast that formerly used the longer route via Cape Horn; second, that the amounts provided by that source are consistently larger than those recorded by consuls at the Mexican Pacific ports.
Finally, to estimate specie exports to Great Britain for the period starting in 1858 we followed an entirely different procedure. As already mentioned, in this year British official records incorporated the annual value of gold and silver specie imports, but did not include Mexico as a separate entity. Instead, it was part of a group called «Mexico, South America, and West Indies, except Brazil» (MXSAWI). To separate Mexico’s specie exports to Great Britain from those stemming from the other countries conforming that group, we focussed on silver, in which Mexico’s contribution was clearly distinguishable. We used primary and secondary sources to obtain silver exports from the South American countries which, being silver producers and exporters, could be included in that group, namely Bolivia, Peru, Chile and Colombia (UK FC 1856-1871 1859; Soetbeer Reference Soetbeer1879; Restrepo Reference Restrepo1952; Rodríguez and McGreevey Reference Rodríguez and Mcgreevey1970; Hunt Reference Hunt2011). We then subtracted the share of those exports that went to France and the United States, according to the statistics from these countries (France several years; USA 1; USA 2). The outcome is an aggregate of silver exports to Great Britain from the four South American countries, which we subtracted from MXSAWI in British official recordsFootnote 27 . The result is a composite of silver exports to Great Britain stemming from Mexico + West Indies, which is the closest we can get with the information available to Mexico’s figure. In sum, for the period 1858-1870 our approach yields an upper bound estimate of Mexico silver exports to Great Britain. Finally, we must include gold in this estimation. As Mexico’s production of gold was rather modest at the time, we may assume without risking a serious bias that all of Mexico’s gold coinage was oriented to the external market. According to Mexican official figures, in the period 1858-1870 it amounted on average to 987,000 dollars per year (MF 1881, pp. 615-629). From the yearly value of gold coined in Mexico within this period, we deduct the value of gold coins imported from the United States, adding the remaining share to GB imports from Mexico. Even if this procedure does not provide an accurate outcome, it allows us to avoid the problem of Mexican contraband, which, according to several accounts, had aggravated as the scale of exports increased in the last decade of the period (Butterfield Reference Butterfield1861, pp. 61-62).
The last step was to add this series to those of the other partners that reported specie imports from Mexico, namely the United States, France and Germany, in order to arrive at an estimate of the total value of Mexico’s specie exports. As the sources used for the reconstruction of this series did not include any additional cost (of transportation, insurance or commissions), we assume that it consists of f.o.b. values. Figure 4 presents this series, comparing it with the only (partial) series of specie exports available from Mexican sources (Lerdo de Tejada Reference Lerdo De Tejada1967 [1853]) and with the yearly value of coinage according to Mexican official records. As may be noticed, our series is generally higher than those built from Mexican sources up to the early 1840s. During this decade, despite being based on incomplete data, our series provides values that are generally higher than those offered by Lerdo de Tejada (Reference Lerdo De Tejada1967 [1853]); however, it is considerably lower than coinage values. By contrast, the new export series shows a recovery starting in the 1850s that continues until the mid 1860s, while coinage remains fairly stagnant until the mid 1860s.
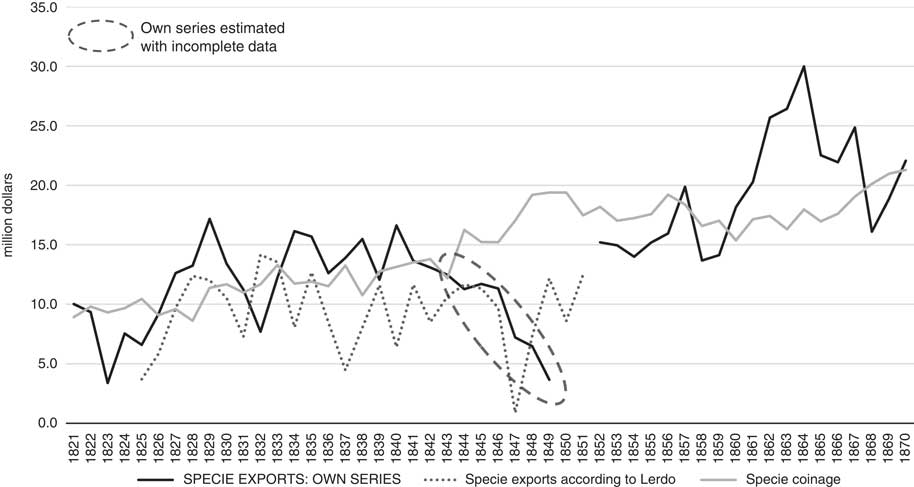
FIGURE 4 MEXICO’S SPECIE EXPORTS (F.O.B.) AND COINAGE, 1821-1870 (MILLIONS OF DOLLARS) Notes: own series was built with information taken from consular reports, United States trade statistics and complementary sources, as reported in the reference list. Lerdo’s series comes from Lerdo de Tejada (Reference Lerdo De Tejada1967 [1853], docs. 52, 53); coinage, from Ministerio de Fomento (1881, pp. 615-629). In all cases, specie includes gold and silver coins and ingots.
3.3 Mexico’s Total Exports
Figure 5 presents the complete picture of Mexico’s export trade. The figure shows the striking contrast between a small, slowly growing value of commodity exports and much larger specie transfers, for a pattern that characterised the entire period. Throughout these years, Mexico’s export basket was around 80 per cent in specie (silver), which presumably was used not only as a means of payment for imports, but also to pay debts or make deposits abroad. Even though, in the last 10 or 15 years of the period, merchandise exports increased somewhat, specie exports grew much faster, particularly from the end of the Mexican-American War to the mid 1860s.
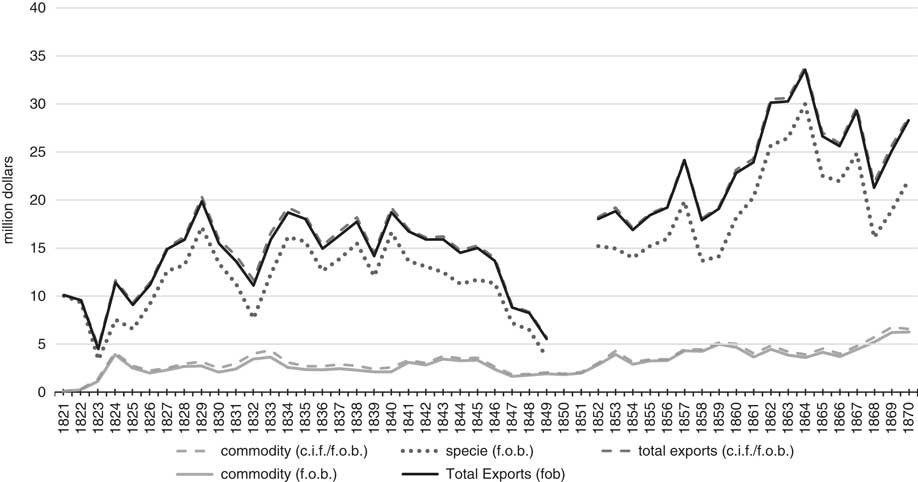
Apart from this difference between the two components of the export basket, it is worth noting the change of scale that took place starting in the 1850s: while total exports averaged 14 million dollars between 1824 and 1849, they reached 24 million on average in 1852-1870. Although the reasons behind this change require further research, this behaviour seems to challenge both conventional and revisionist views on Mexico’s economic performance in the decades after independence (Sánchez Santiró Reference Sánchez Santiró2010; Cárdenas Reference Cárdenas2015).
4. THE RECONSTRUCTION OF MEXICAN IMPORTS
4.1 Foreign Records of Mexican Imports
In Figure 6 we present the value of Mexico’s imports from 1821 to 1870 as provided by all the available records of foreign exports to Mexico.
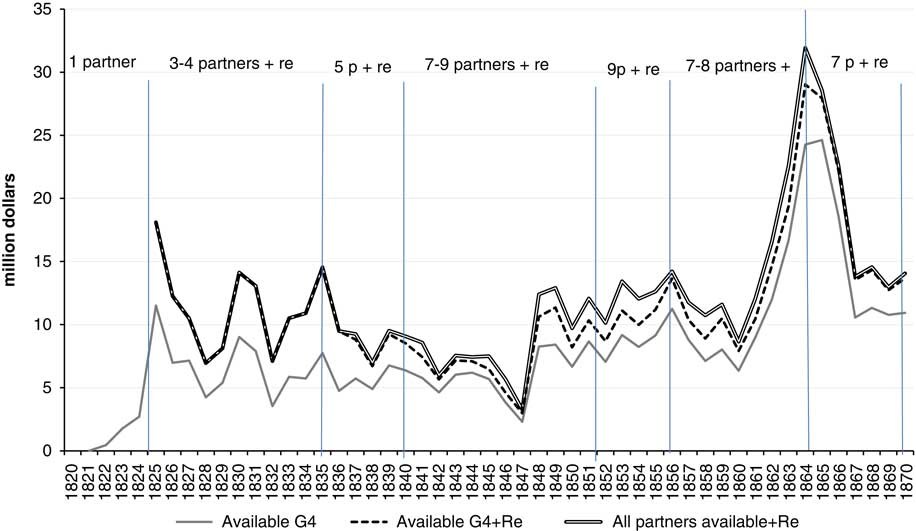
FIGURE 6 MEXICO’S IMPORTS (F.O.B.) VALUE, ALL PARTNERS AVAILABLE, G4, AND G4+RE-EXPORTS, 1820-1870 (MILLIONS OF DOLLARS) Note: G4=GB, FR, US, BE. GB: Great Britain; FR: France; US: United States; BE: Belgium. For method and sources, see text.
In contrast with the criteria used for the reconstruction of exports, for imports we include exports and foreign re-exports, at least for the US, France and GB, which were the largest exporters and re-exporters to Mexico from the Atlantic economy. US re-exports to Mexico were much higher than their own domestic exports to Mexico in most of the years (before 1835, between three and four times). From the late 1820s, an increasing quantity of British exports with Mexico as final destination were directed first to New York. During the early 1830s and until 1837 US re-exports exceeded total UK direct exports to Mexico. These re-exports decreased relative to the rest of Mexican imports during the period 1835-1847, offering a pronounced downturn for total Mexican imports that differs from a moderate stagnant series built with the G4 for the same period. As this downturn coincides with an upturn of exports from France and the GB, it is likely that what explains this change is the fact that from 1835 these two countries started carrying out a larger share of their trade with Mexico directly, while before that year they did so through the United States. In the early 1820s we have only GB records of trade to Mexico, while later, between 1825 and 1870, we have complete series of exports and foreign re-exports to Mexico also from France and the US, and only special exports from BelgiumFootnote 28 . The inclusion of other countries (All partners available+Re) in brief periods (such as Jamaica in 1835, Hamburg and Bremen and Venezuela in 1840, or some Italian states in 1852 or even the continuous bilateral trade records of Chile 1840-1868, Spain from 1849 to 1870 (with some British data for 1840), or Italy 1863-1870), as shown by the double line, does not offer a relevant difference from the general trend of the G4 plus re-exports. The only caveat that should be mentioned affects the years 1849-1859, when we have eight to nine partners, and levels are relatively higher than the G4 plus re-exports but with a similar fluctuation and trend. This, however, could reflect the change of scale that we observe also in exports beginning in the late 1840s.
Table 2 shows that the G4 (Great Britain, France, Belgium, United States) and its re-exports always provide more than 80 per cent of total Mexican partners’ records. Certainly, we have not been able to identify the geographical origin of these re-exports, but we do know that Mexico imported those goods supplied by merchants’ ships with flags from those countries. We also keep in mind that records are not available for the whole set of partners, and that there are gaps in the information on the number and volume of trade within our sample of countries. Having said this, we conclude that the trend illustrated by the broken line in Figure 6 (of the G4 plus re-exports) provides a reasonable representation of Mexican import trends and fluctuations for the period 1825-1870.
TABLE 2 SHARE OF MAIN PARTNERS IN MEXICO’S COMMODITY IMPORTS ESTIMATED FROM FOREIGN RECORDS, 1830-1870

Notes: As explained in the text, the shares and residual used for the estimation of total imports are different from those presented here. For sources and method, see text.
GB: Great Britain; FR: France; BE: Belgium; SP: Spain; DT: Germany; IT: Italy; US: United States.
4.2 Import (c.i.f.) Commodity Trade
For the reasons explained above, we have used a different strategy to estimate Mexican commodity imports (c.i.f.). On the one hand, we ignore the exact geographical origin of the US re-exports to Mexico because a relevant share of the British and French, but also other European and non-European goods, were probably re-exported to Mexico in US shipsFootnote 29 . On the other hand, British re-exports are, as mentioned, mainly silk manufactures from India, while French re-exports are of similar composition to domestic French exports, probably of British and other European origins. So, as in the case of exports, the question is how to assess the residual value of the countries from which Mexico imported outside the G4 plus re-exports. Unfortunately we have only a few clues to help us. On the one hand, the register of the number of vessels which arrived at and departed from Mexican ports from 1826 to 1828, and in 1850, offered by Lerdo de Tejada (Reference Lerdo De Tejada1967 [1853]). Lerdo attributed the geographical origin of that trade according to the national flag of the ship, so we can assume that exports and re-exports from United States, France and Great Britain arrived at the Mexican ports in their respective national ships. Unfortunately, for imports we have only two complete reliable estimations of the geographic distribution of Mexico’s imports that capture the share represented by the main countries (G4+re) in our sample, and the total level of imports that we need to estimate the residual. So we have decided to take the 1828 Lerdo attribution of 80.9 per cent for the main G4 countries and their respective re-exports (Great Britain, France, United States and Belgium) as a base year (Lerdo: 10.51 million dollars, base year for 1828). We assume that this percentage is estimated by Lerdo on a c.i.f. basis at the Mexican border. So we need to calculate a freight factor in order to convert this G4 exports plus re-exports, which are on a f.o.b. basis at the European border, to imports on a c.i.f. basis at the Mexican borderFootnote 30 . On the other hand, we have the estimation by Kuntz-Ficker (Reference Kuntz-Ficker2007) for the year 1870 of imports’ (c.i.f.) level and geographic distribution (Kuntz-Ficker: 19.56 million dollars, base year for 1870). This estimate offers a share of 78.8 per cent for the same group of countries that we use, which may serve to test the robustness of the first estimation and level.
In Figure 7 we use the respective fixed residual percentage of Lerdo’s 1828 and Kuntz-Ficker’s 1870 as a base year reference percentage. Then we apply our index «G4 plus re-export» on c.i.f. bases to both residual percentages. As each series follows the same index, they offer a similar profile but with different levels. First, a downward cyclical trend from 1828 until 1847, followed by a slightly more dynamic upward movement in the late 1840s and early 1850s, when Mexican imports barely overcame the level of 1830.
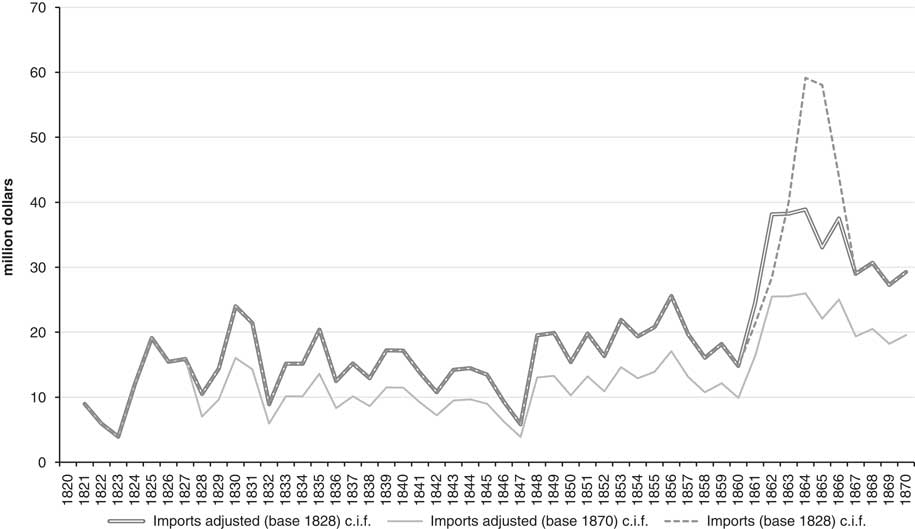
FIGURE 7 MEXICO’S TOTAL IMPORTS (C.I.F.), ACCORDING TO DIFFERENT CRITERIA, 1820-1870 (MILLIONS OF DOLLARS) Note: For sources and method, see text.
The second half of the 1850s shows a downward cyclical tendency followed by an outstanding import surge during the US civil war. The boom shown by the broken line («import base 1828») may be explained, on the one hand, by the rapid increase in the import price of cotton manufactures fostered by the war (prices of British cotton manufactures to Mexico between 1860 and 1864 went up by 48 per cent). On the other hand, because the Union blockade of the Confederate ports from 1862 to 1865 induced British and French exports to the US to be redirected to Mexican ports in transit or smuggled to Confederate States as a final destiny for consumption (British 1860-1864 exports increased their previous value almost fourfold). So, as we did for US export records (following Salvucci Reference Salvucci1991), we have adjusted Britain and FR to this transit and smuggling commerce that overvalues the Mexican imports in those yearsFootnote 31 . Our strategy of adjustment has been to select the most representative products with highest increases in their value in the British and French export records to Mexico between 1861 and 1865. For this sample of products we have assumed that Britain and France exported and re-exported the same quantities during the years 1861-1865 as in 1860 (1861 in the case of France), but at the actual price shown by the statisticsFootnote 32 . The results, as illustrated in Figure 7 by the «import adjusted» series, show how the price boom of cotton manufacture imports increased the value of Mexican imports significantly, but that adjusting this increase by quantity is moderated in a relevant way. We have, then, two different adjusted series based on the respective levels mentioned (for 1828 and 1870). As the first one leads to an overestimation of the import values in the second half of the period and the second one during the first half, we have adopted a compromise solution consisting of a geometrical average of both. This represents our best estimate for the reconstruction of Mexico’s c.i.f. import series, and is presented in Figure 8 and used in Figure 9 to estimate the balance of trade.
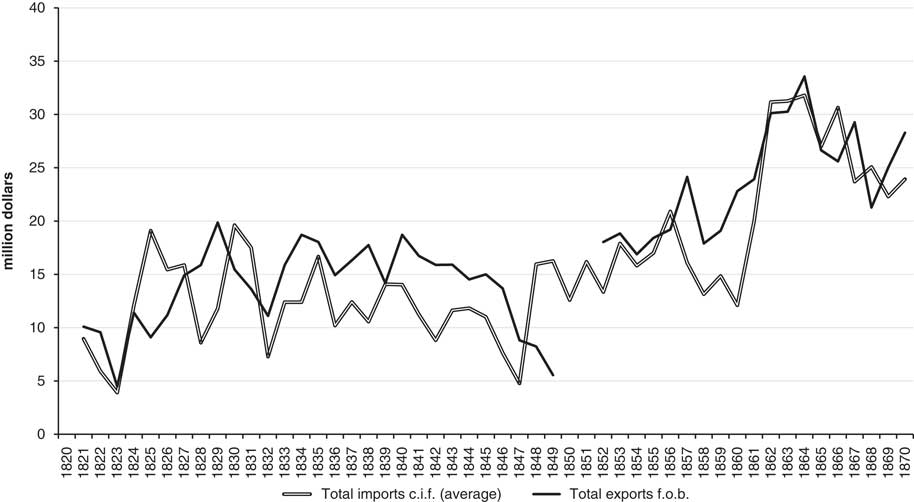
FIGURE 8 MEXICO’S TOTAL IMPORTS (C.I.F.) AND EXPORTS (F.O.B.) 1821-1870 (MILLIONS OF DOLLARS) Notes: total imports c.i.f. (average) represents a «compromise» of the two series presented in Figure 7 (base 1828 and 1870, adjusted), calculated as the geometric average of both. For sources and method, see text.
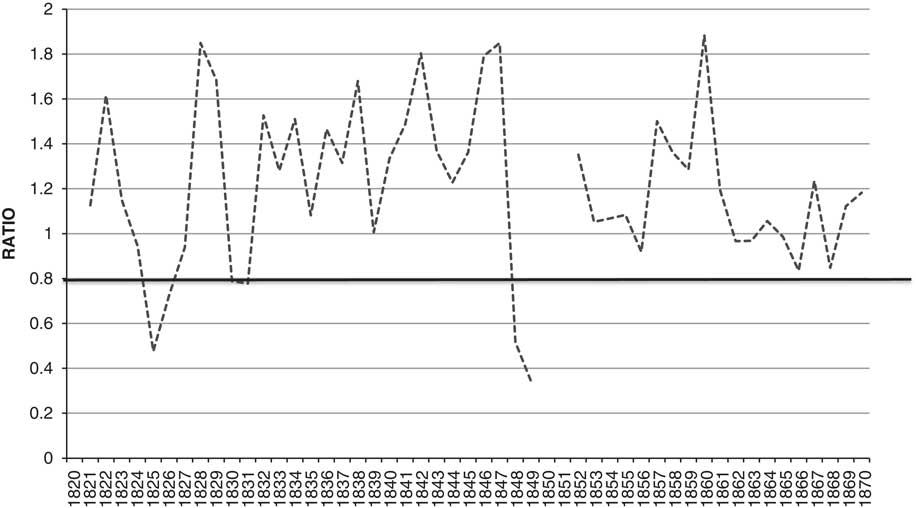
FIGURE 9 BALANCE OF TRADE (EXPORTS/IMPORTS) 1821-1870 Note: for sources and method, see text.
5. FINAL REMARKS AND THE BALANCE OF TRADE
This paper provides a reconstruction of the yearly values of Mexico’s foreign trade (imports and exports) between 1821 and 1870 based on foreign partners’ records and consular reports that were meticulously gathered and contrasted for all the years in which we have been able to find historical records. To the best of our knowledge, this procedure offers reasonably accurate series that begin to fill a serious gap in the quantitative information of Mexico’s economic history. Our new export and import series are still in current values and have not been deflated; consequently, it is too soon to advance a new interpretation of the long-term trend of Mexican trade dynamism during the so-called lost decades. In fact, it is likely that both series would show a different shape in constant prices. On the one hand, because until the 1850s import prices probably decreased while the price of silver was more stable. On the other hand, because during most of the 1860s we can assume higher inflation for imports than for exports. Figure 8 presents both dimensions of Mexico’s foreign trade in current values, considering exports f.o.b. and imports c.i.f., as required for the purpose of estimating the balance of trade. The series are presented in the Appendix.
Although not deflated, both series follow similar trends and have similar fluctuations through most of the period, even though they have different features and levels. In current prices, we observe a differentiated performance of trade in two periods during the half-century that followed Mexican independence. The first period goes from the early 1820s to the US invasion of Mexico in 1846 and shows clear stagnation in both seriesFootnote 33 . By contrast, the second period, which starts from 1847 and concludes in the mid 1860s, presents a more dynamic profile. Even though the second half of the 1860s exhibits a downward trend, it took place at a higher level — relative to the one that prevailed in the first stage.
Finally, the series of imports and exports in current values are useful for the purpose of estimating the balance of trade, which is presented in Figure 9.
Before commenting on its overall features, a word should be said about the role of specie exports in this field. As previously explained, all specie has been considered as non-monetary, thus belonging to the current account. This would include all the (gold and silver) specie used by private holders to purchase imports. However, it is likely that part of the transfers of specie were of a capital nature, such as when they served to establish credit or pay private debts abroad (short-term capital) or for the purposes of investing in foreign countries (long-term capital). As it is impossible, in the current state of our knowledge of the Mexican economy and international position, to distinguish one from the other, we will here consider all specie movements as part of the trade accounts. This means, however, that the explanation of some of the trade deficits or surpluses observed may lie outside the realm of foreign trade, and certainly beyond the scope of this paper.
As for the balance of trade presented in Figure 9, it shows that, even though Mexican trade was stagnant in the first part of the period (between 1824 and 1847), it showed a rather significant surplus during those years, with exports overcoming import values by an average of 30 per cent. On the contrary, in the more dynamic second part of the period (1848-1870), with the exception of the remarkable surplus peak in 1857-1861, Mexican trade was more balanced in relative terms. In any event, it remains to be assessed whether the surplus is a fiction created by an underestimation of imports (which could be the case particularly when a heavily protectionist tariff was enacted, as in 1828) or an actual phenomenon associated with capital exports and other remittances abroad. This seems to have caused the huge surplus recorded amid the so-called Reform war (the war between liberals and conservatives, 1858-1860). In any case, our preliminary results offer an encouraging perspective for further research.
APPENDIX
TABLE A1 VALUE SERIES OF MEXICO’S FOREIGN TRADE, 1821-1870, ACCORDING TO PARTNER'S RECORDS (MILLIONS OF DOLLARS, CURRENT PRICES)