

Introduction
Shooting and hunting have been favoured pursuits of the privileged in British society for centuries and the history of these sports intertwines with the wider history of agriculture and the rural landscape: almost half the agricultural land in England and Wales was preserved for shooting during the nineteenth century, although much was also farmed.Footnote 1 The game laws of England and Wales enacted between 1773 and 1831, with later modifications, underpinned the development of the modern shooting estate, which reached its pinnacle in the late Victorian and Edwardian periods.Footnote 2 Gamebird shooting became highly fashionable among the landed elite and patronage – particularly royal patronage – and was important to the growth of the shooting estate, with the shooting party important for developing and cementing social and political ties.Footnote 3 Although fashion was key to the popularisation of shooting, other factors were important in determining where the elite went to shoot, as the large numbers of gamebirds needed for a top-quality shoot could only be provided if the soil and climate were suitable – upland heather-covered moors for grouse and ploughland and grain crops for partridge and pheasant.Footnote 4 Rabbits and hares required open land on sandy soils, but were increasingly seen as vermin, with gamebirds the primary target.Footnote 5 In East Anglia, poor, sandy soils were converted to lucrative shooting estates as agriculture became economically unviable during the later nineteenth century, while the heather-dominated northern moors were agriculturally suitable only for sheep.Footnote 6 If soil and climate were suitable, the landscape could be modified to provide food, clear lines of sight and cover for birds.Footnote 7 Ease of access was also a factor, with the major pheasant areas in East Anglia just a few hours by train from London while grouse-trains were laid on to take sportsmen to the moors.Footnote 8 Pressure to increase bags drove changes in bird-rearing techniques – such as semi-captive rearing of pheasant and partridge – and new shooting practices – such as the introduction of beating and battues.Footnote 9 The development of modern breech-loading shotguns was also key.Footnote 10 Crucial to any successful shooting estate were the gamekeepers who reared the birds, protected them from vermin, detected and deterred poachers, managed the landscape, and organised the shoots.Footnote 11
The evolution of the game laws, the role of the elite in the development of shooting estates, and the incidence of poaching and motives of the poacher, have all been examined,Footnote 12 but the gamekeeper has been a peripheral character in these analyses, often portrayed as the bad guy, fighting hard done by poachers.Footnote 13 Generally, gamekeepers have been central in practical manuals and autobiographies, but featured only in passing in studies of rural society, although P. B. Munsche examined their role in the eighteenth century and Stephen Ridgwell considered their roles and representations in the late Victorian and Edwardian periods.Footnote 14 Apart from the works of Harvey Osborne and Michael Winstanley, who considered gamekeeper numbers when examining rural and urban poaching in Victorian England, there has been no systematic examination of the numbers and locations of gamekeepers.Footnote 15 Where gamekeeper numbers have been given, national data were often used, with the unstated assumption that these reflected local trends, although some authors have commented on the high number of gamekeepers in southern and eastern counties, where game preservation was common, and the low numbers in midland counties where fox hunting dominated.Footnote 16 Using census returns for England and Wales, plus selected English counties, this work examines gamekeeper numbers from 1851 until 1921, and then explores changes in gamekeeper numbers in relation to population changes, landowner numbers, estate area and poaching prosecutions.
Working with census data
From 1851 on, ‘Gamekeeper’ was a specified census occupation and numbers were extracted from the published statistical reports for 1851–1921 (few women gamekeepers were recorded, so the analyses include only men).Footnote 17 The census reports provided the population for England and Wales and for each county, in total and excluding the boroughs and cities (termed the administrative country from 1891). The latter numbers were used here and defined as the ‘rural’ population. By excluding cities and boroughs, it was possible to examine changes in gamekeeper numbers as a proportion of the population in the areas where they worked and mitigate the effect of growth in urban populations. Comparison of gamekeeper numbers in administrative and entire counties for 1921, the only year they were provided, showed that, generally, more than 97 per cent of the gamekeepers were located outside cities and boroughs.
As with any dataset, there are issues of data quality and reliability. In the census, gamekeeper included gamekeeper, deer park keeper, warrener, and keeper of the fox cover. The individual contributions of each role could not be determined, although most were probably gamekeepers, followed by warreners, with other occupations less common. Inaccuracies in data collection and recording, from mistakes at the data collection stage to analysis or printing errors, have also been reported.Footnote 18 Other issues included the listing of those with more than one occupation under their first-stated occupation only, the inclusion of visiting, retired or unemployed gamekeepers, and de facto gamekeepers who did not have a job title that reflected this role.Footnote 19 Despite these issues, the counts of those employed in game preservation were obtained using repeatable and standardised methods.
National trends in gamekeeper numbers
In 1851, there were 7,542 gamekeepers in England and Wales, representing 0.14 per cent of the rural male population (Table 1). Their numbers increased by almost 5,000 (65 per cent) by 1871, stabilised from 1871 until 1881, and then rose by another 4,000 (33 per cent) to 16,677 in the two decades to 1901. Numbers peaked in 1911 at 17,148, an increase of just three per cent over 1901. From 1861 to 1881, around 0.2 per cent of the rural male population were gamekeepers, after which the proportion declined, presumably due to the effect of population increases as gamekeepers actually increased in number (Table 1). The number and proportion of gamekeepers dropped by about half from 1911 to 1921, to 9,367 and 0.08 per cent.
Table 1. Rural male population number and per cent of gamekeepers in England and Wales and selected counties (1851–1921)

Sources: 1851: Her Majesty’s Stationery Office, Census of Great Britain, Population Tables, II: Ages, Civil Conditions, Occupations and Birth-place of the People with the Numbers and Ages of the Blind, the Deaf-and-dumb, and the Inmates of Workhouses, Prisons, Lunatic Asylums, and Hospitals, Vol. I. (London, 1854), pp. cc–cciii, ccxxiii, 83, 275, 281, 357, 445, 631, 763.1861: Her Majesty’s Stationery Office, Census of England and Wales, Population Tables, Numbers and Distribution of the People of England and Wales, Vol. II (London, 1862), pp. xix–xx, xxxiv, 99, 281, 288, 369, 460, 628, 764.1871: Her Majesty’s Stationery Office, Census of England and Wales, Population Tables, Areas, Houses and Inhabitants, Vol. I (London, 1873), pp. xii–xvii; Her Majesty’s Stationery Office, Census of England and Wales Population Abstracts, Ages, Civil Condition, Occupations, and Birth-places of the People, Vol. III (London, 1873), pp. xxxix, 79, 191, 197, 250, 306, 422, 516.1881: Her Majesty’s Stationery Office, Census of England and Wales, Population Tables, Areas, Houses and Inhabitants, Vol. I (London, 1883), pp. vii–viii; Her Majesty’s Stationery Office, Census of England and Wales, Ages, Condition as to Marriage, Occupations, and Birth-places of the People, Vol. III (London, 1883), pp. xix, 66, 142, 192, 241, 341, 440.1891: Her Majesty’s Stationery Office, Census of England and Wales, Area, Houses and Population, Vol. I. (London, 1893), p. vi; Her Majesty’s Stationery Office, Census of England and Wales, Return of Number of Males and Females in England and Wales at Censuses 1871, 1881, and 1891 under Occupational Headings (London, 1895), p, 10; Her Majesty’s Stationery Office, Census of England and Wales, Ages, Condition as to Marriage, Occupations, Birth-places and Infirmities, Vol. III (London, 1893), pp. 58, 150, 197, 242, 346, 466.1901: His Majesty’s Stationery Office, Census of England and Wales, Summary Tables, Area, Houses and Population; Also Population Classified by Ages, Condition as to Marriage, Occupations, Birthplaces and Infirmities (London, 1903), pp. 42–3; His Majesty’s Stationery Office, 1901 Census of England and Wales, County of Berks (London, 1903), p. 43; His Majesty’s Stationery Office, 1901 Census of England and Wales, County of Devon (London, 1903), p. 11; His Majesty’s Stationery Office, 1901 Census of England and Wales, County of Gloucester (London, 1903), p.11; His Majesty’s Stationery Office, 1901 Census of England and Wales, County of Lancaster (London, 1903), p. 15; His Majesty’s Stationery Office, 1901 Census of England and Wales, County of Norfolk (London, 1903), p. 12; His Majesty’s Stationery Office, 1901 Census of England and Wales, County of Northumberland (London, 1903), p. 6; His Majesty’s Stationery Office, 1901 Census of England and Wales, County of Suffolk (London, 1903), p. 11.1911: His Majesty’s Stationery Office, Census of England and Wales, Summary Tables, Areas, Families or Separate Occupiers and Population (London, 1915), pp. 6–8; His Majesty’s Stationery Office, Census of England and Wales, Occupations and Industries Vol. X, Part 2 (London, 1913), pp. 2, 26, 86, 161, 257, 419, 440, 539, 548.1921: His Majesty’s Stationery Office, 1921 Census of England and Wales, County of Berks (London, 1923), p. 38; His Majesty’s Stationery Office, 1921 Census of England and Wales, County of Devon (London, 1923), p. 66; His Majesty’s Stationery Office, 1921 Census of England and Wales, County of Gloucester (London, 1923), p. 52; His Majesty’s Stationery Office, 1921 Census of England and Wales, County of Lancaster (London, 1923), p. 168; His Majesty’s Stationery Office, 1921 Census of England and Wales, County of Norfolk (London, 1923), p. 56; His Majesty’s Stationery Office, 1921 Census of England and Wales, County of Northumberland (London, 1923), p. 54; His Majesty’s Stationery Office, 1921 Census of England and Wales, County of Suffolk (London, 1923), pp. 58–9; His Majesty’s Stationery Office, 1921 Census of England and Wales, Occupations Tables (London, 1924), p. 34; His Majesty’s Stationery Office, 1921 Census of England and Wales, General Tables comprising: Population, Housing, Institutions, Ages and Marital Conditions, Education, Birthplace and Nationality, Welsh Language (London, 1925), pp. 6–8.
The period 1851–1911 coincided with the development of modern shooting estates and the restructuring and commercialisation of the sport. The increasing interest in game shooting can be seen from the number of game licences – the data include licences to employ a gamekeeper as well as to shoot game – issued for England and Wales from 1871 until 1921, which rose from 55,536 in 1871, to 62,501 in 1901, before declining in 1911 (54,079) and rising again in 1921 (64,064).Footnote 20 Far more game licences were issued than there were gamekeepers (Table 1), indicating that many landowners shot game on their land without employing a gamekeeper.
The Edwardian period (1901–10) was the pinnacle of large-scale game shooting, with the gun-loving Edward VII as figurehead, although gamekeeper numbers nationally increased only slightly during his reign (Table 1).Footnote 21 Large numbers of gamekeepers joined the forces in the First World War and both shooting and bird rearing declined.Footnote 22 Many gamekeepers were killed – David S. D. Jones identified nine gamekeepers from the royal Sandringham estate who died – as were significant numbers of landowners or their heirs – Walford estimated almost one thousand while others suggested about one in five of those who served.Footnote 23 Although few estates were left without heirs, economic factors, including increased income tax and death duties, alongside agricultural decline, resulted in the sale of estates and the decline of the shooting party.Footnote 24 John Martin suggested that after 1918, shooting grew in popularity among industrialists and tycoons but, of every one hundred shoots prior to 1914, barely five remained by 1939.Footnote 25 The advent of mechanisation, better transport and decreased reliance on estate-reared birds also reduced the need for gamekeepers and numbers never recovered to the 1911 levels.Footnote 26
Gamekeeper numbers in selected counties
Although national trends in gamekeeper numbers have been discussed by multiple authors, there has been little detailed examination of the changes at county level.Footnote 27 The seven English counties considered represent regions where different birds formed the primary quarry, and which developed shooting to different extents. The northern counties of Lancashire and Northumberland both had extensive moorland areas where grouse dominated but differed in their proximity to large urban areas. Norfolk and Suffolk, both renowned shooting counties, shared social, environmental, and economic factors. Berkshire, the smallest county and the closest to London, also had royal patronage and was environmentally similar to Norfolk and Suffolk. Finally, the western counties of Devon and Gloucestershire had extensive areas suitable for gamebirds but failed to develop into major shooting counties. Previous work on Devon, Lancashire, Norfolk, and Suffolk focused primarily on poaching, but Berkshire, Gloucestershire and Northumberland have received little attention.Footnote 28
Gamekeeper numbers, extracted from the censuses from 1851–1921, showed great variation both between counties and over time (Table 1). Lancashire had the most gamekeepers of the studied counties in 1851, and remained second highest until 1891, while Norfolk had most gamekeepers from 1861 until 1921 (Table 1).Footnote 29 Gamekeeper numbers in Suffolk, another prominent shooting county, grew significantly but only exceeded those of Lancashire in 1891 and always remained behind Norfolk. Gamekeeper numbers in Lancashire declined after 1871, while those in other counties continued to increase (Table 1), so that by 1911 only Gloucestershire had fewer gamekeepers (365 against 328).
As gamekeeper numbers varied greatly both between and within counties, to provide a standardised view, the value for 1851 was set to 100 per cent and the number in each subsequent census calculated as a percentage of this (Figure 1). In England and Wales, the number of gamekeepers reached 225 per cent of the 1851 level in 1901 and 1911, before declining sharply by 1921. Several of the seven counties broadly followed the trend of England and Wales but they differed in the amount of growth and decline. Suffolk, Norfolk and Northumberland (excluding the 1891 number), like England and Wales, peaked in 1911 but with greater growth (Figure 1). (The anomaly in the Northumberland data suggested an error in the published number for gamekeepers. Printing errors are not unknown: in 1911, for example, gamekeepers were omitted entirely from the list of occupations in Leicestershire.)Footnote 30 Norfolk and Suffolk showed the greatest numerical increase in gamekeepers but not the highest percentage increase. This occurred in Devon, which had fewest gamekeepers in 1851 but increased to 446 per cent of the 1851 level by 1901, before a sharp decline (Figure 1). In Gloucestershire, peak numbers occurred in 1901 rather than 1911, but the growth trend was similar to, although lower than, that of England and Wales at all dates. Numbers in Berkshire fluctuated more than the other counties but peaked in 1911 (Figure 1). Lancashire followed Gloucestershire until 1881, but then diverged significantly from this and the other counties so that, by 1921, there were half as many gamekeepers as in 1851, the lowest proportion of the counties (Figure 1). In general, gamekeeper numbers showed fastest growth between 1881 and 1901 and a large drop between 1911 and 1921. With the exception of Lancashire, peak gamekeeper numbers occurred in 1901 or 1911, although the magnitude and timing of the growth and decline differed between counties.
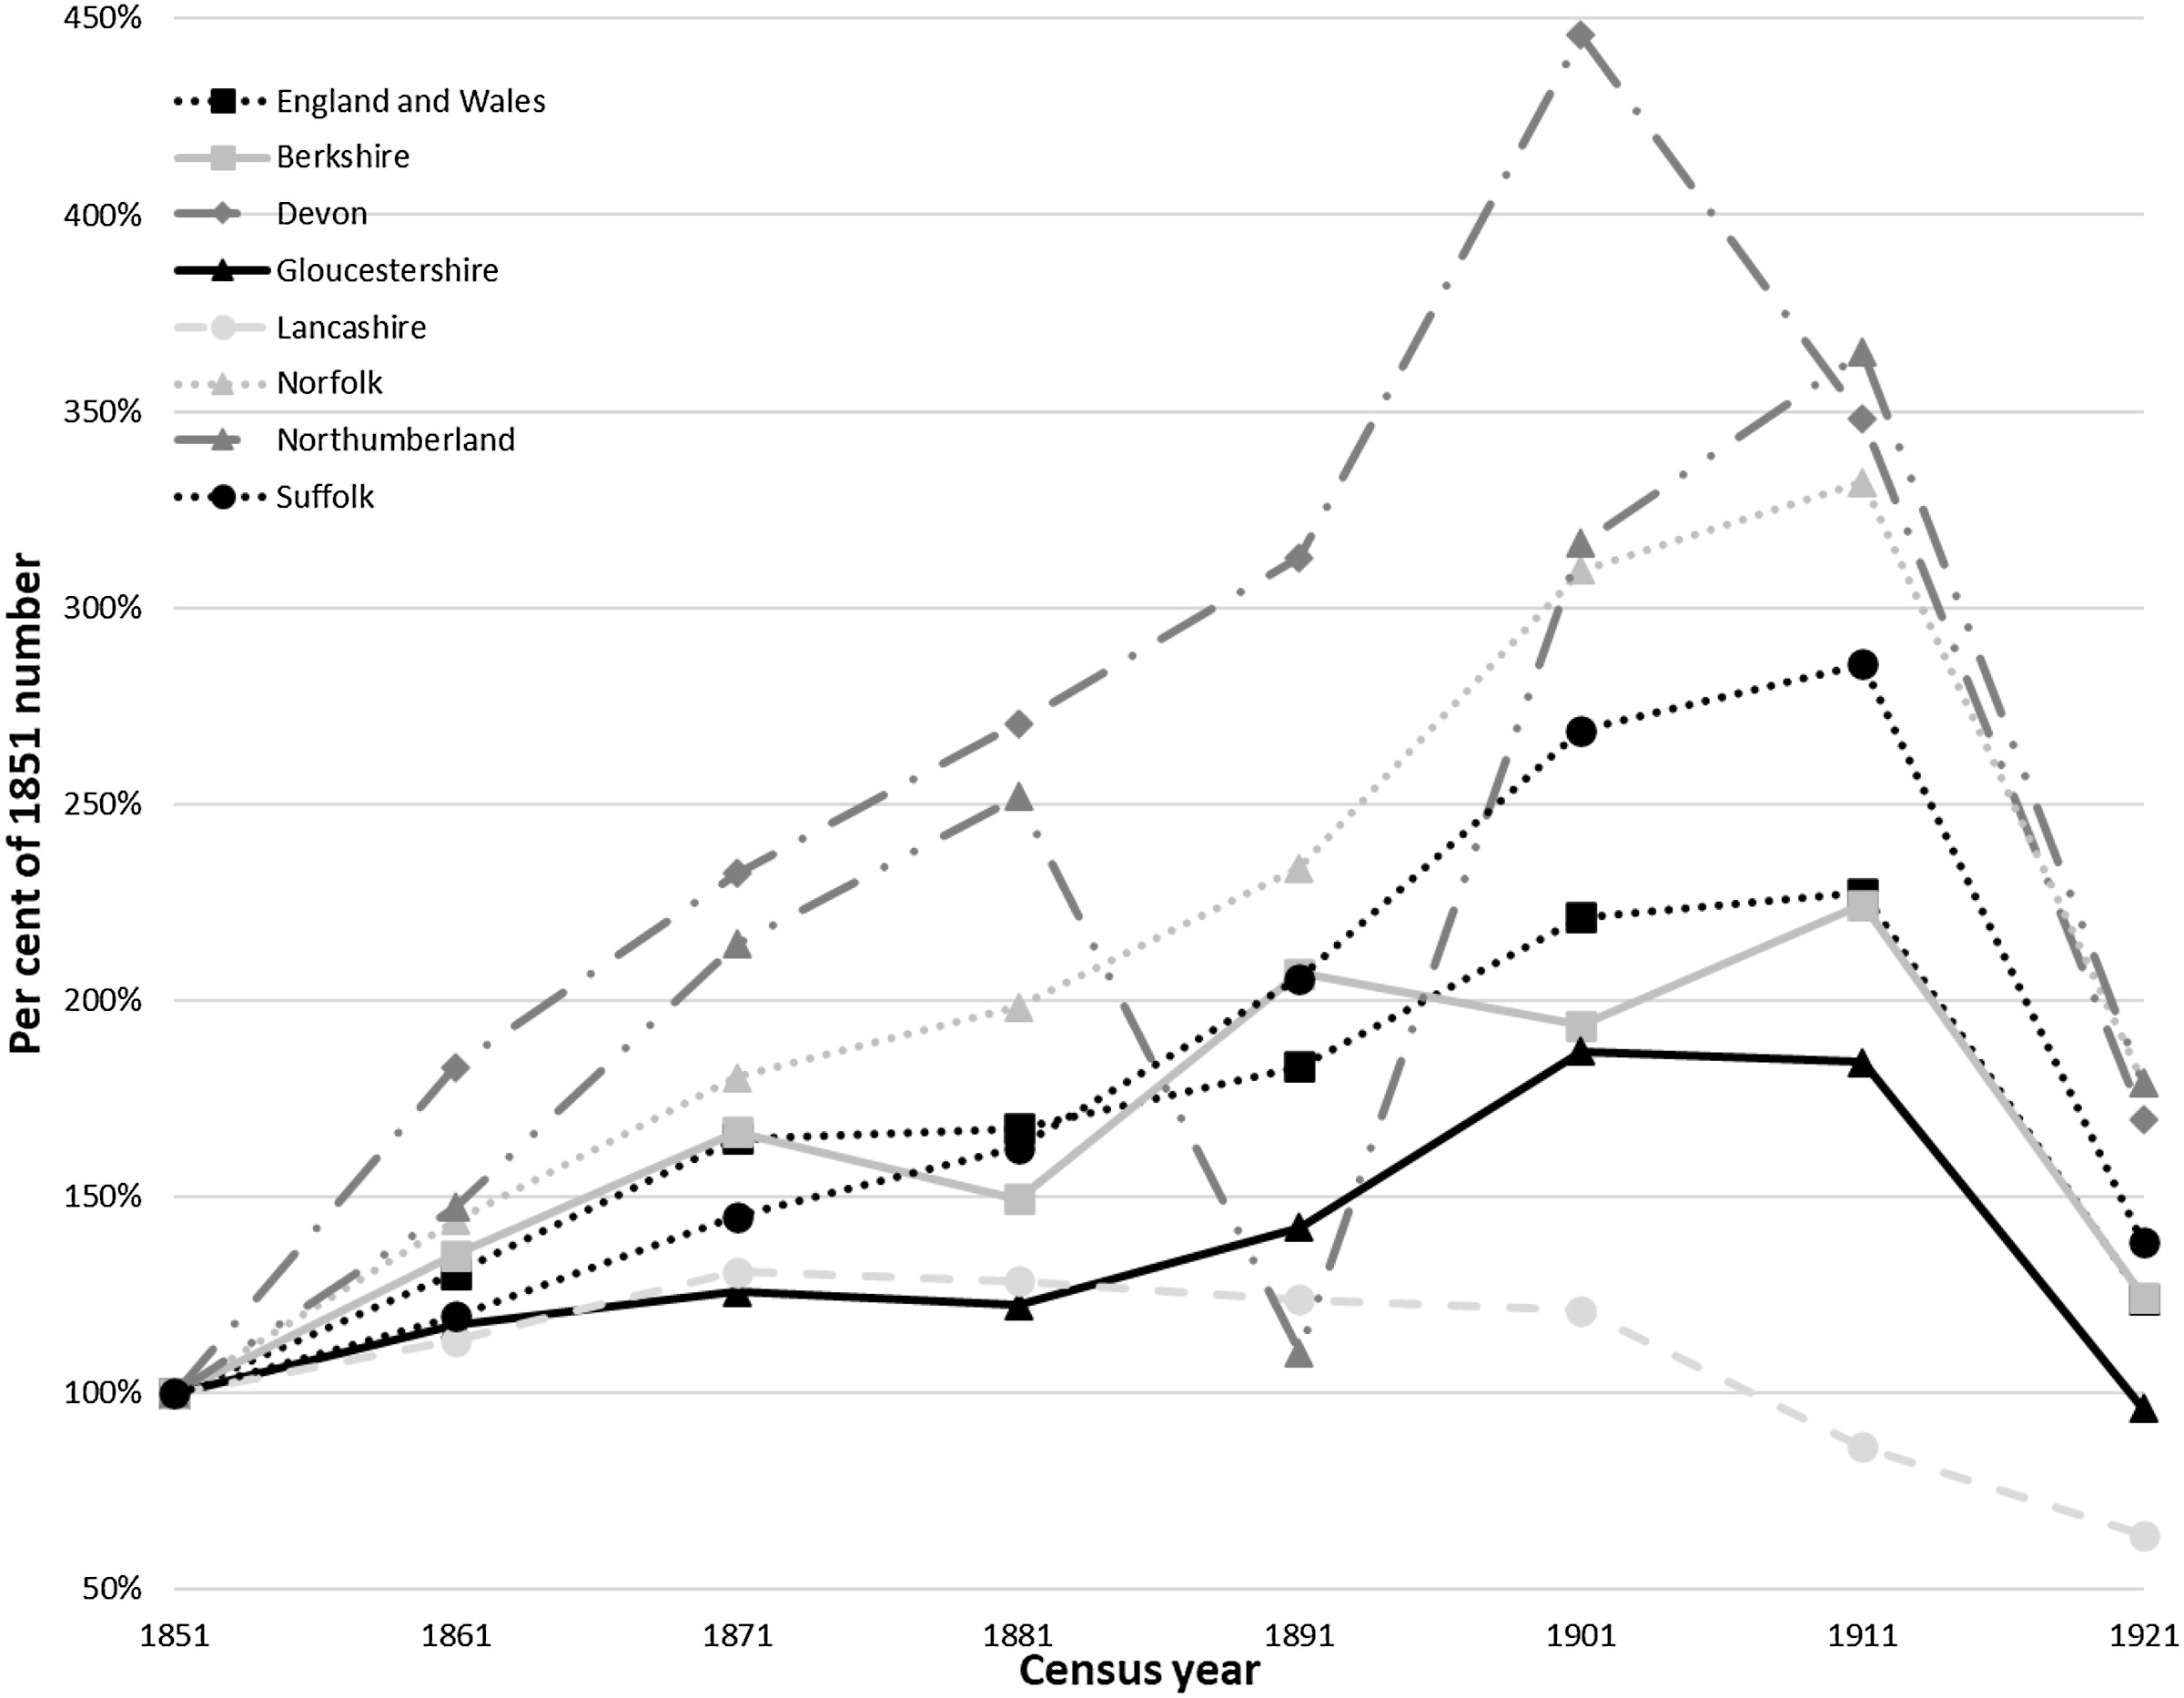
Figure 1. Numbers of gamekeepers as a percentage of the 1851 number for selected counties and nationally (1851–1921).
Previous analyses of gamekeeper numbers concluded that numbers stagnated in the north as industrialisation grew, while increasing in the south and east.Footnote 31 The data presented here support this suggestion as East Anglia and Berkshire – representing the south and east – showed increases in gamekeeper numbers until 1911, while numbers in Lancashire, representing the industrial north, plateaued as industrialisation increased. Northumberland, which was less industrialised than Lancashire, demonstrated the second highest proportional increase in gamekeeper numbers, suggesting that industrialisation was more important than northern location in driving any stagnation. The dramatic declines in gamekeeper numbers recorded between 1911 and 1921 were at least partly due to the impact of the First World War, but, in some counties, numbers started to decline earlier suggesting that the war was not the only factor.Footnote 32
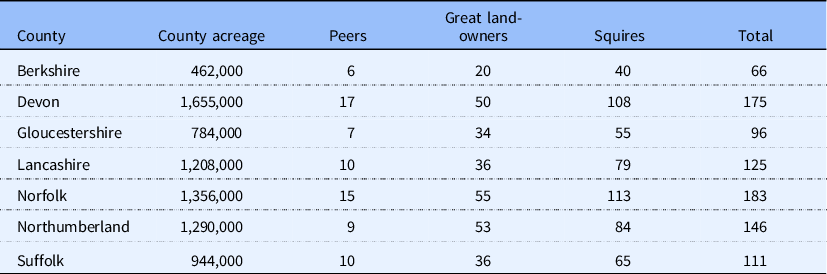
It was possible that differences in growth and decline of gamekeeper numbers between the counties passively reflected changes in the rural male population. If so, the proportion of gamekeepers at each census should show little variation, but the analyses showed significant differences between the counties, although some common trends were visible (Figure 2). In England and Wales, the proportion of gamekeepers was around 0.2 per cent of the rural male population 1861–81, and then declined steadily (Table 1; Figure 2). Devon and Gloucestershire tracked England and Wales until 1881 (Figure 2) but then diverged. The proportion in Devon more than tripled by 1901, while Gloucestershire plateaued at around 0.2 per cent from 1861–1911. These trends did not correlate with rural population changes. In Devon, increased proportion of gamekeepers came at a time of minimal population growth unlike in Gloucestershire where the population grew until 1891 before declining (Table 1). The proportion of gamekeepers in the rural populations of Berkshire, Norfolk and Suffolk was significantly higher than in England and Wales at all dates (Figure 2). Norfolk and Suffolk peaked in 1911, while Berkshire showed steady growth until 1871, followed by fluctuation around 0.45 per cent until 1911. In Norfolk and Suffolk, these increases came when the rural male population was static, while in Berkshire the population grew by about one third while the proportion of gamekeepers fluctuated (Table 1).
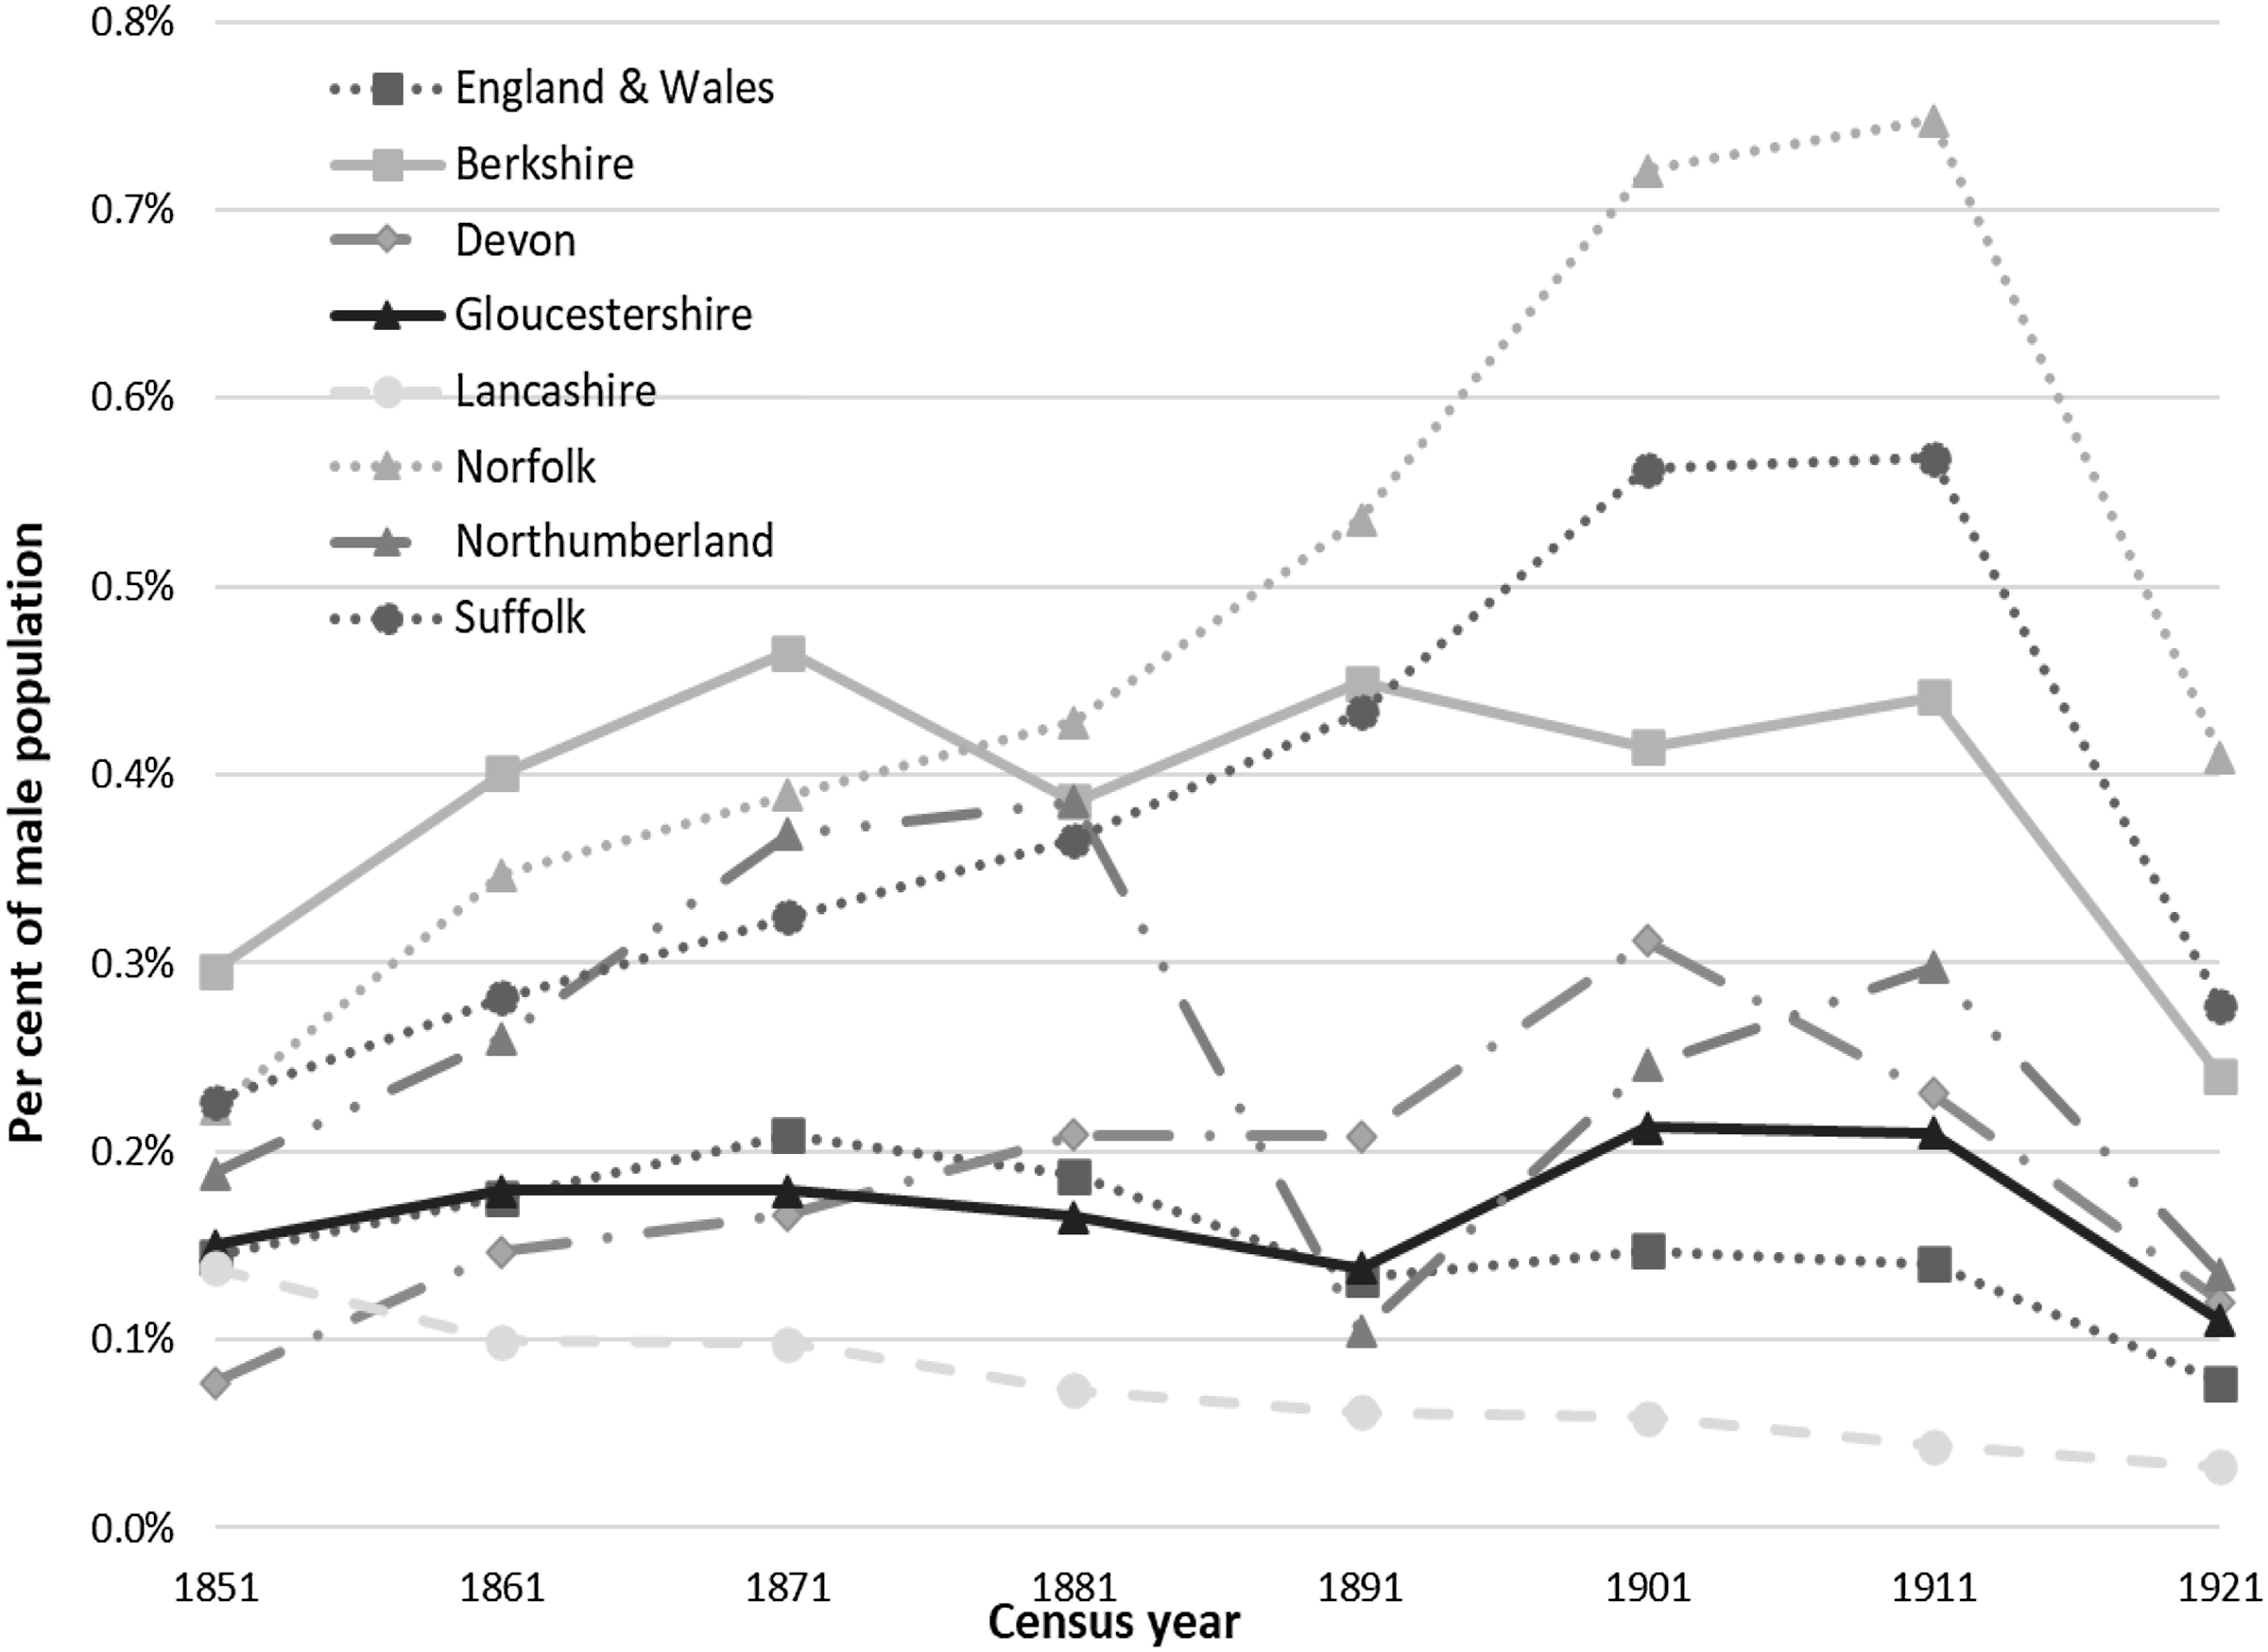
Figure 2. Gamekeepers as a percentage of the rural male population for selected counties and England and Wales (1851–1921).
Despite Lancashire having one of the highest numbers of gamekeepers at most dates, the county had the lowest proportion in the rural male population after 1861, with levels at or below 0.1 per cent (Figure 2). Here, the population (Table 1) more than doubled between 1851 and 1881 but was relatively stable from 1891 until 1921, the period of sharpest decline in the proportion of gamekeepers. The proportion of gamekeepers in Northumberland showed similar trends to Norfolk, Suffolk, and Berkshire until 1881 (Figure 2), but from 1901 (excluding 1891), Northumberland grouped with Devon and Gloucestershire. In Northumberland, the proportion of gamekeepers doubled between 1851 and 1881, at a period when the population was relatively stable but as the population increased from 1891, the proportion of gamekeepers declined, even though the number increased (Figure 2; Table 1). Although some counties had periods when the proportion of gamekeepers in the male population was stable, elsewhere the number of gamekeepers changed in the absence of population changes or grew despite population declines. There was, thus, no consistent link between gamekeeper numbers and the rural male population, including the general decline in the number of agricultural labourers in the late nineteenth century.Footnote 33
Estate sizes and gamekeeper numbers
Analysis of the census data highlighted differences between the counties in gamekeeper numbers and the timing and extent of growth. Patronage, ease of access and environmental suitability have all been suggested to influence gamekeeper numbers but there has been no consideration of any effect of county area, landowner number and estate area, or the number of gamekeepers per estate.Footnote 34 In 1883, John Bateman grouped the landowners in each English county into eight categories and listed the number in each category and the acres they owned, providing a source for the number of landowners and estate area. The numbers for Bateman’s first three groups have been used as being most likely to employ gamekeepers, as an estate of more than 1,000 acres has been used to distinguish gentry estates from those owned by men of lesser status:Footnote 35
-
1. Peers including Peeresses and Peers eldest sons;
-
2. Great Landowners including all estates held by commoners owning at least 3,000 acres, if the rental reaches £3,000 per annum;
-
3. Squires including estates of between 1,000 and 3,000 acres, and such estates as would be included in the previous class if their rental reached £3,000.
Bateman’s data was not without its issues, although it provided a snapshot of land ownership during the period of this study. Estates changed ownership on marriage, sale, or death but, although this process accelerated significantly after 1918, the number and size of estates remained broadly unchanged for much of the nineteenth century.Footnote 36 Also, Bateman assigned Peers and Great Landowners to one county, even if they owned land in more than one, resulting in some inaccuracy in numbers. Finally, not all of the estate area would have been agricultural or sporting land, some would have been industrial or urban, with most estates having a mix of land uses.
The data indicated that large counties generally had more landowners than smaller ones, but there were significant differences in the number of landowners in counties of similar area (Table 2): for example, Lancashire was 90 per cent of the area of Norfolk but had only 68 per cent as many landowners. In all counties, around 10 per cent of the landowners were peers and two-thirds were squires (Table 2). The proportion of a county owned by these landowners was generally about 50 per cent (Table 3), although Lancashire was slightly lower and Northumberland much higher. As a result, Northumberland, third largest county by area, had 200,000 acres more owned by major landowners than the largest county, Devon. Dividing acres held by the number of landowners provided an estimate of average estate area (Table 3). Berkshire, Devon, Gloucestershire, and Lancashire had the smallest average areas, about 4,000 acres. In Lancashire and Devon, this resulted from a low proportion of land owned by Bateman’s three groups and a high number of landowners (Table 3), while in Berkshire and Gloucestershire had fewer landowners but were smallest by area. Norfolk and Northumberland, both large counties, had an average estate area of over 10,000 acres. In Northumberland, 146 landowners owned 75 per cent of the county while, in Norfolk, half was owned by 183 landowners. Suffolk, a mid-sized county, had intermediate average estate area and number of landowners (Table 3).
Table 2. Number of major landowners per county using Bateman’s categories
Source: Bateman, The Great Landowners, pp. 501–09.
Table 3. County area, holdings of major landowners and average estate area
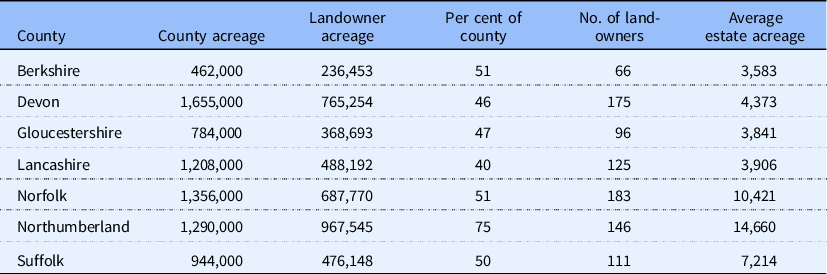
Source: Bateman, The Great Landowners, pp. 501–09.
Having established an average estate area per county, gamekeeper density (i.e., the average number of gamekeepers per estate) was calculated by dividing the number of gamekeepers (Table 1) by the number of landowners (Table 2).Footnote 37 Based on the number of gamekeepers per estate in 1851, and the timing and extent of growth and decline, the counties fell into three groups (Figure 3). The first group (Berkshire, Norfolk, and Suffolk) had two to three gamekeepers per estate in 1851 and demonstrated steady growth until 1881, followed by a rapid increase until 1901, stabilisation from 1901 until 1911, and decline to 1921 (Figure 3). In Berkshire, shooting estates (and presumably gamekeepers) were concentrated around Windsor and Bracknell, plus west of Reading in the Kennet valley, as estates elsewhere were generally too small to support significant numbers of pheasant or partridge.Footnote 38 Suffolk consistently had more gamekeepers per estate than Norfolk, up to eight in 1911, despite the average estate being 30 per cent smaller. The high density of gamekeepers on estates in East Anglia was not unexpected as many of the best pheasant estates in England lay on the Norfolk-Suffolk border, and significant income could be earned by turning sheep pasture into shooting, as long as estates were adequately preserved.Footnote 39
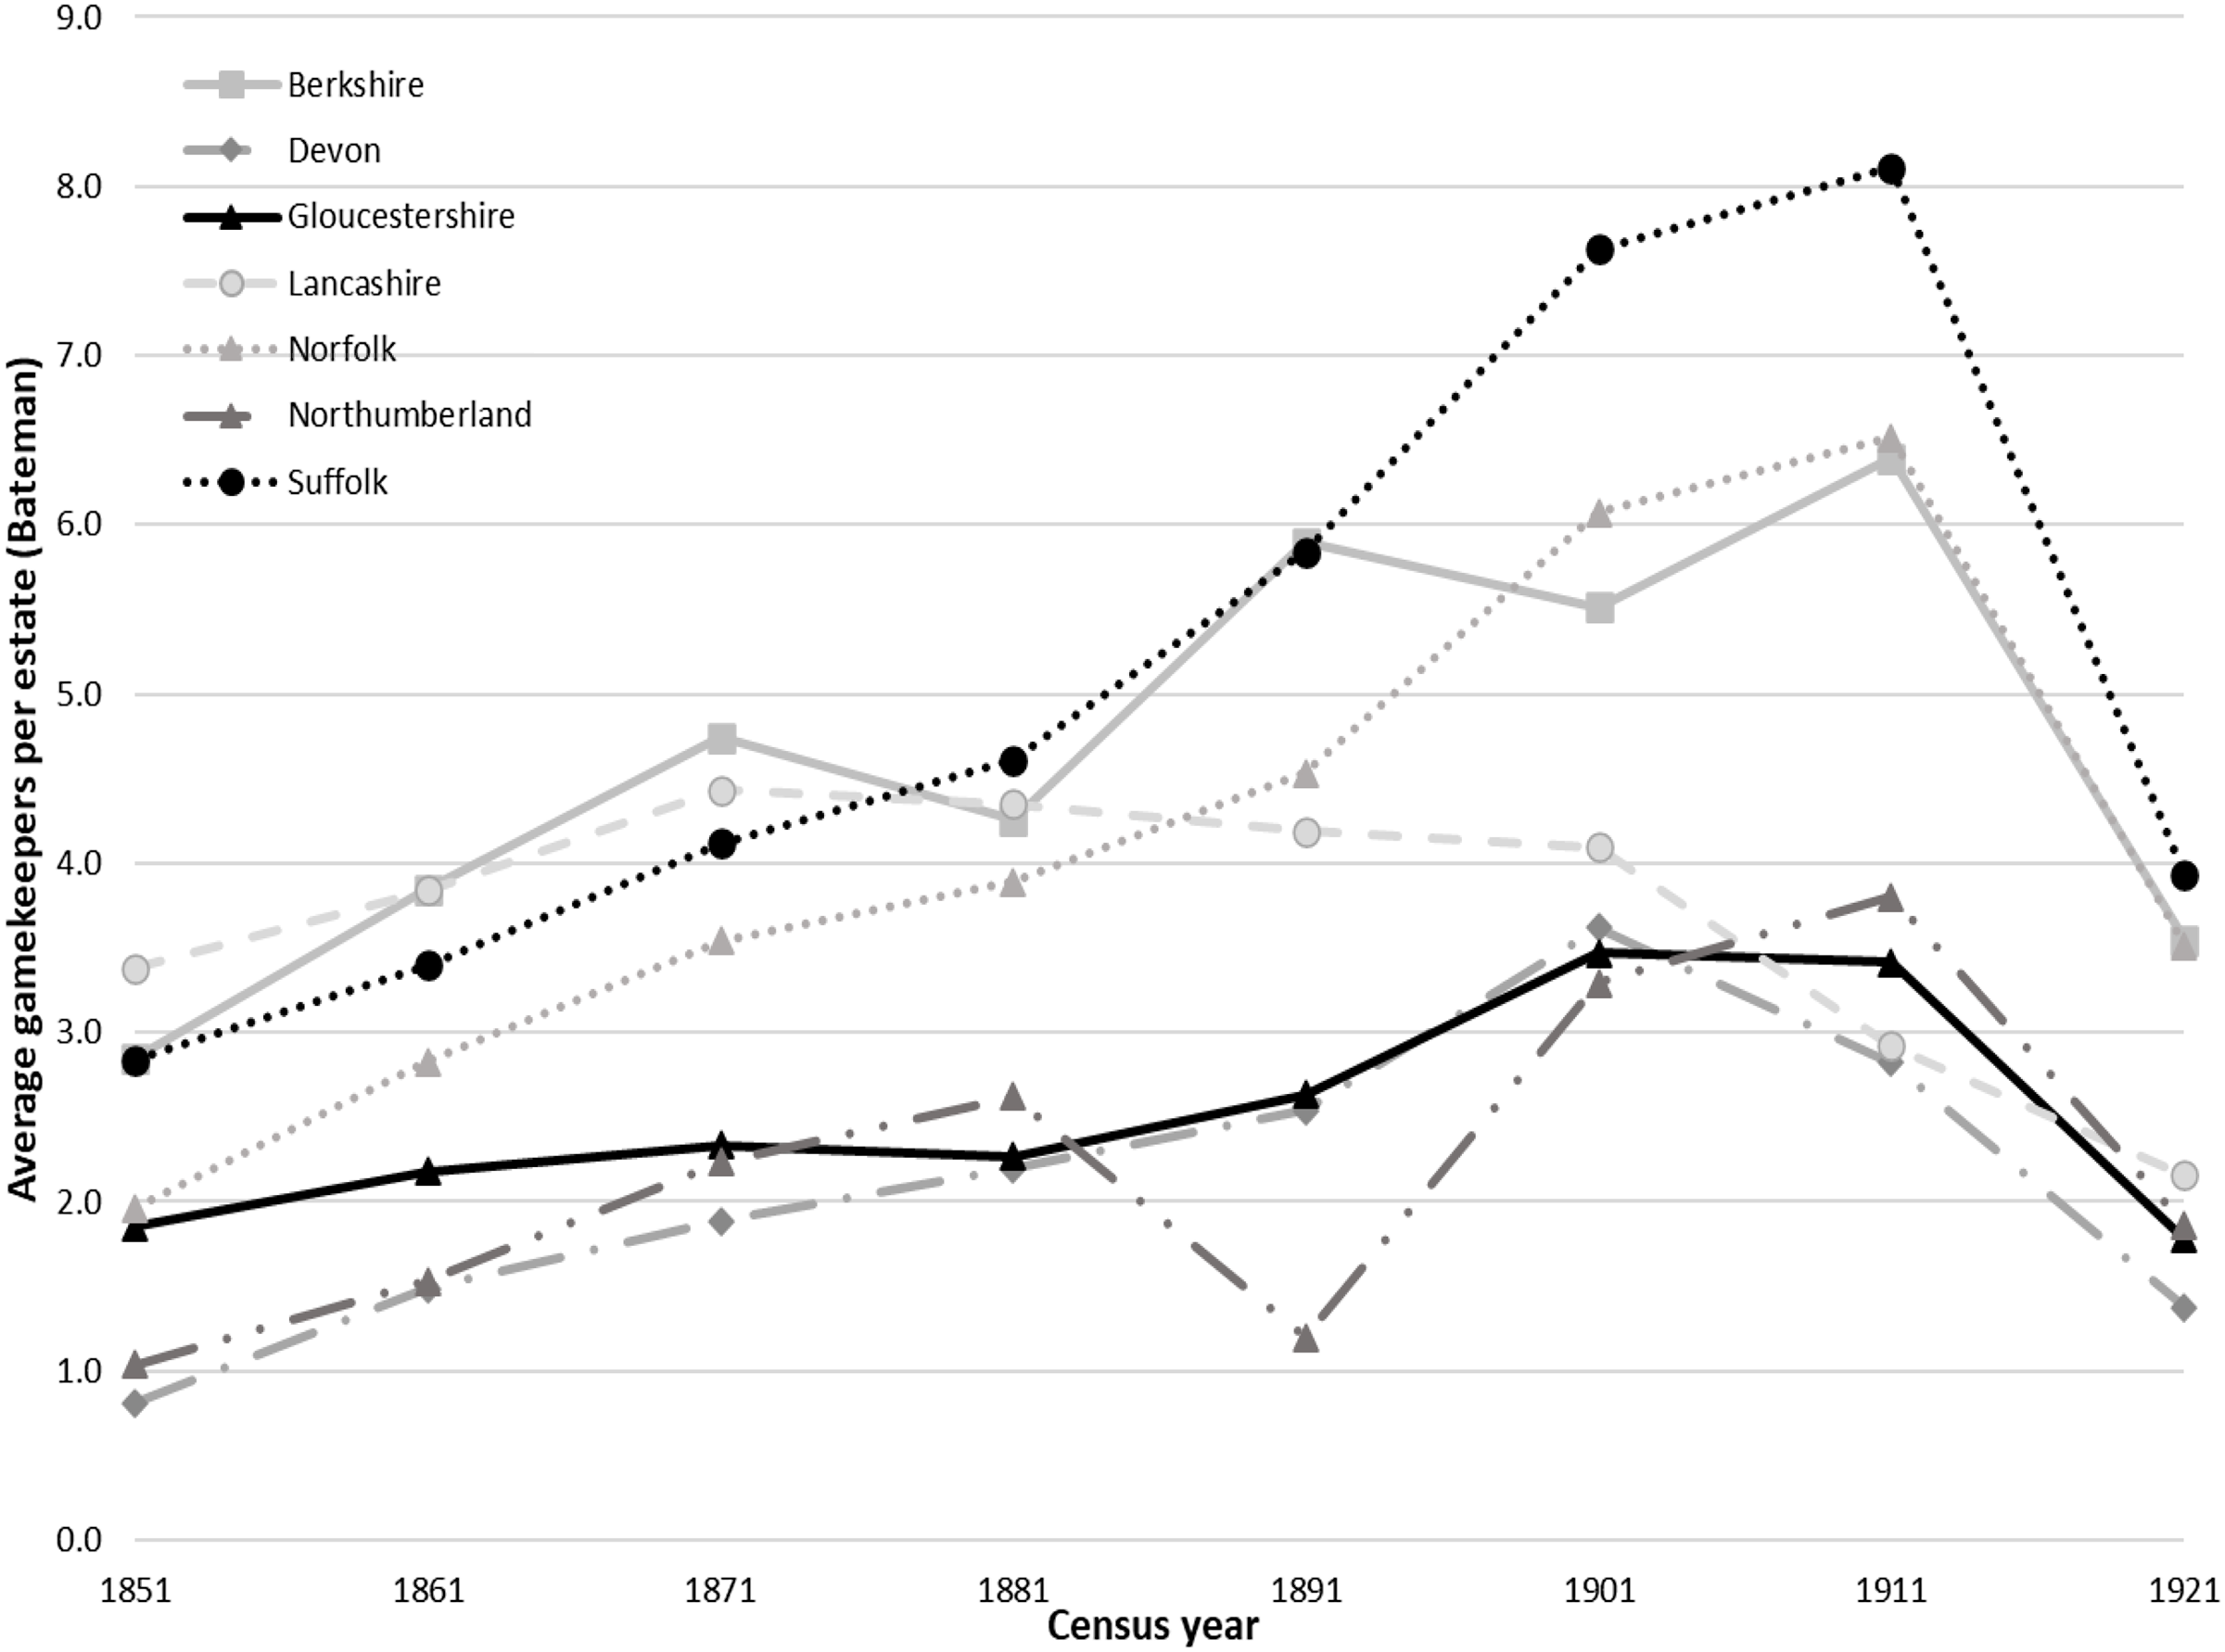
Figure 3. Gamekeepers per estate by county and census year using data from Bateman, The Great Landowners.
Devon, Gloucestershire, and Northumberland, the second group, showed similar trends of growth and decline to the first group but around half the number of gamekeepers per estate – between three and four (Figure 3). Northumberland had fewer gamekeepers per estate than counties with similar average estate area (Table 3), presumably reflecting both the concentration on grouse shooting and the county’s relative unpopularity among the shooting elite.Footnote 40 Much of Gloucestershire was suited to game rearing but, although there was some good pheasant shooting, numbers shot were low compared to more extensively preserved counties, and partridge shooting declined as ploughland was turned to grass, particularly between 1875 and 1905, a development that may have resulted in the relatively low increase in the number of gamekeepers per estate (Figure 3).Footnote 41 Lancashire started with most gamekeepers per estate, around four, but then entered a period of relative stability, rather than growth, so by 1901 numbers were more similar to Gloucestershire than Norfolk and from there on the decline mirrored those of Gloucestershire and Northumberland (Figure 3). The absence of growth may be related to the relocation of shooting estates to remote plateaus in an effort to avoid the ravages caused by poaching gangs from industrial areas.Footnote 42
Archer listed twenty major game estates in Lancashire in the nineteenth century, which, assuming there were four gamekeepers per estate, would have employed 15 per cent of the gamekeepers (eighty from 544 in 1881 and sixty from 365 in 1911), indicating that most gamekeepers were employed on minor estates.Footnote 43 The 1911 report from the Committee of Inquiry on Grouse Disease (the Committee) concluded that many grouse moors employed one gamekeeper per 6,000 to 10,000 acres, when a more appropriate ratio was one per 2,000 to 4,000 acres.Footnote 44 Based on this recommended ratio, the average 4,000-acre estate in Lancashire in 1911 should have had one or two gamekeepers, with five on the larger estates of Northumberland. Figure 3 shows four gamekeepers per average estate in Lancashire until 1901, higher than the Committee’s recommendation while, in Northumberland, numbers peaked at three per estate – around one per 5,000 acres – below the Committee’s recommendation. The Abbeystead estate of the Earl of Sefton in Lancashire was a major grouse estate in the late Victorian and Edwardian periods.Footnote 45 The Earl owned 20,250 acres in total, of which the shooting estate comprised around 8,000, about twice the average for Lancashire and, using Figure 3, could be estimated to employ seven gamekeepers in 1851, nine in 1881 and six in 1911.Footnote 46 The Over Wyresdale census returns, which covered the estate and adjacent hamlets, included one gamekeeper in 1851, eight in 1881, and 10 in 1911, numbers that reflected the development of the moor for grouse shooting by the Earl, but which were only close to the Figure 3 estimate in 1881.Footnote 47 Using the recommended ratio of the Committee, this moor should have around four keepers, fewer than observed in 1881 and 1911, demonstrating it was more heavily keepered than average. The greater density of gamekeepers in Lancashire until 1901, compared to Northumberland, might reflect differences in the popularity of shooting in each, as well as pressures in Lancashire from poaching gangs.
John Martin suggested that heavily managed estates in East Anglia using the labour-intensive Euston method of bird rearing employed one gamekeeper per 800 acres or, using average estate area (Table 3), ten per estate in Suffolk and thirteen in Norfolk.Footnote 48 In Norfolk, the Earl of Orford owned 12,000 acres at Wolterton while Lord Suffield owned 11,000 acres in Gunton and Suffield parishes.Footnote 49 Both estates were close to the average acreage for Norfolk (Table 3) giving an estimate (Figure 3) of two gamekeepers in 1851, four in 1881 and six or seven in 1911. In fact, the census returns showed that Lord Suffield employed four gamekeepers in 1851 and 1881, and just three in 1911, while at Wolterton there was one in 1851, two in 1881 and 10 in 1911, suggesting rising investment in shooting at Wolterton in the Edwardian period, but not in Gunton.Footnote 50 The census data did not match either the estimates of John Martin or those based on Figure 3. Abbeystead had as many gamekeepers as Wolterton suggesting that the interest of the landowner in shooting, and the depth of his pockets, was more important in determining the number of gamekeepers employed than estate area.
In the examples given, the number of gamekeepers per estate estimated using Figure 3 differed from those calculated by other means. To explore this discrepancy further, landowner numbers were obtained from Walford who, in his 1919 review of county families, provided a list for each county, although he did not give estate areas (Table 4).Footnote 51 Walford included all landowners who qualified as what he termed ‘county families’, even if they also owned major estates elsewhere, unlike Bateman who assigned a landowner to a single county. Like Bateman, Walford did not distinguish agricultural/sporting estates from industrial or urban ones, although his use of ‘county’ families, suggested a focus on those with land. In all counties except Northumberland, Walford listed more landowners than in Bateman’s first three categories, suggesting that he included families belonging to Bateman’s fourth group: Greater Yeoman with estates between 300 and 1,000 acres (Table 4).Footnote 52
Table 4. Number of county families based on Walford
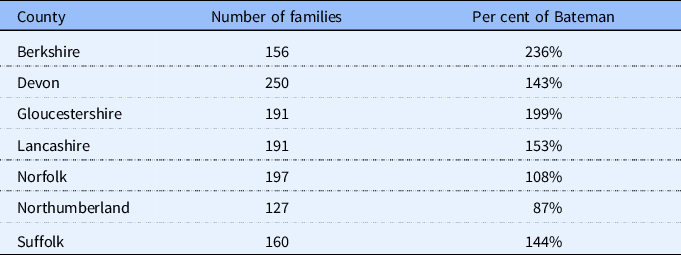
Source: Walford, The County Families, pp. 1501–27.
Using Walford’s landowner number to estimate the average number of gamekeepers per estate over time (the density), reduced the number for all counties, except Northumberland (Figure 4). Norfolk and Suffolk changed places as Norfolk now had about 0.5 more gamekeepers per estate than Suffolk. Lancashire tracked with Norfolk and Suffolk until 1871, rather than 1881, and averaged about three gamekeepers per estate until 1901, closer to the ratio recommended by the Committee (Figure 4). Gamekeepers increased in Northumberland from about one per estate in 1851 to a peak of just over four by 1901 (excluding 1891), still below the Committee’s recommended ratio. The lowered number of gamekeepers per estate for Berkshire grouped it with Gloucestershire and Devon, rather than Norfolk and Suffolk (Figure 4).
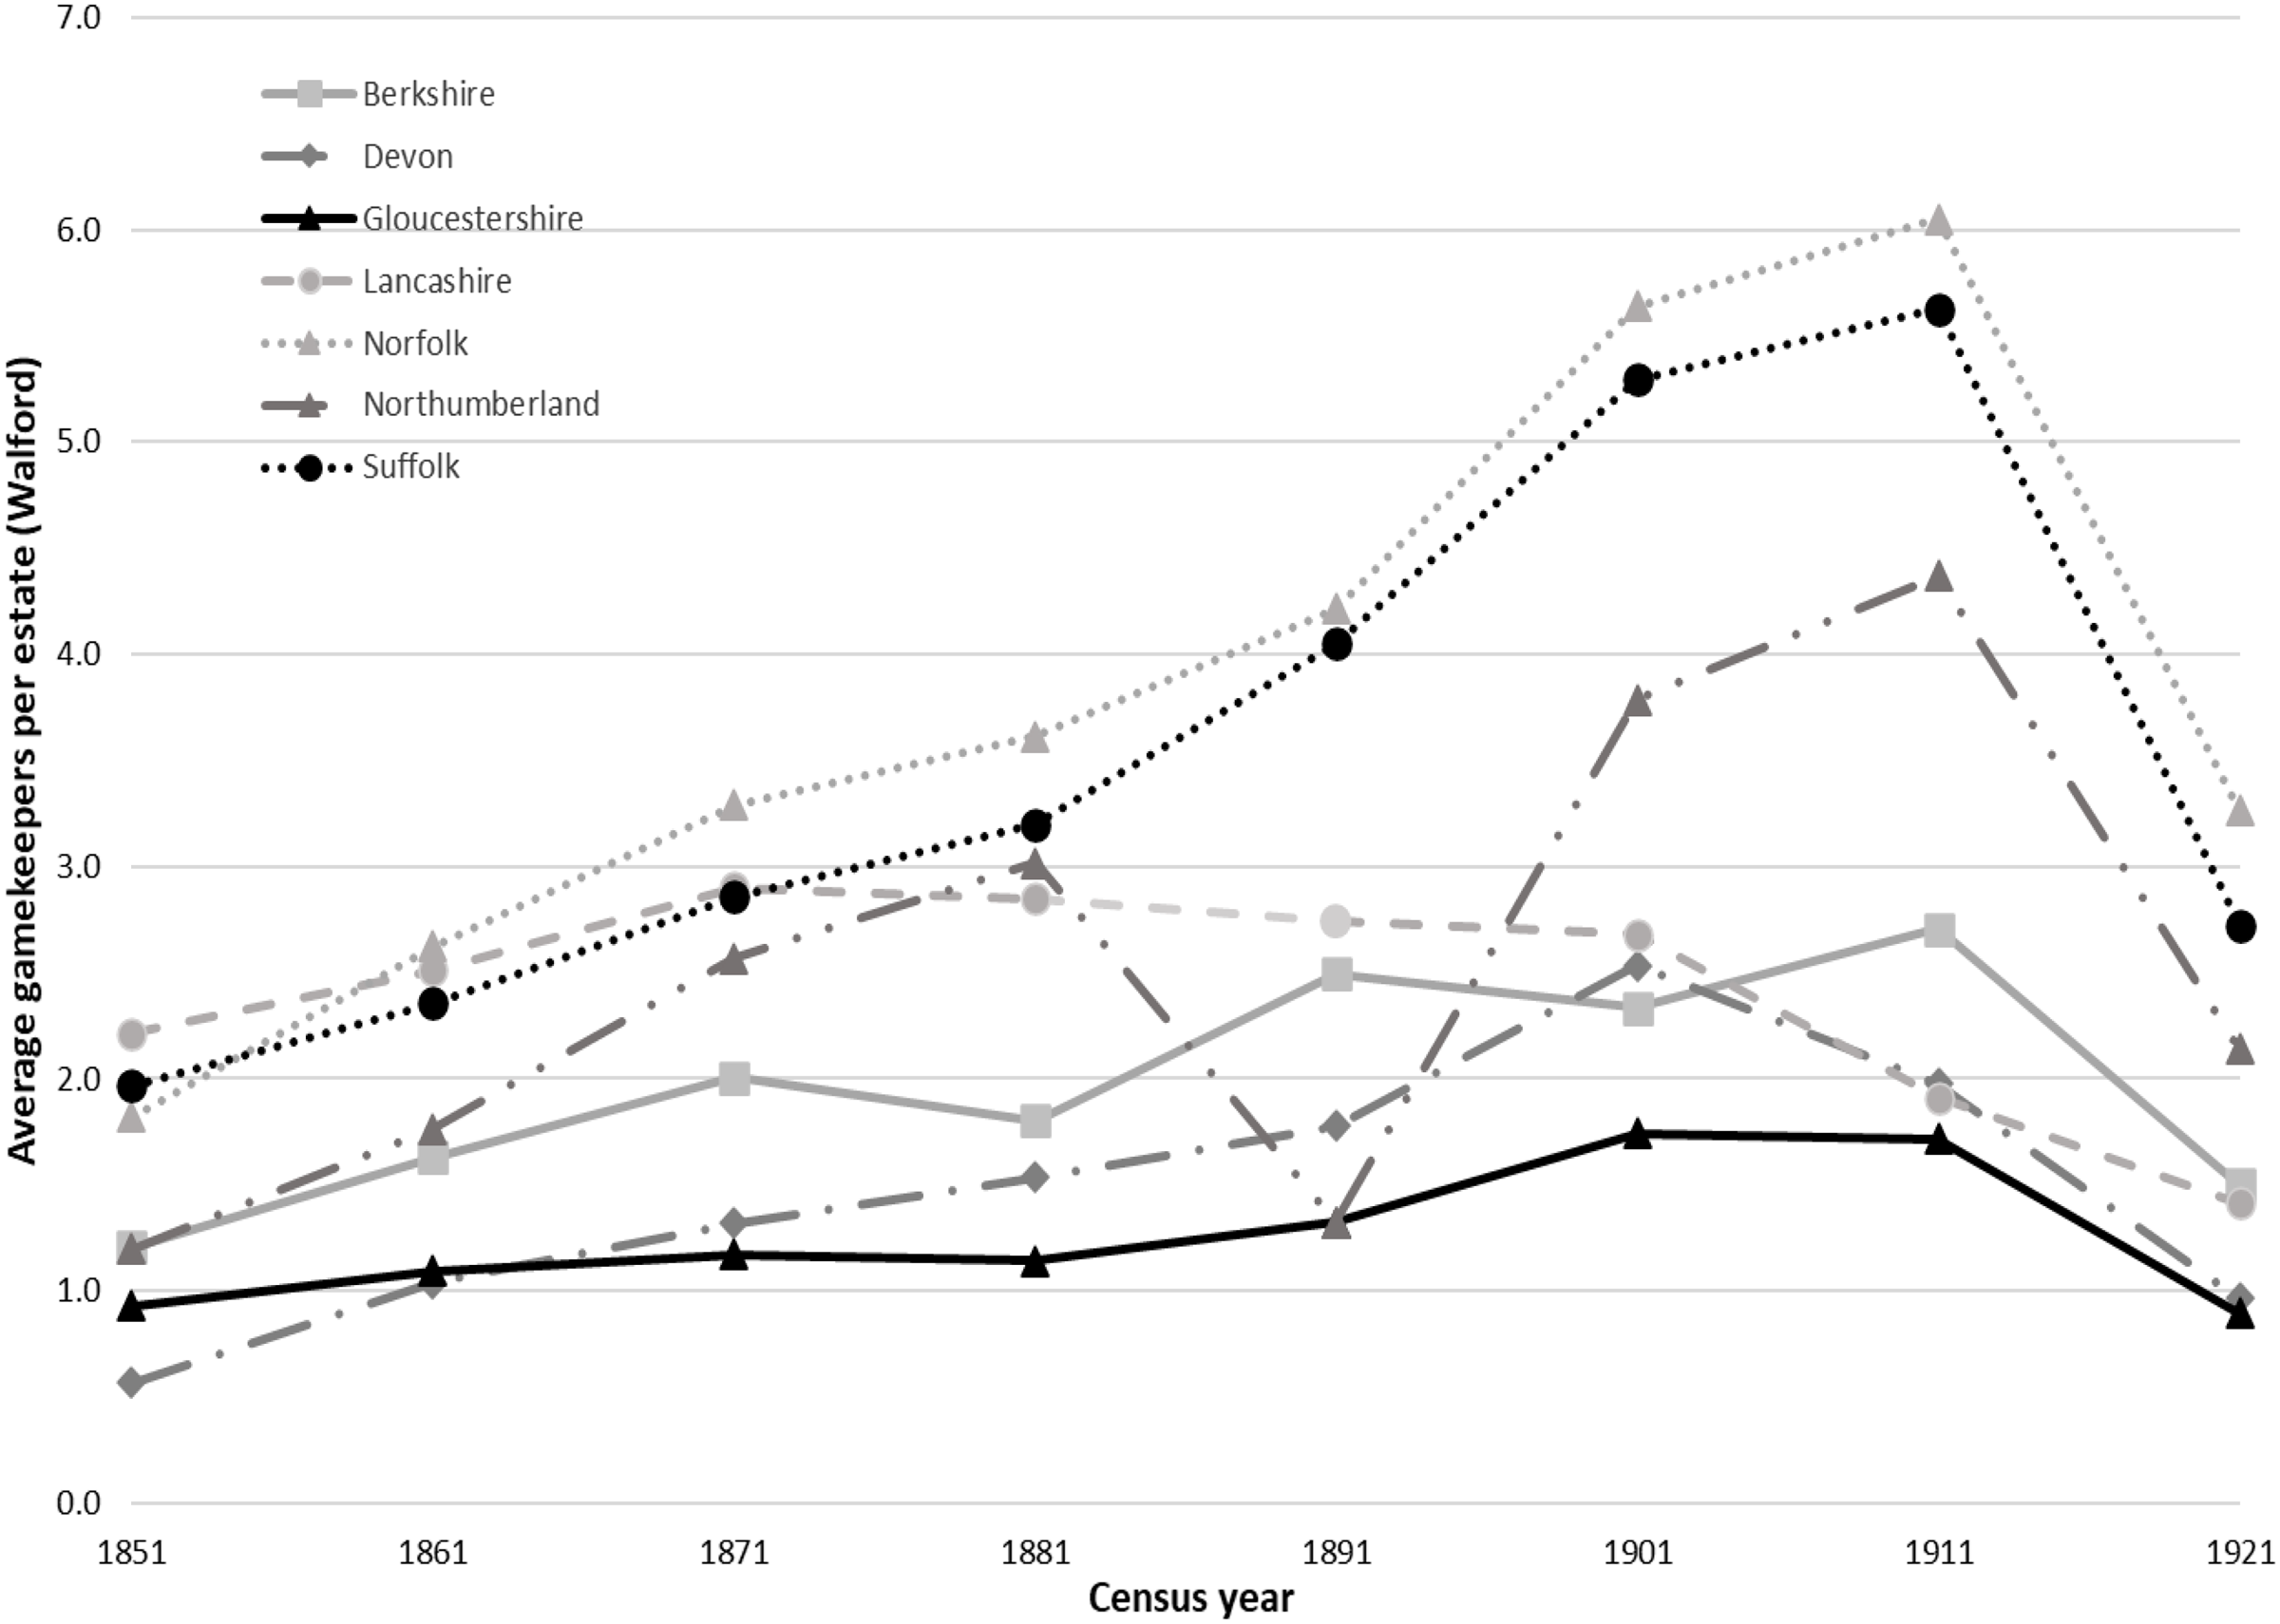
Figure 4. Gamekeepers per estate by county and census year using data from Walford.
Source: Walford, The County Families, pp. 1501–27.
Considering landowner numbers and estate area provided context to the census data and suggested how the density of gamekeepers changed at the estate level, although with no recognition of how much of an estate was devoted to shooting. It was not clear whether landowner numbers from Bateman or Walford provided a better estimate of the number employing gamekeepers, and the truth probably lies between the two but, for every large estate employing multiple gamekeepers, there were several employing just one or two. The number of estates employing gamekeepers would have changed over time, something that could be examined by looking at the local distribution of gamekeepers in census returns.
To examine whether peak employment of gamekeepers coincided with the highest numbers of birds shot, records for the number of birds shot in a day were examined. The record for grouse shot on 12th August (2,929) – the first day of the grouse season – at Abbeystead came from 1915, while records for partridge in Norfolk were set in 1905 (Holkham: 1,671; Sandringham: 1,342), and for pheasants in East Anglia in the first fifteen years of the twentieth century (e.g., Debden (1905): 1,144).Footnote 53 In general, record bags occurred after the period of rapidly increasing gamekeeper numbers (usually 1891–1901), at a time when numbers were stabilising or, in the case of Lancashire, had declined significantly. This time lag perhaps reflected the time taken for new gamekeepers to learn their roles, build up gamebird numbers, get the estate into good condition, optimise bird rearing, and reduce vermin. The landowner who wished to develop a new shooting estate needed patience in addition to abundant funds, with little return in the early years.
Poaching and gamekeeper numbers
Catching and deterring poachers were key parts of the gamekeeper’s role. This section examines poaching prosecutions and gamekeeper numbers to gauge the impact of gamekeepers on poaching. Jones, Archer and Carter, among others, enumerated poaching prosecutions, examined who poached and why, and the incidence of poaching gangs, but not with reference to gamekeeper numbers.Footnote 54 Osborne, and Osborne and Winstanley, provided numbers for poaching prosecutions and gamekeepers in selected counties, concluding that more gamekeepers increased the likelihood of detection, but not sufficiently to account for the general decline in prosecutions, and that socio-economic and other factors also played an important part.Footnote 55
From 1857 onwards, the annual criminal statistics provided county-by-county numbers for individuals prosecuted for daytime trespass in search of game or night poaching – the most likely offences to involve a gamekeeper – separately from prosecutions under the 1862 Poaching Prevention Act, which were brought by the Police.Footnote 56 Although not without their flaws, including the absence of county-level data for 1921 due to reorganisation of the statistics, counts were made under consistent rules, allowing meaningful comparisons against gamekeeper numbers for census years from 1861–1911.Footnote 57 Previous authors have discussed trends in poaching prosecutions in depth, so only brief details are given.Footnote 58 In England and Wales, more individuals were prosecuted in 1871 and 1881 (9,810 and 9,930: Table 5) than in 1861 (8452), but numbers declined after 1881, reaching 3,925 in 1911. There was a slight rise in 1921 (4379), perhaps related to the return of (unemployed) soldiers from military service.Footnote 59 Across the counties (Table 5), the number of prosecutions ranged from a low of 97 (Gloucestershire, 1861) to a high of 434 (Lancashire, 1871), with large variations over time.
Table 5. Number of poaching prosecutions, and compared to 1861, for census years (1861–1911)
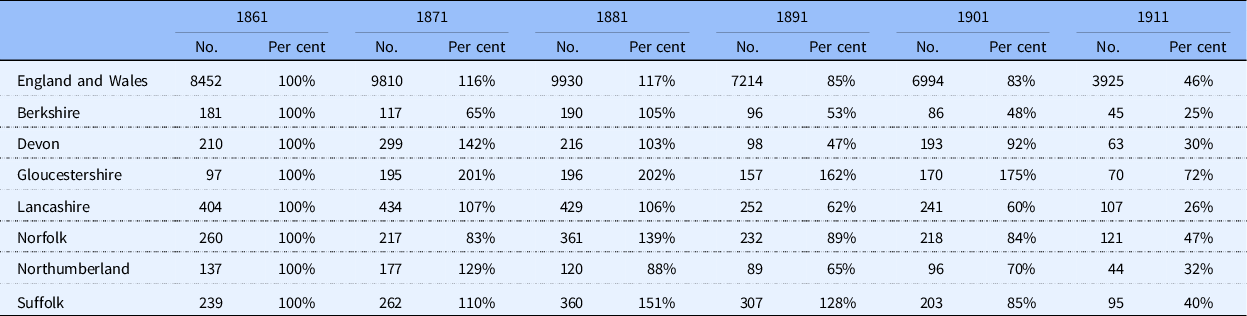
To compare the timing and extent of the changes at county level, the number of prosecutions was calculated as a percentage of the 1861 number (Table 5). Nationally, and in all counties, prosecutions peaked in 1871 or 1881, before declining to a minimum in 1911, in line with observations from other authors.Footnote 60 David Jones suggested that poaching prosecutions in East Anglia peaked in the 1880s, a finding in line with the data presented here (Table 5).Footnote 61 Osborne and Winstanley suggested that, from 1865–9, northern counties had two or three times as many poaching prosecutions as East Anglia, a finding that, in 1871, applied to Lancashire but not to Northumberland, which had significantly fewer prosecutions than Norfolk or Suffolk, perhaps related to its relative lack of industrialisation (Table 5).Footnote 62 The same authors identified a peak in prosecutions, nationally and in industrialising counties, in the late 1870s, which would fall between the data points used here.Footnote 63 Gloucestershire demonstrated an exceptionally large increase in prosecutions, and a smaller decline by 1911 (Table 5). The general decline in prosecutions after 1881 may be partly due to the passing of the 1880 Ground Game Act, which allowed tenants the right to shoot ground game such as rabbits, but later rises in prosecutions suggested that other factors were also important.Footnote 64
The number of prosecutions per gamekeeper was calculated to provide a measure of the influence of gamekeepers on poaching. England and Wales had a peak of 0.86 prosecutions per gamekeeper in 1861, but this dropped to 0.23 by 1911 (Figure 5). Lancashire and Devon started at a similar level to England and Wales but, while Lancashire tracked the national trend of gradual decline, Devon peaked at 0.9 in 1871, before a fourfold decline by 1891, a slight increase in 1901 and a final decline (Figure 5). In Gloucestershire, prosecutions per gamekeeper rose from the lowest ratio (0.46) in 1861 to around 0.9 in 1871 and 1881, and remained above 0.5 until 1901, before dropping to the national level by 1911. The remaining counties showed peaks and troughs, but all remained below the national level at all dates and declined to around 0.1 prosecutions per gamekeeper by 1911 (Figure 5).
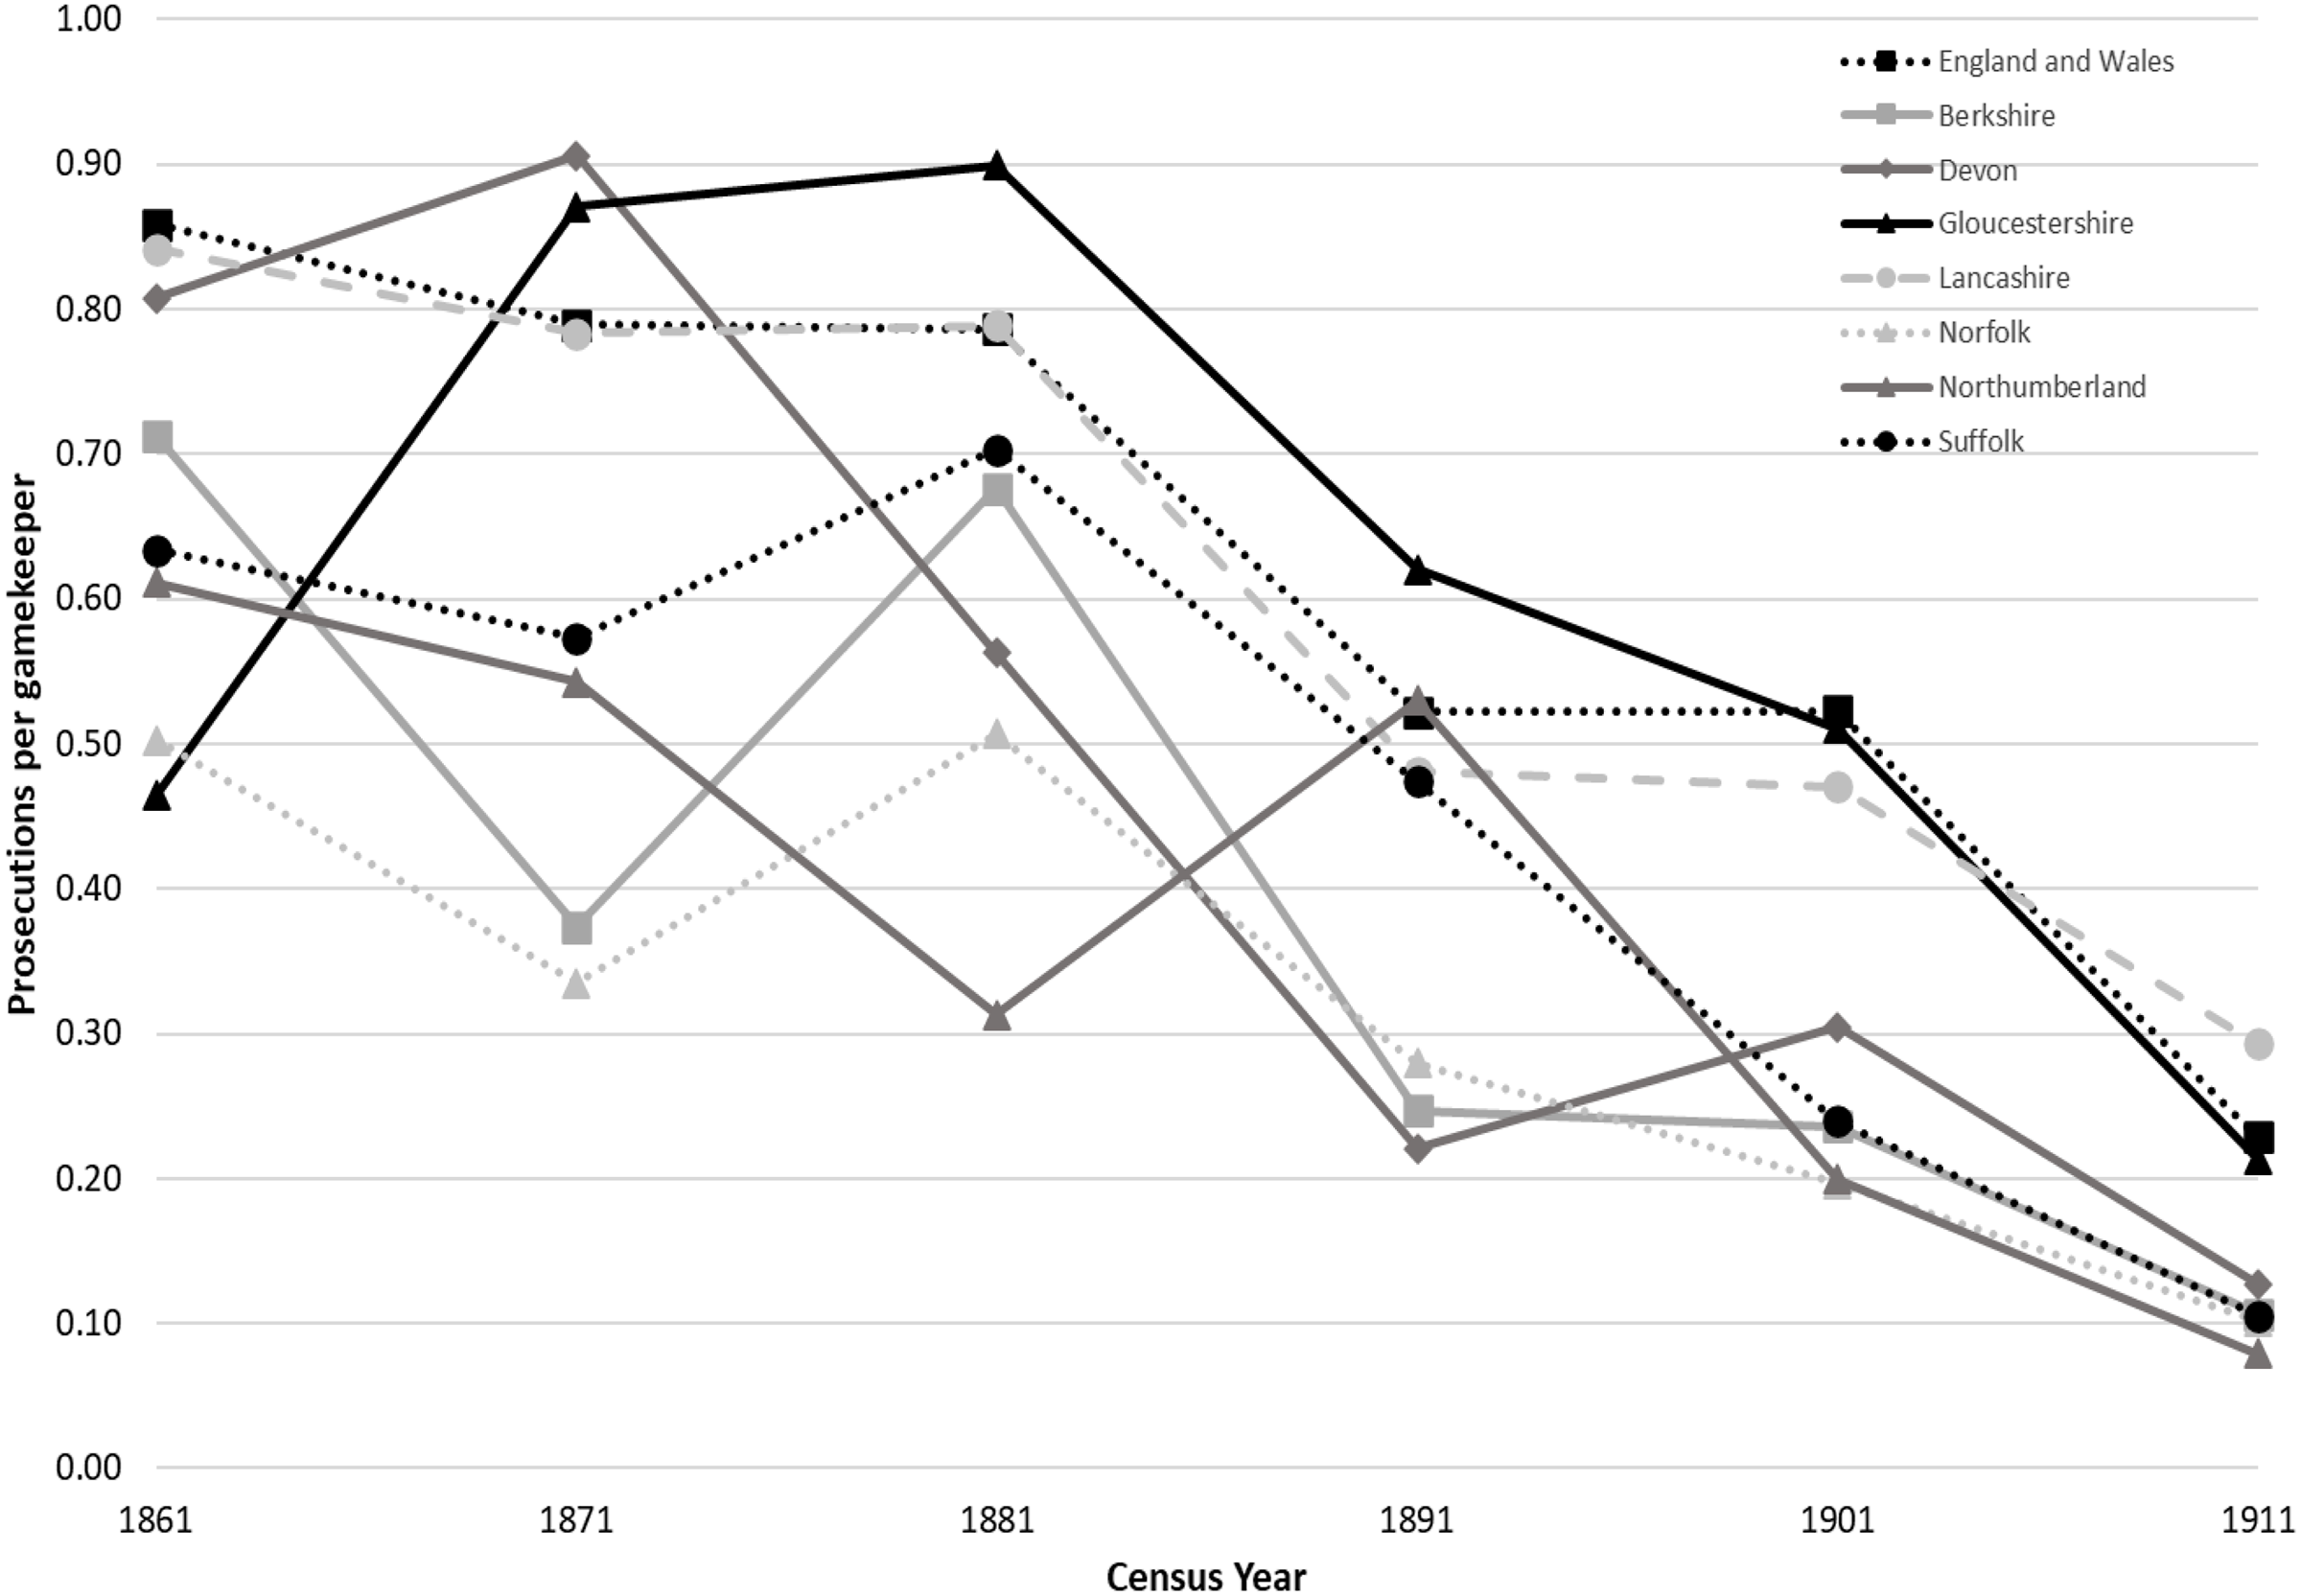
Figure 5. Poaching prosecutions per gamekeeper in census years (1861–1911) for selected counties and England and Wales.
Gamekeepers might influence poaching prosecutions either because more gamekeepers resulted in increased detection of poachers and prosecutions, or because they deterred casual poachers, thus reducing prosecutions. Lancashire demonstrated national levels of prosecutions per gamekeeper until 1881, when it had high numbers of gamekeepers, suggesting that here more gamekeepers might have resulted in increased detection and prosecution, with detection declining later as the number of gamekeepers fell. In Norfolk, prosecutions per gamekeeper were some of the lowest but increased from 1871 to 1881, suggesting increased detection by the increasing number of gamekeepers, but declined from 1891 as gamekeeper numbers reached their peak, perhaps reflecting deterrence. In large counties with few gamekeepers, such as Devon or Northumberland, encounters between locals and gamekeepers would be less common, reducing the risk of detection and prosecution and hiding any link to gamekeeper numbers. Both counties demonstrated declines in prosecutions per gamekeeper (excluding 1891 for Northumberland), although Devon showed a dramatic drop from 1871 to 1891 while prosecutions per gamekeeper in Northumberland did not decline until later (Figure 5).Footnote 65 Despite having relatively few gamekeepers, in 1871 and 1881, Gloucestershire had very high levels of prosecutions (Figure 5). Previous authors have suggested a correlation between agricultural wages and poaching, which may be a factor as Gloucestershire had most prosecutions when agricultural wages in the county were at their lowest.Footnote 66 Examination of assize and poor law records might provide evidence to substantiate any link between wages and poaching. Gamekeepers in Gloucestershire seem to have been particularly assiduous in catching and prosecuting offenders as their density was only around 0.6 per 1,000 acres at this period, much lower than in counties with fewer prosecutions, suggesting pressure from landowners to protect their game, perhaps as a reaction to the conditions of agricultural labourers. Poaching prosecutions per gamekeeper began to decline as the rural population of Gloucestershire started to drop, suggesting that rural depopulation may also have played a role in reducing poaching prosecutions.
As suggested by other authors, increasing gamekeeper numbers may, at times, have resulted in more prosecutions, or deterred the casual poacher, but the influence in each county differed across time and from other counties, making it difficult to distinguish correlation from causation.Footnote 67 The data do not support the suggestion that, in the Edwardian period, ‘where game was heavily preserved, poaching remained common’, as heavily preserved counties like Norfolk and Suffolk had relatively few prosecutions in this period.Footnote 68 Even within heavily keepered counties, the distribution of gamekeepers was patchy, therefore many areas would have had few gamekeepers and a reduced possibility of detection.Footnote 69 Factors such as the increasing concentration of the population in cities, improvements in standards of living and the growth of alternative pastimes and self-improvement through churches, clubs and institutes would have contributed to declining poaching prosecutions and masked the influence of gamekeepers.Footnote 70
Conclusions
This article explored gamekeeper numbers from the mid-Victorian period until after the First World War, nationally and in a section of English counties. Although the national growth in gamekeeper numbers from 1851 until 1911 was mirrored within most counties, there were differences in the timing of peak numbers and in the amount of growth. Devon, for example, showed the greatest proportional increase in gamekeeper numbers, although remaining lightly keepered compared to Norfolk and Suffolk, while gamekeeper numbers in Lancashire began declining about thirty years earlier than in the other counties, both observations which merit further study. In general, the proportion of gamekeepers in the population peaked in 1901 or 1911 and declined steeply by 1921. Differences in population growth between the counties did not account for the different trends in gamekeeper numbers.
Factors such as county area, average estate area and gamekeepers per estate were examined for the first time. County area did not correlate with gamekeeper numbers, with some large counties having many gamekeepers, while others had few. There also were significant differences between the studied counties in estate area and gamekeepers per estate. Estates in Northumberland were, on average, four times the area of those in Berkshire but, using Bateman’s data, had fewer gamekeepers, perhaps reflecting differences in quarry (grouse or pheasant) and popularity. Gloucestershire stood out for the high level of poaching prosecutions, an observation that deserves further analysis. In general, the counties furthest from London showed the lowest growth in gamekeeper numbers and had the fewest gamekeepers per estate. Lancashire had the most gamekeepers in the early years, but numbers stagnated here while they grew elsewhere. The counties with many gamekeepers, in total and per estate – Norfolk, Suffolk and (to a lesser extent) Berkshire – had significant royal estates and patronage by the landed elite. The enthusiasm of landowners in these counties for game shooting – alongside the poor suitability of much of the soil for intensive agriculture and the relative ease of access – drove development of extensive shooting and increased gamekeeper numbers. The data suggested a link between gamekeeper numbers and poaching prosecutions in some counties, but this was masked by the influence of other factors. In each county, gamekeeper numbers responded to local circumstances, so care is needed when applying inferences from one county to another or applying national data to regions.
Acknowledgements
The author would like to thank Professor Kevin Schürer, formerly at the University of Leicester and now at the University of Cambridge, for his support during the writing of the dissertation on which this work is based. The author would also like to thank the editors and anonymous reviewers for their helpful and insightful comments on earlier versions of this work.
Competing interests
The author declares none.


 Open access