


Introduction
Video-based lectures have become an important component of online instruction (Means et al., Reference Means, Toyama, Murphy, Bakia and Jones2009), often including various visuals alongside aural commentaries to help illustrate key terms and concepts. These visuals, considered as an intrinsic part of the input supporting multimodal comprehension, can be classified into two basic types. Exophoric signals, including drawings or written texts on a whiteboard, function as references for the aural text and are important for text interpretation. Kinesic signals, on the other hand, describe the speaker’s body movements and directions of their gaze when they produce the text (Rost, Reference Rost2011). Although such visual information is often an integral component in academic materials, research on how second language (L2) learners interact with visuals during video-based lecture viewing remains limited. Notably, a few studies have investigated the role of visuals, such as gestures and facial expressions, in L2 comprehension, through exposing participants to different visual input conditions (e.g., Drijvers & Özyürek, Reference Drijvers and Özyürek2018; Sueyoshi & Hardison, Reference Sueyoshi and Hardison2005). In addition, Suvorov (Reference Suvorov2015, Reference Suvorov, Wagner and Ockey2018) has begun to explore learners’ visual attention to video-based lectures with varied visual information in the context of L2 assessment. Nevertheless, little is known about how learners allocate their attention to exophoric and kinesic signals during lecture viewing and the conscious cognitive processes involved in L2 multimodal comprehension. Our understanding of the relationship between attention allocation and comprehension is also limited.
Taking an L2 learning perspective, it is not only important to understand the mechanisms involved in the processing of multimodal input but also to explore ways to develop learners’ processing ability, including skills to comprehend spoken, kinesic, and exophoric (written verbal and pictorial) information, as well as to integrate information from multiple sources. Among various pedagogical options, the potential of task repetition seems particularly worthwhile to investigate with a view to identifying ways to promote L2 learners’ multimodal input processing skills. First, video-based lectures lend themselves well to designing pedagogic tasks, defined as activities “where meaning is primary; there is some communicative problem to solve; some sort of relationship with real-world activities; and the assessment of task is in terms of a task outcome” (Skehan, Reference Skehan1998, p. 95). These criteria are naturally met by lecture-viewing tasks, such as taking notes based on a video lecture, allowing L2 learners to engage in cognitive processes similar to those in real-life academic situations. Notably, repeatedly viewing/listening to a video lecture is itself a real-life activity, with the ever-increasing use of online platforms in higher education settings. Second, task repetition, by enhancing learners’ familiarity with the input to be processed, may also afford learners the opportunity to practice processing skills that they had little capacity to engage in during their first viewing (e.g., Skehan, Reference Skehan1998). For example, in the case of multimodal input, repeating the task may facilitate additional practice in integrating input from different modalities as it frees up attentional capacity to notice information that students might not have been able to process initially. Despite these potential benefits, little research has explored the impact of repeating video-lecture-based tasks on L2 processing.
To address these research gaps, the current study aimed to investigate the extent to which repeating video-lecture-based tasks affects learners’ visual attention to different lecture stimuli (the instructor and diagrams), as well as their conscious thought processes during viewing. The study also investigated the extent to which the relationship between learners’ visual attention and lecture comprehension varied across their initial and repeated viewing. To capture the complex nature of multimodal comprehension, we collected data from various sources, including eye-gaze recordings, stimulated-recall interviews, and comprehension tests.
Literature review
L2 listening processes and strategies
Although L2 researchers increasingly acknowledge the important role of visual information in video-mediated listening (e.g., Batty, Reference Batty2020; Ginther, Reference Ginther2002; Gruba, Reference Gruba1997; Suvorov, Reference Suvorov2015, Reference Suvorov, Wagner and Ockey2018; Wagner, Reference Wagner2007, Reference Wagner2010), theoretical work on integrating aural and visual information during listening is still limited. Therefore, to theorize the processes involved in video-lecture-based tasks, we invoked models of L2 listening as well as multimedia learning.
As a model of L2 listening, we relied on Field’s (Reference Field, Taylor and Weir2013) influential framework. This model classifies listening processes into lower- and higher-level processes. Lower-level processes include input decoding, which involves converting a sequence of acoustic signals into abstract representations that match the phonological system of the target language; lexical search, which refers to identifying lexical items that best correspond to spoken word forms; and parsing that separates units in connected speech to construct propositions. Higher-level processes entail the operations of meaning and discourse construction. During meaning construction, listeners relate the propositions obtained through lower-level processes to their existing schemata to establish the meaning of what they have heard. Discourse construction entails four sub-processes: selection helps the listener notice information essential to the topic or the speaker’s goal; integration involves adding new information to the discourse representation being developed; self-monitoring enables the listener to evaluate the developing representation for consistency against previously processed content, and structure-building entails prioritizing and organizing the information gathered according to its level of relevance and importance. L2 listeners engage in these lower- and higher-level processes in a parallel and recursive fashion, drawing on different types of knowledge sources (Field, Reference Field, Taylor and Weir2013).
L2 listening research has also indicated that strategy use plays an important role in listening processes. According to Vandergrift and Goh (Reference Vandergrift and Goh2012), listening strategies can be broadly categorized as cognitive, metacognitive, and socio-affective. Cognitive strategies help listeners solve comprehension problems, while metacognitive strategies assist listeners in managing and supervising listening processes. Socio-affective strategies, on the other hand, enable learners to cope with anxiety and emotions to improve listening outcomes. Using this three-way categorization, Vandergrift and Goh created a taxonomy of listening strategies, with (a) cognitive strategies including inferencing, elaboration, prediction, contextualization, reorganizing, and using linguistic and learning resources; (b) metacognitive strategies subsuming planning, focusing attention, monitoring, and evaluation; and (c) socio-affective strategies encompassing cooperation and managing emotions.
Processing of L2 multimodal input
While listening processes and strategy use have received considerable theoretical attention in L2 research, relatively little theoretical consideration has been given to how L2 learners process multimodal input. Therefore, following previous L2 studies on multimedia learning, we have drawn on models from educational psychology, Mayer’s (Reference Mayer and Mayer2014a) cognitive theory of multimedia learning and Schnotz’s (Reference Schnotz and Mayer2014) integrative model of text and picture comprehension, to theorize L2 multimodal processing. Mayer’s (Reference Mayer and Mayer2014a) framework aims to explain how people construct meaning from words and pictures, building on three cognitive assumptions: (a) humans possess separate information processing channels for auditory/verbal and visual/non-verbal information (Baddeley, Reference Baddeley1992; Paivio, Reference Paivio1986); (b) each channel has limited processing capacity (Baddeley, Reference Baddeley1992); and (c) learning occurs through active cognitive processing, involving the processes of attending to relevant information, constructing selected information into coherent mental representations, and integrating the mental representations with existing knowledge (Wittrock, Reference Wittrock1989).
Schnotz (Reference Schnotz and Mayer2014) expands on Mayer’s (Reference Mayer and Mayer2014a) work by distinguishing between the processing of auditorily and visually presented words. The model includes four main parts: listening, reading, visual picture, and auditory picture comprehension. Only the first three components are directly relevant to the current study. During listening comprehension, first auditory-verbal information enters the auditory register through the ear; then learners identify phonemes in the acoustic input and form phonological lexical patterns. Further parsing of word sequences and semantic analysis results in propositional representations, which are then transformed into a mental model. The mental model includes representations of the key parts of the material presented and their relations. These steps are broadly aligned with the stages described in Field’s (Reference Field, Taylor and Weir2013) model. In reading comprehension, visually presented verbal information enters the visual register through the eye. Then, learners perform graphemic input analysis, identifying graphemes in the visual input and recognizing graphemic lexical patterns. In the next step, propositional representations are formed, and a mental model of the text content is constructed. During visual picture comprehension, visual pictorial information is recorded in the visual register, and, through the process of visual feature analysis, learners identify and discriminate graphic entities in the visual pictorial input and organize them to form visuospatial structures. Next, learners engage in depictive processing, constructing a mental model of the picture’s content through mapping visual spatial relations onto mental semantic relations.
L2 Multimodal comprehension also requires text-picture integration at the level of surface and semantic deep structures (Schnotz & Wagner, Reference Schnotz and Wagner2018). Surface structure mappings involve connecting verbal elements (words) and graphical elements (lines and shapes) using cohesive devices such as common color coding (use of colors to connect the depicted parts with the corresponding names). Semantic deep structure mappings include connecting propositional representations of the semantic content with depictive structural characteristics of the mental model. For example, when learners read about how different parts of the brain control various functions while viewing an image of the brain, they have to map the propositional description of these functions onto the corresponding spatial configurations in the mental model of the brain.
While Schnotz’s model allows for conceptualizing learning through instructional pictures, such as labeled diagrams, it does not account for social cues such as an instructor’s eye contact, facial expressions, and gestures that convey important nonverbal information during lecture-viewing tasks. Integrating this aspect into the cognitive theory of multimedia learning, social agency theory (Mayer et al., Reference Mayer, Sobko and Mautone2003) claims that social cues in multimedia instructional input can generate a feeling of social presence, which leads to deeper cognitive processing and better learning outcomes. However, it has also been proposed that visually presented social cues might shift learners’ attention away from instructional pictures and subsequently undermine learning outcomes (Colliot & Jamet, Reference Colliot and Jamet2018). Although some studies investigated the role of gestures and facial expressions, suggesting that L2 listeners were more likely to benefit from social cues when speech information was more intelligible (Drijvers & Özyürek, Reference Drijvers and Özyürek2018), there have been no attempts to explore the relationship between comprehension and attention allocation to both social cues and instructional pictures.
Repetition and L2 listening processes
Given the complex demands posed by the processing of multimodal input and the ubiquitous use of multimedia materials in academic and other real-life settings, it is vital to identify pedagogical techniques that can help develop L2 learners’ ability to process multimodal materials. As discussed earlier, task repetition appears to hold particular promise for developing L2 learners’ multimodal input processing skills. On the one hand, it engages learners in carrying out pedagogic tasks resembling real-life multimodal activities (Skehan, Reference Skehan1998), which increases the chance that learners transfer any learning benefits to real-world contexts (Lightbown, Reference Lightbown and Han2008), while also aligning with the common practice of encouraging repeated listening and viewing in language classrooms. On the other hand, repeating a task offers psycholinguistic advantages. According to Skehan’s (Reference Skehan1998) limited capacity model, task repetition may benefit learners because it increases learners’ familiarity with the overall content conveyed in the text(s), thereby freeing up attentional resources to focus on the language used to express meanings. Applying this to the context of multimodal processing, listeners/viewers will likely focus primarily on meaning construction during the first listening/viewing. In subsequent listening/viewing, however, attentional resources that would have been focused on meaning are free to be directed to the processing of language. Arguably, task repetition also enables listeners to switch attention to information that they might have missed or had difficulty fully processing during a previous round of listening/viewing. As a result, repeating multimodal tasks, for example, may create opportunities to practice integrating information from varied input modalities by easing up cognitive capacity to allocate attention to pieces of information that might have been left unprocessed during an initial listening/viewing.
Despite the potential benefits, there has been little empirical investigation into the effects of repeating multimodal tasks on L2 multimodal processing. However, in the field of language testing, two studies have examined test-takers’ listening processes and strategic behavior in relation to double play, that is, hearing a listening text twice during a test. Field (Reference Field2015) explored the impact of double play on test-takers’ performance on two IELTS listening tasks (multiple-choice, gap-filling) among 73 students studying in a university language preparatory program. The results of quantitative analyses showed that test-takers’ scores significantly increased after a second hearing. Qualitative data collected from semi-structured and stimulated-recall interviews with another 37 students revealed that double play reduced test-takers’ listening anxiety and increased their familiarity with the listening texts, allowing them to locate key information that they had missed earlier. In addition, many test-takers reported that they gained a wider perspective of the listening content and the speaker’s goals during the second listening, although their attention was still heavily focused on word-level decoding.
Holzknecht (Reference Holzknecht2019) also adopted a mixed-methods design to explore the role of double play in listening assessment. In this study, 306 Austrian secondary school students completed a set of multiple-choice and gap-filling test questions under either a single- or double-play condition. The quantitative results were in line with Field’s (Reference Field2015) findings, showing that double play significantly improved test scores. Sixteen students also participated in a stimulated-recall session, prompted by recordings of their eye movements and listening tests under both the single- and double-play conditions. The stimulated-recall results revealed that double play led to greater reliance on higher-level processes, less engagement in lower-level processes, and the use of a wider range of listening strategies.
The results of these two studies do suggest that, indeed, repeated listening enables L2 users to engage in more varied practice of input processing skills than a single listening would make possible. It is yet to be explored, however, whether this observation also applies to repeating video-lecture-based tasks.
Exploring processes underlying L2 viewing
Although the impact of task repetition on the processing of multimodal input has received little research attention to date, a growing number of L2 studies have begun to investigate L2 users’ cognitive processes involved in video-based listening activities, primarily in the context of language testing. Suvorov (Reference Suvorov2015, Reference Suvorov, Wagner and Ockey2018) was among the first to examine how test-takers interacted with context-based videos (that only show the instructor and setting) vs. content-based videos (that additionally display visual aids such as graphs or images to enhance the content). The participants were 33 university students, who completed video-mediated tests while their eye movements were tracked, followed by stimulated-recall interviews based on the recordings of their eye movements. Suvorov (Reference Suvorov2015) observed that the test-takers attended to the visual information to a greater extent in the content-based than context-based videos, as assessed by eye fixations at the area of the screen including the video. No significant relationships, however, were found between participants’ test scores and visual attention (measured by eye fixation rate, dwell rate, and percentage of total dwell time). The stimulated-recall results, reported in Suvorov (Reference Suvorov, Wagner and Ockey2018), further revealed that test-takers focused more on the speaker’s characteristics (e.g., appearance, gestures) than elements related to the lecture content (e.g., visual aids, textual information) during viewing. Lecture-related visuals, however, were more frequently mentioned as helpful, as they facilitated lecture comprehension and note-taking; whereas some test-takers commented that speaker-related visuals were difficult to interpret or to integrate with audio content, and mentioned that the speaker’s body movements occasionally distracted them from listening and/or note-taking. Nevertheless, other participants considered some speaker-related aspects useful; for example, they reported that seeing the speaker’s mouth improved their comprehension, and the speaker’s presence helped them maintain focus on the lecture.
In a more recent study, Batty (Reference Batty2020) focused on test-takers’ visual attention to speakers’ social cues in a video-based test. Twelve Japanese undergraduate students of L2 English watched six videos featuring two actors having a daily conversation, completing one multiple-choice item per video. This was followed by a stimulated-recall interview with participants’ eye-gaze recordings serving as stimuli. The eye movements were studied through scanpath-overlaid videos of test-takers’ viewing behaviors using manual coding. The researcher found that test-takers spent 81.74% of their time looking at the speaker’s face, largely splitting their attention between the speaker’s eyes and mouth. The participants reported that the main reason underlying their viewing behaviors was to determine the emotional state of the speakers.
Both Suvorov’s and Batty’s work, through the joint application of stimulated recall and eye-tracking, yielded valuable information about learners’ viewing behaviors and conscious thought processes during video-based tests. Nonetheless, little is known about the cognitive processes in which L2 learners are involved when performing video-lecture-based tasks, and how such online processing patterns may relate to lecture comprehension.
The present study
Against this background, we employed eye-tracking to capture learners’ real-time viewing behaviors and stimulated recall to tap their conscious cognitive activities during video-lecture-based tasks, with the aim of addressing the following research questions (RQs):
To what extent does repeating a video-lecture-based task affect:
-
1. learners’ attention to the instructor and diagrams, as reflected in their eye movements and stimulated-recall comments?
-
2. the relationship between learners’ visual attention to the instructor and diagrams and their lecture comprehension?
For RQ1, we hypothesized that learners’ visual attention to the instructor would increase during repeated viewing, whereas their attention to the diagrams would decline. Following Suvorov (Reference Suvorov, Wagner and Ockey2018), we assumed that diagrams would be more helpful to facilitate comprehension in initial viewing. In light of Batty’s (Reference Batty2020) findings, however, we expected that learners’ attention would naturally shift to the speaker after having gained some familiarity with the diagrams. For RQ2, given that previous research has not directly investigated the relationship between attention allocation and comprehension, we formed a non-directional hypothesis.
Method
Design
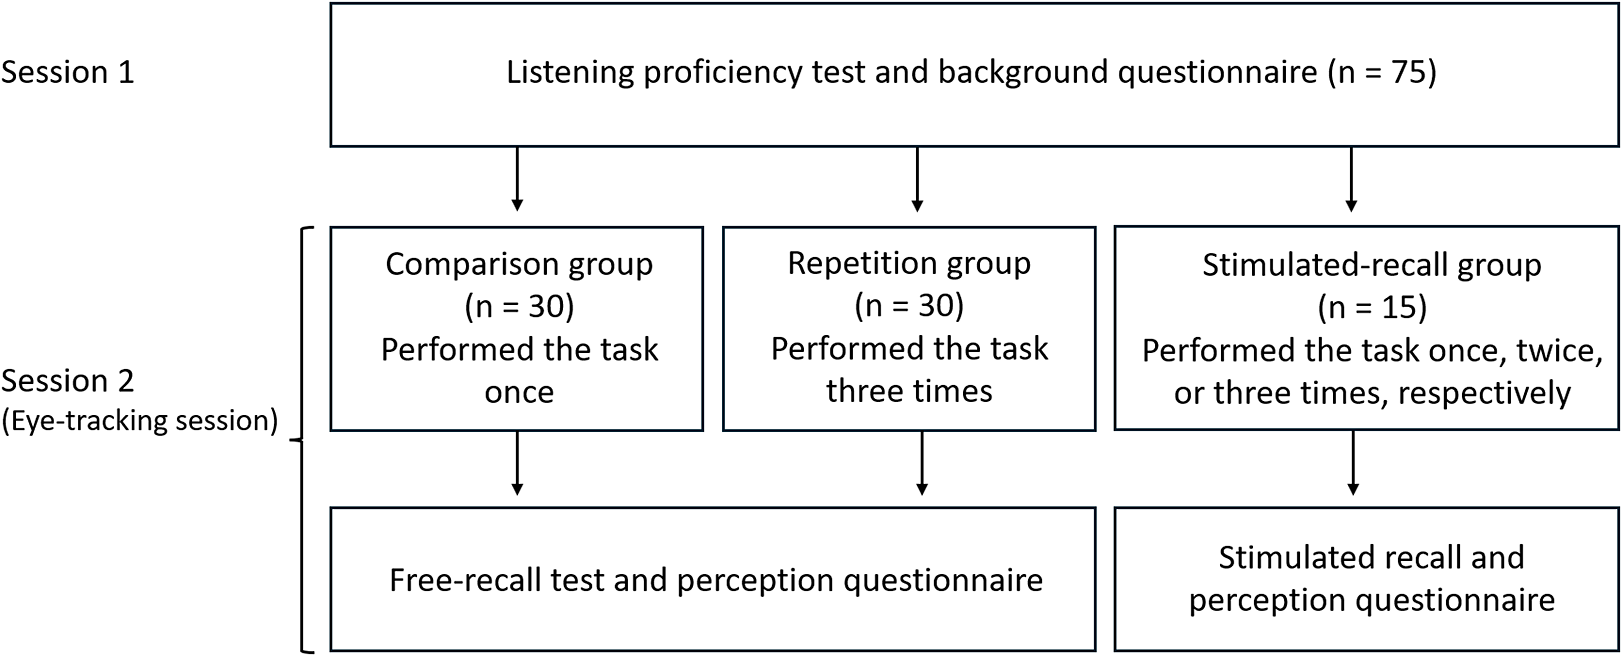
The dataset for the present study is part of a larger project investigating the impact of task repetition on the processing and acquisition of technical vocabulary (Shi et al., Reference Shi, Révész and Pellicer-Sánchez2024) and the role of cognitive individual differences in L2 learning (Shi et al., Reference Shi, Révész and Pellicer-Sánchez2025). In the present report, we only share aspects of the design relevant to the research questions investigated here. The overall research design is presented in Figure 1. The participants were 75 Chinese L2 users of English, who were assigned to a comparison (n = 30), a repetition (n = 30), and a stimulated-recall (n = 15) group using stratified random assignment based on their performance in the listening section of a Cambridge Certificate in Advanced English (CAE) test. Following previous studies of task repetition (e.g., Gass et al., Reference Gass, Mackey, Alvarez-Torres and Fernández-García1999), we operationalized task repetition as performing the same task three times. Accordingly, the comparison group performed a video-lecture-based task once, whereas the repetition group completed it three times. Before viewing the lecture, both groups were informed about an upcoming free-recall test. Each group completed the free-recall test only once after their respective treatment, followed by a perception questionnaire. The stimulated-recall participants were further divided, randomly, into three subgroups and performed the task once (Group 1, n = 5), twice (Group 2, n = 5), or three times (Group 3, n = 5), respectively. They were then asked to describe their thought processes during their last task performance. All participants’ visual attention to the lecture components was captured using an eye tracker during each viewing.
Visual diagram of the research design.

Figure 1. Long description
The flowchart is organized into two main horizontal tiers representing the study sessions.
Session 1: A single wide box at the top indicates that all participants (n = 75) completed a Listening proficiency test and background questionnaire. Three downward-pointing arrows lead to the next tier.
Session 2 (Eye-tracking session): This tier is divided into three distinct experimental groups.
1. Comparison group (n = 30): Performed the task once. An arrow points down to a box for a Free-recall test and perception questionnaire.
2. Repetition group (n = 30): Performed the task three times. An arrow points down to the same Free-recall test and perception questionnaire box shared with the comparison group.
3. Stimulated-recall group (n = 15): Performed the task once, twice, or three times, respectively. An arrow points down to a separate box for Stimulated recall and perception questionnaire.
Participants
Ninety participants were initially recruited for the study, but four were excluded because their listening proficiency fell outside the B2 band, the minimum level set for the study according to the Common European Framework of Reference (CEFR). Additionally, two participants had to withdraw due to difficulties in tracking their eyes, while data from three others were removed because of poor eye-movement data quality. Data from another six participants were also discarded as they reported being familiar with the lecture content in the perception questionnaire. The remaining 75 participants were Chinese L2 English postgraduate students at a UK university enrolled in social science programs. The mean age was 23.84 (SD = 2.21), and the majority were female (n = 71). The comparison, repetition, and stimulated-recall groups had similar listening proficiency, with most participants scoring within the B2 and C1 bands and the remainder within the C2 band. A one-way between-groups ANOVA found no significant difference among the three groups on the listening test scores, F(2, 72) = 0.41, p = .96, η2 < .001 (see Appendix S1 in the online Supporting Information for descriptive statistics for the CAE test scores).
Video-lecture-based task
The video-lecture-based task asked participants to watch a video-recorded lecture while taking notes for a friend (see Appendix S2 in the online Supporting Information for the task instructions). The lecture consisted of three authentic short videos taken from an introductory neurobiology course on the Coursera platform. Each video featured a first language (L1) English speaker presenting in front of a whiteboard displaying hand-drawn diagrams, and the first two videos had decorative objects placed beside the whiteboard (see Figure 2). The diagram included both visual pictorial (i.e., diagram illustrations) and written information (i.e., keyword annotations) that were semantically relevant to the instructor’s spoken input. Specifically, in the first video, the instructor introduced the basic parts of a neuron, and participants were presented with a labeled diagram identifying each part. The instructor discussed the functions of brain membranes and the differences between the central and peripheral nervous systems in the second video. Participants could see an illustration of three membranes enclosing the brain and separating the two systems, with labels identifying each element. The last video introduced two types of photoreceptor cells in the human eye (rods and cones). The structure of photoreceptor cells, along with their preferred illumination, was illustrated and labeled. We did not observe any notable differences in the quantity and quality of diagram illustrations and keyword annotations across the videos.
An example of a still image from the first video.

The 3 videos were of approximately equal length (6 minutes), with each including an average of 770 running words, resulting in a speech rate of approximately 128 words per minute. We conducted an analysis of the lexical profiles of the videos using the British National Corpus (BNC Consortium, 2007) as the reference. The analysis revealed that knowledge of the first 3,000 most frequent word families provided a lexical coverage of 93%, 88%, and 94%, respectively. Given that participants had listening proficiency in the B2 to C2 CEFR bands, they were not expected to experience major difficulty comprehending the lecture content, which was confirmed by the results of the free-recall test. We chose these videos because participants probably had limited familiarity with the topics due to their educational background but might still find them engaging, given their relevance to many social science applications. Considering that each video was relatively short, we combined the three videos into a single lecture to provide more information across multiple modalities. The videos were semantically connected and progressively built upon one another: the first video introduced the neuron, the basic unit of the nervous system; the second explained how the meninges protect the nervous system; and the third narrowed the topic to a type of specialized neuron involved in vision.
Free-recall test
The free-recall test asked participants to leave a voice message for a friend who missed the lecture, providing as much detail as possible about the lecture content (for the full test instructions, see Appendix S3 in the online Supporting Information). We included this test to measure participants’ lecture comprehension. In addition, it helped create a communicative context that reflected real-life academic listening and reporting practices of the students. Participants could use Mandarin, English, or both, to ensure that their language proficiency did not prevent them from accurately describing what they recalled from the lecture content.
Questionnaires
A background questionnaire was administered to collect data on the participants’ demographics and language learning experience. A perception questionnaire was also used, among other things, to assess participants’ perceived topic familiarity (see Appendix S4 in the online Supporting Information for the questionnaires). Participants were asked to indicate their familiarity with the lecture topic on a 5-point scale (1 = I strongly disagree that the topic of the lecture was familiar; 5 = I strongly agree that the topic of the lecture was familiar). We excluded data collected from participants who had rated their topic familiarity as 4 or 5 on the scale. Among the remaining participants, the mean topic familiarity was 1.65 (SD = 0.80, 95% CI [1.44, 1.86]). Results from an independent samples t-test found no significant difference in topic familiarity between the comparison and the repetition group, t(58) = 0.19, p = .85, d = 0.05.
Data collection procedures
While the larger project took longer, the two sessions relevant to the present study took place over two weeks. In the first session, participants signed an informed consent form and completed the CAE listening test and the background questionnaire. The second, eye-tracking session took place at a language laboratory, where participants watched the lecture and took notes while their eye movements were recorded by an EyeLink 1000 Plus eye tracker (for a description of the eye-tracking procedures, see Appendix S5 in the online Supporting Information). Next, both the comparison and repetition groups completed the free-recall test and the perception questionnaire. The stimulated-recall participants, in contrast, watched a replay of their eye-movement recording during their (last) viewing. They were asked to pause the recording at any time they wanted to share what they were thinking while completing the task. The researcher would additionally pause the recording every 30 seconds and prompt the participants to recall their thoughts during viewing. General questions were asked, such as “What were you thinking when you were watching this part?” All stimulated-recall sessions were carried out in Mandarin to ensure an accurate description of participants’ memory of their thought processes, but participants were also allowed to use English.
The stimulated-recall participants did not complete the free-recall test prior to their stimulated-recall session to prevent any veridicality issues (Gass & Mackey, Reference Gass and Mackey2016). Neither did they engage in the free recall after the stimulated recall, given that recalling their thoughts while watching the lecture provided additional learning opportunities that would have inflated the free-recall scores. However, the stimulated-recall participants completed the perception questionnaire at the end of the experimental session, which confirmed that they had little prior knowledge of the lecture topic.
Data coding and analyses
Free-recall test
We first segmented the video transcripts into idea units following Carrell’s (Reference Carrell1985) operational idea-unit definition (see Appendix S6 in the online Supporting Information). The initial analysis identified 437 idea units across the three video transcripts. After excluding units containing disfluency features (e.g., false starts) and irrelevant content (e.g., video openings and closings), we were left with 338 idea units (75, 131, and 132 units for each video). This number was used to determine the maximum test score. Next, the recalls were transcribed, checked, and coded for idea units after removing disfluencies and irrelevant content. All participants used English, except two who recalled in Mandarin. To ensure consistency in measuring participants’ recall performance, we excluded their data from the analysis. The free-recall test was scored in a binary fashion, with a correctly recalled idea unit getting 1 point and an omitted and incorrectly recalled idea unit (e.g., misinterpretation and distortion) getting 0. The incorrectly recalled idea units were also counted separately. A second researcher, a PhD student in applied linguistics, coded 20% of the data, with 10% randomly selected from each group. Inter-coder reliability was found to be high (Cohen’s kappa = .89).
Stimulated-recall data
Drawing on previous research on L2 listening processing and multimedia learning, we constructed a coding scheme for multimodal comprehension (the full coding scheme and examples for each category are presented in Appendix S7 in the Supporting Information online). The scheme included five components: listening, reading, and visual picture comprehension; listening strategies; and integration of information. Based on Field (Reference Field, Taylor and Weir2013), listening comprehension was subdivided into lower-level (input decoding, word recognition, and parsing) and higher-level processes (meaning and discourse construction). Following Schnotz (Reference Schnotz and Mayer2014), visual picture comprehension subsumed visual feature analysis and depictive processing, but reading comprehension only involved graphemic input analysis, as the video lectures did not contain written textual units larger than individual words. To capture strategy use, the coding scheme was based on Vandergrift and Goh’s (Reference Vandergrift and Goh2012) taxonomy of cognitive, metacognitive, and affective listening strategies, but a few alterations were made to fit the study design. Two strategies, cooperation and using external learning resources, were removed, as they were not relevant to the experimental task. We added, however, avoidance as a major compensation strategy (Field, Reference Field2008; Rost, Reference Rost2011) and two subcategories for inferencing, linguistic and kinesic inferencing, to capture learners’ use of social cues to aid comprehension. Finally, integration of information included the categories of surface structure and semantic deep processing (Schnotz & Wagner, Reference Schnotz and Wagner2018). The resulting coding scheme was further extended once coding began: two major codes, note viewing and processing of social cues, emerged from the data; and task-specific strategies emerged as a subcode of listening strategies.
The stimulated-recall analysis started with transcribing the data in the language used by the participants (Mandarin with occasional English use). The coding was conducted based on the Mandarin transcriptions to avoid data loss from translation using NVivo 12 software. A comment was defined as a recall made when participants paused the recording or were prompted to describe their thoughts. Comments were further segmented into chunks based on our coding scheme, with each chunk assigned a single code (see Appendix S8 in the online Supporting Information for an example). Next, we calculated frequency counts for each code. Twenty percent of the data, selected through stratified random sampling across the three groups, were coded by a second researcher, a doctoral student in applied linguistics. Inter-coder reliability was found to be high (Cohen’s kappa = .81).
Eye-movement data
The eye-tracking data were analyzed with the EyeLink Data Viewer software. We started with data cleaning following recommendations in previous research (Godfroid, Reference Godfroid2020). We then created dynamic areas of interest (AOIs) for the instructor and diagrams. Dynamic AOIs consisted of a series of instances, each of which was a static AOI drawn around the two visual stimuli with a specific onset and offset time. This allowed dynamic AOIs to change in position, size, and shape over time during an experimental trial to capture learners’ visual attention to moving elements (see Figure 3). We excluded parts that were not directly related to the lecture content from the analysis, including video openings (e.g., still images presenting course information), closings (e.g., previews of the next video), and a two-minute warm-up at the beginning of the first video, which aimed to familiarize learners with the topic and prepare them for the main instructional content. This resulted in interest periods of 196, 318, and 380 seconds for the three videos, respectively. During these periods, the instructor AOI included 642, 1,022, and 1,631 instances, and the diagram AOI comprised 605, 1,164, and 1,053 instances, respectively.
Examples of AOI instances from the three videos (enclosed in yellow and green irregular shapes).

Figure 3. Long description
A multi-panel figure consisting of three vertical frames from educational videos. Each frame features a female lecturer standing in front of a whiteboard with hand-drawn neurobiology diagrams.
* Top Panel: The lecturer is centered, outlined by an orange A O I. Behind her, a large green A O I encloses a diagram of a neuron with labels including arbor, axon, synaptic terminal, and cell or dendrite.
* Middle Panel: The lecturer is on the left, outlined in orange. A green A O I on the right encloses a diagram comparing the C N S and P N S, with labels for meninges, sensory neurons, voluntary muscle, and autonomic neurons.
* Bottom Panel: The lecturer is on the right in a red sweater, outlined in orange. A green A O I on the left encloses diagrams of rod and cone cells with a light source arrow, and a table at the top right comparing scotopic, mesopic, and photopic vision conditions.
In all panels, green outlines represent the whiteboard content A O I, while orange outlines represent the lecturer A O I.
To examine learners’ visual attention to the instructor and labeled diagrams (RQ1), three eye-movement measures were extracted for each AOI, including total fixation duration (the sum of all fixation durations on an AOI), mean fixation duration (the total fixation duration divided by the total number of fixations), and percentage of fixation duration (the percentage of the sum of all fixation durations within an AOI). Additionally, we extracted integrative saccades, defined as the number of integrative transitions between the instructor and diagram AOIs. We selected total fixation duration as it provides an overall picture of participants’ attention allocation (Godfroid, Reference Godfroid2020), mean fixation duration as it reflects how attention unfolds over time, and percentages of fixation duration to assess attention distribution across AOIs (Pellicer-Sánchez et al., Reference Pellicer-Sánchez, Conklin, Rodgers and Parente2021). In addition, integrative saccades have been argued to be indicative of integration of information (e.g., Scheiter & Eitel, Reference Scheiter, Eitel, Was, Sansost and Morris2017). The instructor AOI provided kinesic signals that might facilitate understanding of the input, while the diagram AOI offered exophoric visual representations of the lecture concepts. We assumed that, when learners shifted their gaze between these two types of AOIs, they engaged in synthesizing the auditory, visual pictorial, and/or kinesic information.
To explore how task repetition may influence the relationship between input processing and comprehension (RQ2), we calculated cumulative fixation duration (the sum of all fixation durations on an AOI during the entire treatment) for the repetition group. All fixation duration metrics were log-transformed to meet statistical assumptions for further analyses. Pearson intercorrelations for the eye-movement measures are presented in Appendix S9 in the online Supporting Information.
Statistical analyses
The statistical analyses were conducted with the R software (R version 4.1.1). To address RQ1, we used growth curve analysis to examine how participants’ eye movements toward the instructor and diagram AOIs changed across the three exposures to the lecture. We constructed a series of linear mixed-effects models with the lme4 package, including a linear term (Exposure1) and a higher-order quadratic term of Exposure (Exposure2, i.e., Exposure1 ^ 2) as fixed effects. To address the problem of collinearity, we orthogonalized polynomial term (Exposure2) using the stats package, so that it was uncorrelated with the linear term after transformation. The dependent variables were the eye-movement metrics, including total fixation duration, mean fixation duration, and percentage of fixation duration (each extracted from the two AOIs), along with integrative saccades between the two AOIs. Participant and video were included as the random effects. For learners’ conscious attention to the lecture content, we calculated frequency counts for each code under the different repetition conditions (performing the task once, twice, or three times).
To answer RQ2, we constructed linear mixed-effects models to examine the relationship between participants’ visual attention to the instructor/diagram AOIs and their free-recall test scores. Visual attention was captured by the comparison group’s total fixation duration on the AOIs and the repetition group’s cumulative fixation duration across the three exposures on the same AOIs. The independent variables in the models were total/cumulative fixation duration, group (comparison vs. repetition), and the interaction between group and the fixation duration measure. The continuous eye-tracking indices were centered to facilitate convergence and reduce multicollinearity. The number of correctly recalled idea units was the dependent variable, while participant and video served as the random effects. Participants’ CAE scores were included as a covariate in all models to control for the potential confounding influence of English proficiency levels and were retained only when they significantly improved model fit.
We applied the Bonferroni correction to control for the increased risk of Type I errors, adjusting the alpha level to .006 by dividing the conventional threshold of .05 by the number of statistical tests (n = 9). Effect sizes for fixed effects (marginal R2) and random plus fixed effects (conditional R2) were obtained using the MuMln package. Following Plonsky and Ghanbar (Reference Plonsky and Ghanbar2018), R2 values ≤ .20 were considered indicative of a small effect size, while values ≥ .50 indicated a large effect size. See Appendix S10 in the Supporting Information online for results of model diagnostics.
Results
Lecture comprehension
Across the three videos, the comparison group recalled a mean of 56.83 correct idea units (SD = 26.15, 95% CI [46.88, 66.77]), and the repetition group an average of 102.76 correct idea units (SD = 34.92, 95% CI [89.47, 116.04]). Results from an independent samples t-test showed that the repetition group recalled significantly more correct idea units than the comparison group, t(56) = −5.67, p < .001, d = −1.49.
RQ1: Processing of multimodal input during repeated viewing
Eye-tracking results
Table 1 presents the descriptive statistics for the repetition group’s eye-movement indices. To analyze participants’ viewing behavior across the three repetitions, we carried out growth curve analysis. As shown in Table 2, the model revealed that total and mean fixation durations on the instructor AOI did not significantly differ across the three repetitions. However, there was a significant linear effect of Exposure on the percentage of fixation duration on the instructor AOI, with a steady increase in the proportion of attention allocated to the instructor across the three repetitions (R2m = .01, R2c = .88; illustrated in Figure 4a).
Descriptive statistics for the repetition group’s eye-movement measures across the three repetitions

Table 1. Long description
The table is organized by A O I (Area of Interest), Eye-movement measure, and three time intervals (Time 1, Time 2, Time 3). Each time interval includes Mean (M), Standard Deviation (S D), and 95% C I (Confidence Interval) with Lower and Upper bounds.
* Instructor A O I:
- Total fixation duration: Increases from Time 1 (M = 148315, S D = 55857) to Time 3 (M = 163929, S D = 71100).
- Mean fixation duration: Increases from Time 1 (M = 280.68) to Time 3 (M = 322.87).
- Percentage of fixation duration: Increases from Time 1 (M = 0.15) to Time 3 (M = 0.44).
* Diagram A O I:
- Total fixation duration: Decreases from Time 1 (M = 205616, S D = 44313) to Time 3 (M = 157165, S D = 60906).
- Mean fixation duration: Remains relatively stable (Time 1 M = 255.91; Time 3 M = 253.06).
- Percentage of fixation duration: Decreases from Time 1 (M = 0.41) to Time 3 (M = 0.34).
* Instructor and Diagram A O I:
- Number of integrative saccades: Fluctuates from Time 1 (M = 378.76) to Time 2 (M = 331.45) and Time 3 (M = 349.90).
Note: Total and mean fixation durations are measured in milliseconds.
Note: Total and mean fixation durations are in milliseconds.
Growth curve analysis results for the repetition group’s eye-movement measures

Table 2. Long description
The table is organized into columns: A O I, Eye-movement measure, b, 95% C I (Lower and Upper), S E, t, and p.
1. Instructor A O I:
- Total fixation duration: Exposure sub 1 (b = 0.21, p = .80); Exposure sub 2 (b = 0.94, p = .008).
- Mean fixation duration: Exposure sub 1 (b = -0.11, p = .76); Exposure sub 2 (b = -0.23, p = .51).
- Percentage of fixation duration: Exposure sub 1 (b = 0.32, p = .001); Exposure sub 2 (b = -0.06, p = .31).
2. Diagram A O I:
- Total fixation duration: Exposure sub 1 (b = -2.20, p = .001); Exposure sub 2 (b = 1.09, p < .001).
- Mean fixation duration: Exposure sub 1 (b = -0.09, p = .33); Exposure sub 2 (b = 0.24, p = .01).
- Percentage of fixation duration: Exposure sub 1 (b = -0.48, p < .001); Exposure sub 2 (b = 0.10, p = .16).
3. Instructor and diagram A O I:
- Number of integrative saccades: Exposure sub 1 (b = -56.13, p = .31); Exposure sub 2 (b = 83.55, p = .001).
Significant effects of task repetition on eye-movement measures.

Figure 4. Long description
A multi-panel figure with four line graphs, each featuring a blue trend line surrounded by a light blue shaded confidence interval. The x-axis for all panels is Repetition, ranging from 0.0 to 2.0, with rug plots indicating data density at 0.0, 1.0, and 2.0.
* Top-left, Figure 4a: Percentage of fixation duration on the instructor A O I. The y-axis is Proportion of fixation duration from 0.1 to 0.5. The trend shows a slight linear increase from approximately 0.28 to 0.33.
* Top-right, Figure 4b: Log-transformed total fixation duration on the diagram A O I. The y-axis ranges from 10.4 to 11.4. The trend shows a curved decrease from 11.1 at repetition 0.0, leveling off around 10.7 at repetition 2.0.
* Bottom-left, Figure 4c: Percentage of fixation duration on the diagram A O I. The y-axis is Proportion of fixation duration from 0.30 to 0.45. The trend shows a steady decrease from 0.42 to 0.34.
* Bottom-right, Figure 4d: Number of integrative saccades between the instructor and diagram A O Is. The y-axis ranges from 60 to 180. The trend shows a shallow U-shaped curve, starting at 125, dipping slightly near repetition 1.0, and ending near 118.
For the diagram AOI, the results showed a significant effect of both the linear and quadratic terms of Exposure on total fixation duration, indicating a steep initial decline in total fixation duration, which slowed down as repetition progressed (R2m = .08, R2c = .80; Figure 4b). While no significant effect was found for mean fixation duration, there was a significant linear decrease in the percentage of fixation duration, showing that participants allocated progressively less relative attention to the diagram over the three repetitions (R2m = .07, R2c = .60; Figure 4c). Additionally, the model for integrative saccades found a significant quadratic effect of Exposure, with a small decrease in saccades between the instructor and diagram AOIs at Time 2, followed by a slight increase at Time 3 (R2m = .01, R2c = .84; Figure 4d). The models are summarized in Appendix S11 in the online Supporting Information.
Stimulated-recall interview results
In total, the 15 stimulated-recall participants made 544 comments, which were segmented into 657 chunks based on the coding scheme, with each chunk assigned a single code. The number of chunks counted for each category is presented in Appendix S12 in the online Supporting Information. Participants who performed the task once (Group 1) and twice (Group 2) made more comments than those who performed the task three times (Group 3). A large proportion of comments related to listening comprehension, with Group 1 reporting listening processes more frequently than Groups 2 and 3. While the three groups reported a relatively similar proportion of lower-level listening processes, Group 1 made more comments about higher-level listening processes. Regarding reading comprehension, Group 2 mentioned reading diagram labels slightly more often than the other two groups. There was no notable difference across the three groups in terms of reference to visual picture comprehension. Comments about integrating information from different modalities were made more often by Groups 1 and 3 than Group 2. Moving on to strategy use, Groups 2 and 3 reported notably greater reliance on listening strategies than Group 1. Additionally, unlike Group 1, both Groups 2 and 3 reported reading their notes, and Group 3 more frequently mentioned paying conscious attention to the instructor’s social cues as compared to Groups 1 and 2.
RQ2: Effects of task repetition on the relationship between processing and comprehension
To capture the impact of task repetition on the link between processing and comprehension, the descriptive statistics summarizing the total/cumulative fixation durations for the comparison and repetition groups are presented in Appendix S13 online. As shown in Table 3, we found significant main effects of both group and fixation duration within the instructor AOI on participants’ free-recall scores, with the repetition group recalling significantly more correct idea units than the comparison group, and longer fixation duration associated with fewer correct idea units (R2m = .32, R2c = .84). A negative relationship was also observed between the fixation duration on the diagram AOI and participants’ free-recall scores (R2m = .33, R2c = .90), although this relationship was not statistically significant at p < .006. There was no interaction effect between group and the fixation duration indices. For model summaries, see Appendix S14 in the online Supporting Information.
Relationship between visual attention to lecture content and free-recall performance

Table 3. Long description
The table is divided into two sections based on the Area of Interest (A O I).
Section 1: Number of correct idea units—Fixation duration on the instructor A O I.
* Group: b = 21.93, 95% C I = 15.53 to 27.70, S E = 2.99, t = 7.33, p < .001.
* Fixation duration: b = -6.47, 95% C I = -10.31 to -2.37, S E = 1.92, t = -3.36, p = .001.
* Group times Fixation duration: b = 4.17, 95% C I = 0.39 to 7.96, S E = 1.93, t = 2.17, p = .03.
Section 2: Number of correct idea units—Fixation duration on the diagram A O I.
* Group: b = 21.57, 95% C I = 14.77 to 27.74, S E = 3.22, t = 6.69, p < .001.
* Fixation duration: b = -8.90, 95% C I = -15.46 to -2.17, S E = 3.31, t = -2.69, p = .009.
* Group times Fixation duration: b = 5.16, 95% C I = -2.46 to 12.80, S E = 3.89, t = 1.33, p = .19.
Discussion
Task repetition and visual attention to lecture content
The first research question explored the effects of task repetition on learners’ visual attention to the instructor and diagrams. We hypothesized that task repetition would lead to increased visual attention to the instructor and decreased visual attention to the diagrams, assuming that participants would focus on the diagrams initially as an aid to their comprehension (Suvorov, Reference Suvorov, Wagner and Ockey2018) but shift their attention to the speaker once they had become familiar with the diagrams (Batty, Reference Batty2020). For visual attention to the instructor, the results confirmed our hypothesis. The growth curve analysis found a gradual increase in the percentage of fixation duration on the instructor AOI across the three repetitions, with a small effect size.
Drawing on Mayer’s (Reference Mayer and Mayer2014a) cognitive theory of multimedia learning, a possible explanation for this pattern might be that, during the first viewing, participants paid a sufficient amount of visual attention to the instructor for social cues to aid auditory processing. During the subsequent viewings, increased content familiarity might have allowed learners to look at the instructor’s facial expressions and gestures (e.g., Gullberg & Holmqvist, Reference Gullberg and Holmqvist2006). Additionally, learners might have focused less on the instructor during the initial viewing because they were likely taking notes, and once they had recorded the information that they considered important, they could direct more attention to the instructor. This interpretation is further supported by the stimulated-recall comments, showing that participants who performed the task three times tended to look at the instructor as the subject of the communication (Mayer, Reference Mayer and Mayer2014b; Mayer et al., Reference Mayer, Sobko and Mautone2003) during their final viewing. For example, one participant described their viewing pattern, stating, “I had already listened to this part twice, so I knew what she was talking about. I was naturally looking at her face while listening.” Another participant reported, “I followed wherever she pointed, and if she looked at me, I could not help but focus on her face.”
For the diagram AOI, our findings were also consistent with what we predicted. Participants’ total fixation duration in the second and third viewings was lower than in the initial viewing. Additionally, the percentage of fixation duration decreased steadily across the three repetitions. However, the effect sizes for learners’ visual attention to the diagram AOI were not robust. Probably, one reason why learners paid much visual attention to the diagrams initially was that the written labels helped them with speech segmentation; and the illustrations, due to their explanatory nature, assisted with comprehending important information. The diagrams, however, might have become less helpful during subsequent viewings, considering that the aural commentaries provided more clearly defined semantic content and were therefore perceived as more useful for the systematic construction of knowledge (Schnotz & Wagner, Reference Schnotz and Wagner2018).
Another possible or additional explanation may be that more visual attention allocated to diagrams, as suggested in previous research (Jacob & Karn, Reference Jacob, Karn, Hyönä, Radach and Deubel2003), indicated difficulty in extracting information. Participants might have focused more on the diagrams in the beginning as they contained both verbal and pictorial information illustrating unfamiliar knowledge, which likely required more time to process. The gradually decreasing percentage of fixation duration in the subsequent viewings might reflect participants’ increased familiarity with the diagrams, regardless of whether or not they successfully understood the information presented.
Finally, the note-taking aspect of the task might have also contributed to the patterns observed. Participants possibly paid increased attention to the diagrams in the first viewing as they felt the need to replicate the diagrams in their notes. The notes participants had taken earlier, in turn, served as physical records of the lecture content (Di Vesta & Gray, Reference Di Vesta and Gray1973), alleviating the necessity for allocating further visual attention to the on-screen diagrams. This is aligned with findings from the stimulated-recall comments, showing that 5 out of 10 participants who repeated the task reported reading their notes, while three mentioned reorganizing their notes during subsequent viewing(s). For example, a participant who completed the task three times described their viewing behavior as follows: “I glanced at the diagram a couple of times, and that was it. Because I was already familiar with the diagram, I reviewed my notes to check if I had missed anything and did not feel the need to look at the screen anymore.” Another participant under the same condition stated, “My eyes were off the screen. I was just checking if what I wrote was accurate and trying to organize the ideas she was explaining.”
Altogether, learners’ attention to the visual components of the lecture appeared to be largely influenced by their note-taking behavior. Given the limited capacity of the visual channel, learners could not simultaneously attend to the instructor’s social cues, diagrams, and their notes. When they focused on the instructor or the diagrams, they were unlikely to take notes, whereas when their attention was directed away from the screen, they were probably occupied with taking, organizing, or reading their notes. This dynamic reflected learners’ strategic adjustments of listening/viewing processes to optimize comprehension, which might have shaped their attention to the visual stimuli. However, given that we did not directly capture learners’ visual attention to their notes, this interpretation remains tentative.
The growth curve analysis also uncovered an initial decline in the number of integrative saccades between the instructor and diagram AOIs, followed by an increase from the second to the third viewing. Simply put, participants switched between looking at the instructor and diagrams less during the second than the first viewing, but more during the third than the second viewing. Previous L2 research (e.g., Pellicer-Sánchez et al., Reference Pellicer-Sánchez, Conklin, Rodgers and Parente2021) has interpreted frequent transitions between texts and pictures as indicative of learners’ integration processes. In line with this reasoning, the high occurrence of switching between the instructor and diagrams during the first viewing might have reflected learners’ efforts to connect auditory (aural commentaries) and visual information (labeled diagrams), given that the instructor was the carrier of auditory information. This step, namely, coordinating multimedia elements, is key in multimodal comprehension (Mayer, Reference Mayer and Mayer2014a) but may place high cognitive demands on learners, resulting in reduced attentional resources available to process specific linguistic and pictorial information.
The opportunity for a second viewing might have allowed learners to focus on specific bits of information after having familiarized themselves with the content during the initial performance. The stimulated-recall comments provide support for this interpretation, revealing that 3 out of 5 participants in Group 2 made a total of 15 comments on integrating information from different input sources, compared to 34 comments made by all 5 participants in Group 1 and 24 comments made by all participants in Group 3. Meanwhile, Group 2 reported notably more about using the strategies of focusing attention (4 participants made 9 comments, e.g., focusing on listening to what they did not understand during the first viewing) and monitoring (5 participants made 22 comments, e.g., consciously checking and verifying information for consistency with what had been processed previously). These strategies were used less frequently than in Group 1 (0 and 1 comments for focusing attention and monitoring, respectively) and Group 2 (1 comment for each strategy).
As discussed above, one possible interpretation for the rise in integrative saccades between the second and third viewing is that learners might have achieved at least a moderate level of familiarity with the lecture content, enabling them to pay relatively more attention to the instructor’s social cues, including nonverbal signals directing their attention to the on-screen content, during the third viewing. Indeed, according to the stimulated-recall data, 3 out of 5 participants in Group 3 made 15 references to attending to the instructor’s pointing gestures and eye gaze toward the diagrams, while 3 participants in Group 2 made a total of 5 relevant comments. A quote from one of the participants who did the task three times illustrates this pattern: “I was looking at where she was pointing. She pointed at this ‘cell body’, so I looked at the ‘cell body’.”
Additionally, the stimulated-recall comments revealed that all participants reported L2 listening processes, which accounted for the majority of the comments, with Group 1 mentioning a higher proportion of higher-level processes (39.74%, i.e., meaning and discourse construction) compared to Groups 2 (21.85%) and 3 (24.74%). Interestingly, these findings contradict those of previous studies (Field, Reference Field2015; Holzknecht, Reference Holzknecht2019), which found that double play elicited more reference to higher-level processes than single play. This discrepancy, however, might provide further insights into the pattern observed in the eye-movement data regarding the integration of information. Specifically, in Field’s (Reference Field2015) and Holzknecht’s (Reference Holzknecht2019) research, participants were asked to complete multiple-choice and gap-filling questions that required listening for specific details. In contrast, the participants in the current study were going to leave a voice message to a friend, which might have prompted them to engage more in meaning-building processes during the initial viewing, utilizing all available information to grasp the gist of the lecture. A second viewing might have shifted their attention to details they had initially missed or sought to confirm for accuracy, as discussed earlier. One participant in Group 2 commented: “When she mentioned the specific example, I was paying close attention to how she described it. For example, I did not catch the name of the disease during the first viewing, so I was trying to memorize it. I felt that just saying ‘disease’ was too vague. If I were to repeat this to someone else, I would not have enough detail or accuracy.” During the third viewing, familiarity with the content likely led participants to engage in similar higher-level processes as the second viewing, while naturally attending to the instructor and diagrams that she directed their attention to through gestures and eye gaze.
Relationship between attention allocation and comprehension
The second research question investigated how task repetition affected the relationship between learners’ visual attention to the instructor and diagrams and their lecture comprehension, and we formed a non-directional hypothesis. The results demonstrated that participants who paid more visual attention to the instructor achieved lower comprehension scores across the two groups, and the effect size for the relationship was medium. One possible interpretation is that, while the instructor’s social cues might potentially direct learners’ attention to important visual information and aid comprehension, as previously discussed, excessive attention to the instructor might have left participants with few cognitive resources for effectively processing other content-related information (Colliot & Jamet, Reference Colliot and Jamet2018), as well as for taking and synthesizing notes. Consequently, learners might have struggled on the free-recall test, which, to a large extent, assessed surface-level memory, such as the recall of specific words and phrases (van Dijk & Kintsch, Reference van Dijk and Kintsch1983). If learners did not record essential information due to their attention being directed elsewhere during viewing, their performance would have largely depended on their working memory capacity as well as their comprehension ability. Additionally, note-taking skills might have further influenced their performance (e.g., Dunkel, Reference Dunkel1988). This complex interaction between attention, note-taking, and memory might therefore help explain the observed negative relationship between visual attention and comprehension.
We also observed a weak but non-significant relationship between fixation duration on the diagram and comprehension (p = .009), which might be attributed to the relatively small sample size in the current study and cannot be generalized beyond the current dataset.
Limitations and future research directions
Before we conclude, it is important to acknowledge the limitations of this study and consider directions for future research. The first limitation pertains to the announcement of the free-recall test prior to lecture viewing, which might have affected participants’ cognitive processes and strategy use during viewing (Nguyen & Boers, Reference Nguyen and Boers2018). A related limitation concerns the impact of note-taking on the eye-movement data, probably leading to less time spent viewing the screen. To address these issues, further research is needed to establish whether the findings obtained here may generalize to video-mediated activities that solely involve viewing. Another limitation concerns the use of the free-recall test to measure learners’ lecture comprehension, given its reliance on participants’ decisions about how much to recall, although the instructions encouraged them to provide as much information as possible.
Furthermore, following previous research (e.g., Bisson et al., Reference Bisson, Van Heuven, Conklin and Tunney2014), the dynamic AOIs created for the areas around the instructor and diagrams were slightly larger than the exact borders to absorb a small amount of drift, which might have compromised data accuracy. Another limitation is that diagram illustrations and written labels were included in one dynamic AOI despite being different visual types. Creating separate AOIs was impractical due to their close proximity, making our interpretations of how learners integrated auditory, pictorial, and written information more tentative. The absence of an AOI for other context-related information (background objects) is an additional weakness of this study.
Finally, the use of stimulated-recall interviews also has its inherent limitations. When reporting their repeated task performance, participants might have accidentally recalled processes that occurred in an earlier performance. The study would also have benefited from more stimulated-recall participants, as the small sample size might have introduced greater individual variations. This limitation could potentially affect the validity of comparisons across conditions and the generalizability of the findings. Considering the limitations above, we position this work as an exploratory study. Besides addressing these limitations, it would be interesting in future research to compare the effects of distributed and massed repetitions on learners’ processing of L2 multimodal input. Future research could also explore the role of navigational controls (e.g., pause/play, rewind, and fast forward) and interactive elements (e.g., quizzes during video-based lectures) in processing and learning from multimodal academic materials. In our future research, we plan to investigate the effect of task repetition on learners’ note-taking behavior and how the quantity and quality of notes, in turn, relate to lecture comprehension, with a view to providing additional insights into L2 multimodal processing.
Conclusion
The current study aimed to explore how learners process L2 multimodal input during repeated performance of video-lecture-based tasks. Through triangulating eye-tracking with stimulated-recall data, we found an increase in learners’ visual attention to the instructor, a decline in their attention to the diagrams, and a U-shaped trend in the number of integrative saccades between the instructor and diagrams across the three repetitions. We also observed a negative relationship between learners’ visual attention to the instructor and lecture comprehension. Taken together, these findings suggest that learners tended to focus on filling gaps in their comprehension by attending more closely to the parts they had missed in the first viewing, and so engaged in less integration of information and switching between the instructor and diagrams. By the third viewing, after becoming more familiar with the content, learners’ attention naturally shifted toward the instructor’s social cues. Excessive attention to the instructor, however, might hinder comprehension by reducing the cognitive resources required for note-taking and content processing. Overall, our findings underscore the important role of task design in shaping learners’ L2 multimodal processes and the pedagogical value of task repetition in facilitating differential practice of L2 multimodal processing skills. Another pedagogical implication of the current study is that the design of instructional materials should minimize unnecessary visual distractions to focus learners’ attention on important information.
Supplementary material
The supplementary material for this article can be found at http://doi.org/10.1017/S0272263125101460.
Acknowledgments
This study was funded by the Language Learning Dissertation Grant Program. We would like to thank the three anonymous reviewers and Handling Editor, Professor Kevin McManus, for their valuable suggestions and insights.
Data availability statement
The experiment in this article earned Open Material badge for transparent practices. The materials are available at https://doi.org/10.48316/JFUTv-QrhvC.
Competing interests
The author(s) declare none.


 Open access