


Introduction
That the coronavirus disease (COVID-19) pandemic has fundamentally changed the global economy is obvious. Given the infectious nature of the disease, one of the most common measures enacted by most governments initially was the imposition of severe movement restrictions through lockdowns and associated remote working directives (Reference Benhura and MagejoBenhura and Magejo, 2021). While many of these restrictions have been relaxed over time, there is a recognition that the prevalent onsite work culture prior to the pandemic may no longer be the norm going forward. For instance, recent research from a survey of 190 countries shows that about 89% of people expect to be able to work from home (WFH) at least sometimes after the end of the pandemic (Reference Strack, Kovacs-Ondrejkovic and BaierStrack et al., 2021).
Many workers remain apprehensive about working onsite owing to fear of contracting the virus. One reason for such apprehension is the perceived lack of workplace preparedness to protect workers from COVID-19. For instance, among 1049 employees in Hong Kong surveyed between 17 and 27 February 2020, workers who reported having a workplace policy in their company indicated dissatisfaction with its comprehensiveness (36%), timeliness (38%) and transparency (63%) (Reference Wong, Ho and WongWong et al., 2020). While workplace preparedness for COVID-19 is likely to have improved over time, it is not surprising that worker apprehension regarding onsite work persists (Reference Strack, Kovacs-Ondrejkovic and BaierStrack et al., 2021). It is therefore not surprising that many workers prefer working from home on a full-time basis, with recent results indicating a greater preference in developing countries relative to most rich countries. For instance, in a survey conducted by the Boston Consulting Group in 2020, about 44% of South Africans and 39% of Indians liked the idea of working from home compared to lower figures from many advanced countries (Reference Strack, Kovacs-Ondrejkovic and BaierStrack et al., 2021). While some form of remote working arrangement has become imperative presently, it is also important to note that it is associated with a number of challenges not least stress and maintaining work-life balance (Reference Toniolo-Barrios and PittToniolo-Barrios and Pitt, 2021).
Given the widespread need for remote working arrangements, the International Labour Organisation (ILO) has published a guide for teleworking during and beyond the pandemic (ILO, 2020a). It sees telework as a necessary means of ensuring business continuity in a crisis situation akin to natural disasters and urges employers to ensure that all workers who perform tasks compatible with teleworking arrangements be allowed to work remotely during the pandemic.
However, not every job is amenable to remote work and not every worker or occupational grouping is equipped for effective remote work. Reference Dingel and NeimanDingel and Neiman (2020) have provided an estimation of the feasibility of working from home in the US, taking advantage of the US Bureau of Labour Statistics’ detailed occupational dictionaries based on the Occupational Information Network database. They found that only 37% of jobs in the US can be entirely performed at home, with substantial cross-city and industry variations. Moreover, these jobs are better remunerated than those that cannot be done at home. This can at least be partly explained by the fact that jobs that require face-to-face interactions are mostly concentrated among the lower wage categories (Reference Avdiu and NayyarAvdiu and Nayyar, 2020). These outcomes are not restricted to the US. Many other studies have also utilised the Dingel and Neiman methodology and other methodologies in characterising working from home (Reference Hensvik, Le Barbanchon and RathelotHensvik et al., 2020; ILO, 2020b; Reference Mongey and WeinbergMongey and Weinberg, 2020). What is clear is that measuring working from home remains a lively area of research.
One drawback of studies of job amenability to remote work based in developed countries is their limited generalisability given that the task content of many jobs within an occupational category exhibits substantial cross-country heterogeneity. Thus, some jobs that may be classified as being amenable to working from home in developed countries with high internet penetration and quality may require intensive face-to-face interactions and physical exertion in poorer countries (Reference Hatayama, Viollaz and WinklerHatayama et al., 2020; Reference SaltielSaltiel, 2020).
To provide more nuance, Reference Hatayama, Viollaz and WinklerHatayama et al. (2020) examined the amenability of jobs to WFH arrangements in 53 countries with varying levels of economic development. They found that a country’s level of economic development was positively correlated with the amenability of jobs to working from home. They described this phenomenon as being explained by the fact that jobs in poor countries are relatively more manual in nature and use less information and communications technology, while workers in such countries have poorer access to home internet. Women, college graduates and workers on salaried and formal jobs were more likely to be engaged in jobs amenable to working from home than the average worker. The converse obtained for workers in the hotel and restaurant, construction, agriculture and commerce industries. They warned that these outcomes may exacerbate inequities between and within countries. Other studies have also shown wide cross-country variations in the percentage of jobs that can be done remotely, with job amenability to working from home disfavouring poorer countries. For instance, the percentage of jobs that can be done remotely ranges from 6% in Ghana, 23% in Yunnan, China, to 56% in Germany (Reference Alipour, Falck and SchullerAlipour et al., 2020; Reference Dingel and NeimanDingel and Neiman, 2020; Reference SaltielSaltiel, 2020) while about 39% of Canadians were in jobs that could be done from home during the pandemic (Reference Deng, Morissette and MessacarDeng et al., 2020).
Adapting the Reference Dingel and NeimanDingel and Neiman (2020) methodology, Reference Kerr and ThorntonKerr and Thornton (2020) ascertained job amenability to working from home in South Africa. They showed that of the 13.8 million South African workers employed prior to the strictest level 5 lockdown, only 13.8% could feasibly WFH.
Such varied capabilities to WFH especially in a period when such work arrangements are essential for ensuring business continuity have the potential to exacerbate inequalities and inequities. One of the reasons for this is that the essential nature of social distancing regulations has necessitated working from home, thereby increasing wage inequality between those able and unable to adhere to such regulations (Reference Delaporte, Escobar and PeñaDelaporte et al., 2021). Consequently, jobs amenable to remote work usually pay higher, in part due to the nature of such jobs. For instance, domestic workers and security guards (who make up some of the lowest paid workers) need to work onsite, while some of their counterparts in higher paid occupations such as teachers can afford to work remotely (Reference Benhura and MagejoBenhura and Magejo, 2021). And according to Reference Kerr and ThorntonKerr and Thornton (2020), working from home is almost an exclusive preserve of relatively skilled workers in a developing country such as South Africa. They found that while 65% of skilled workers and 56% of professionals could WFH in South Africa, such a luxury was virtually not possible for those in low-skilled occupations. This finding is similar to results from Japan (Reference Kawaguchi and HiroyukiKawaguchi and Hiroyuki, 2021).
Nevertheless, working from home is not only about telework. In some instances, industrial and service home-based work, say in apparel manufacture and hairdressing, may be significantly associated with WFH arrangements (ILO, 2021). In such instances, working from home, which preceded the pandemic, may be associated with poorer earning and welfare outcomes. Thus, the literature on working from home is vast, encompassing various forms of working arrangements with different welfare implications.
The South African context
South Africa is one of the most unequal countries globally with a Gini coefficient of 0.65 in 2015 (Statistics South Africa, 2019). Much of this inequality is rooted in the country’s history of racial segregation and economic exclusion. This situation has been worsened by the current pandemic. The massive job losses in the country due to the pandemic adversely affected the poor and vulnerable more than the better off. For instance, between February and April 2020, low-earning workers (earning below ZAR 3000, i.e. about USD 214 per month) were about eight times as likely to lose their jobs as top earners (who earned more than ZAR 24,001, i.e. about USD 1714 per month) (Reference Ranchhod and DanielsRanchhod and Daniels, 2020). Such enormous socio-economic disparity regarding job losses during some of the strictest lockdown restrictions in the country is no doubt partly due to the fact that most jobs could only be done remotely. And with the growing importance of remote work, it is likely that such disparity will persist. It is therefore likely that the ability to WFH will play an important role in determining socio-economic inequality in South Africa for the foreseeable future.
South Africa implemented stringent restrictions as a means of controlling infections against COVID-19 (Reference Carlitz and MakhuraCarlitz and Makhura, 2020). One of the main measures was the declaration of a national state of disaster on 15 March 2020 and the implementation of a series of nationwide lockdowns ranging from level 5 (the most stringent) to level 1 (the least restrictive) since 26 March 2020 (Reference Dlamini-ZumaDlamini-Zuma, 2020; South African Government, 2021).
While some studies have analysed various facets of the ability to WFH during the pandemic in South Africa, to the best of our knowledge, none has estimated its socio-economic inequalities as well as the determinants of such inequalities (Reference Benhura and MagejoBenhura and Magejo, 2021; Reference Kerr and ThorntonKerr and Thornton, 2020). The closest study to ours is that of Reference Benhura and MagejoBenhura and Magejo (2021) who estimated the determinants of inability to WFH during November–December 2020. However, their study did not tackle the issue of socio-economic inequalities, that is the extent to which ability to WFH favours the better off and places the poor at a socio-economic disadvantage. Moreover, they only analysed data over a short duration which does not encompass the entire period of the pandemic for which data are available in South Africa.
Given the foregoing, this study estimates the socio-economic inequality associated with the ability to WFH as well as the factors that significantly contribute to the observed inequalities in South Africa during the COVID pandemic. We hope that the study will provide the evidence base for the better targeting of the determinants of socio-economic inequalities in ability to WFH.
Material and methods
Data and key variables
Waves 2–5 of the National Income Dynamics Study (NIDS)-Coronavirus Rapid Mobile (CRAM) survey were used for the analysis (NIDS-CRAM, 2020a, 2020b, 2021a, 2021b). The NIDS-CRAM survey is a five-wave telephonic longitudinal survey of South Africans designed to assess the socio-economic and health impacts of the COVID-19 pandemic. The sampling frame was drawn from the adult sample of the fifth (i.e. final) wave of the NIDS survey which was conducted in 2017. NIDS is the first nationally representative panel dataset of South Africans. Batch sampling, a sampling technique whereby potential sample members were provided to fieldwork teams in batches (in this case, of 2500), was used for sampling. This allowed for flexibility through the adjustment of the sampling rate as the survey progressed and more information about stratum response became available (Reference Kerr, Ardington and BurgerKerr et al., 2020). The five waves of NIDS-CRAM were conducted between 7 May 2020 and 11 May 2021; thus, data were collected under various lockdown levels. Footnote 1
The outcome variable is the ability to WFH. Employees were asked whether they were able to WFH. Possible responses were, ‘Yes – most of the time’, ‘Yes – some of the time’ and ‘No – none of the time’. We created a dummy variable which equalled one if the individual was able to WFH some or most of the time, and zero if none of the time. For the primary analysis, the measure of socio-economic condition used as a ranking variable was the number of years of schooling. We would have used per capita household income; however, as documented elsewhere, the income variable had a substantial number of missing observations (Reference Nwosu, Kollamparambil and OyenubiNwosu et al., 2021). Expectedly, years of education was positively and significantly (p < 0.01) correlated with both income and wages. Socio-economic inequalities with household income (and wages) as ranking variables led to similar conclusions as those reported in the main analysis (see Table A1 in the Appendix). Variables employed as determinants of the socio-economic inequality in ability to WFH were: the type of employment (casual or formal), occupation, gender, location, race, co-residence with children, marital status, respondent having a chronic health condition, age, household size, years of schooling and indicators for time.
Analytical methods
We used concentration curves and indices to measure the magnitude of socio-economic inequality in ability to WFH. A concentration curve measures the cumulative shares of the population with a particular outcome (in this case ability to WFH) ranked against a measure of socio-economic status. A 45° line depicts the line of perfect equality – points at which the rich and the poor have the same value of the outcome. In most empirical cases however, the concentration curve either lies above or below this line of equality. Curves lying above the line of equality indicate that the outcome disfavours the poor while those lying below the line of equality are indicative of the outcome being pro-rich, that is favouring the rich/socio-economically better off (Reference O’Donnell, van Doorslaer and WagstaffO’Donnell et al., 2008).
Following Reference O’Donnell, van Doorslaer and WagstaffO’Donnell et al. (2008), we note that the concentration index can be measured as twice the area between the concentration curve and the 45° line. However, for ease of computation, it can also be defined as twice the covariance between the outcome of interest and the fractional rank in the distribution of the socio-economic ranking variable divided by the mean of the outcome variable (equation (1) below).

where C, A, r and µ depict the concentration index, outcome (here, ability to WFH), the fractional rank in the distribution of the socio-economic status variable and the mean of the outcome respectively. It ranges from −1 to +1, where negative values indicate the outcome of interest disfavouring the poor (similar to the concentration curve lying above the 45° line) while the converse holds for positive values. A zero value indicates perfect equality, analogous to the concentration curve coinciding everywhere with the 45° line.
Intuitively, both measures complement each other. While the concentration curve is a useful tool for depicting the existence of socio-economic inequalities in outcomes of interest, it cannot be used to compare the magnitude of inequality between various populations, time periods, etc. Especially in situations where various concentration curves cross, it becomes difficult to determine which curve dominates. Conversely, while the concentration index provides a useful summary of socio-economic inequality, it does not provide the kind of nuance possible with the concentration curve across the entire socio-economic distribution. For instance, it is possible for a zero value to be the result of the curve crossing the line of equality with equal areas below and above the line. Similarly, a positive (negative) value may not necessarily result from the curve lying exclusively below (above) the line of equality. Such outcomes may be due to a significantly larger area of the curve lying below (above) the 45° line (Reference O’Donnell, van Doorslaer and WagstaffO’Donnell et al., 2008).
The concentration index for categorical variables (as in this study) however, does not necessarily lie between −1 and +1, hence the need for some normalisation (Reference WagstaffWagstaff, 2005). To correct this, we used the Erreygers’ normalisation as follows (Reference ErreygersErreygers, 2009a, Reference Erreygers2009b):

where E, a and b depict the Erreygers’ correction and the lower and upper bounds of the outcome respectively while other terms are as defined in equation (1).
Decomposition of the inequality in ability to work from home
We employed the Wagstaff technique in decomposing the socio-economic inequality in the ability to WFH as follows (Reference Wagstaff, van Doorslaer and WatanabeWagstaff et al., 2003):

where Z denotes the determinants;
 and
and
 are parameters;
 is the error term; while i and k are individual and determinant identifiers.
The concentration index can therefore be re-written as:

where
 is the elasticity of the ability to WFH to marginal changes in the k-th determinant, while
 is the concentration index of the k-th determinant.
 denotes the generalised concentration index of the error term.
 represents the contribution of the k-th determinant to the socio-economic inequality in ability to WFH. The term
 measures the unexplained/residual component.
Given the lack of analytical standard errors, we obtained bootstrapped standard errors with 1000 replications for the components of equation (4).
Given a pro-rich ability to WFH, a determinant with a negative contribution coefficient would mitigate the socio-economic inequality in the outcome. Thus, eliminating/reducing such a contribution would lead to an increase in the pro-richness of ability to WFH. The converse obtains for a determinant with a positive contribution, where the elimination/reduction in such a contribution would reduce the pro-richness of the outcome. Equation (4) shows that such an increase/reduction in the pro-richness of the outcome can be achieved by targeting either its elasticity to changes in the determinant and/or the inequality in the determinant.
Results
Figure 1 presents the trend in employees’ stated ability to WFH between wave 2 and wave 5.

Figure 1. Prevalence of ability to WFH.
Authors’ computation; estimates on unbalanced panel and weighted by wave-specific sampling weights.
Figure 1 indicates a 2.5 percentage point increase in the ability to WFH between wave 2 and wave 3. However, it fell by 3.5 percentage points in wave 4, with a further 1.4 percentage point decline in wave 5. While not shown here, 95% confidence intervals indicate that these between-wave changes were not statistically significant in the population. Women consistently reported a higher prevalence of ability to WFH in each wave, with the gender differences significant in all periods except wave 4.
As noted in the above review, jobs that are amenable to working from home also pay higher wages internationally. We therefore depict average monthly wages for those able to WFH and their counterparts who reported inability to WFH.
Figure 2 indicates an obvious association between ability to WFH and wages, with employees able to WFH earning significantly more than those unable to WFH by orders of magnitude of two to three times.
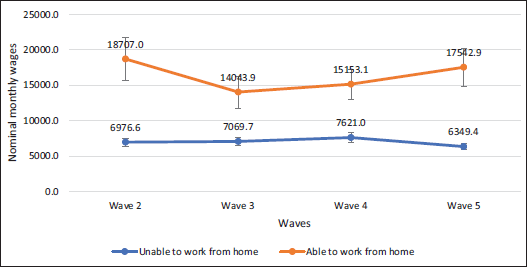
Figure 2. Wages by ability to WFH.
Authors’ computation; estimates on unbalanced panel and weighted by wave-specific sampling weights; 99% confidence intervals.
Figure 3 depicts the concentration curves for ability to WFH with the population ranked by years of education (as a measure of socio-economic status).
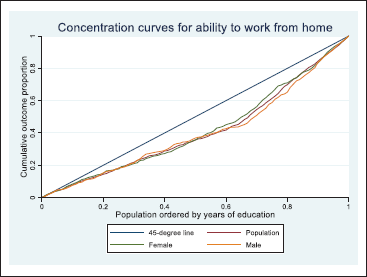
Figure 3. Concentration curves for ability to WFH.
Pooled unbalanced sample (wave 2–wave 5); estimates weighted by wave-specific sampling weights.
As shown in Figure 3, ability to WFH was pro-rich, implying that workers with higher socio-economic status were more likely to WFH during the pandemic. Moreover, the degree of socio-economic inequality was similar between the female and male populations. Similar graphs also resulted when household per capita income and monthly wage were used as ranking variables, indicating that the pro-richness of ability to WFH was robust to the socio-economic measure used as the ranking variable (results available on request).
We provide a quantitative confirmation of the results in Figure 3 by presenting the concentration indices of ability to WFH using years of schooling as the ranking variable in Table 1.
Table 1. Concentration indices of ability to WFH.
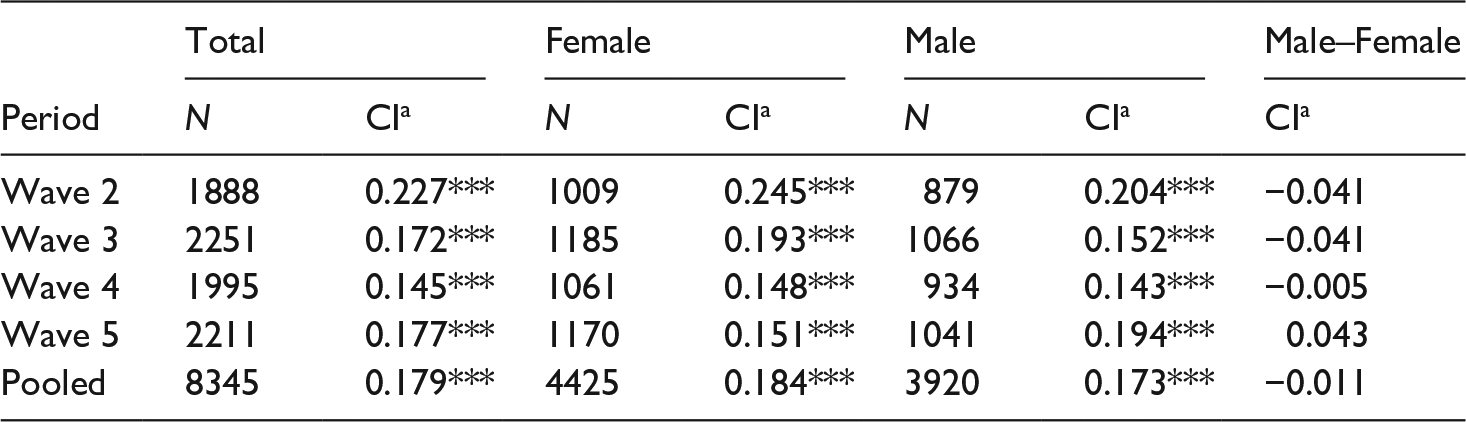
Estimates weighted by wave-specific sampling weights; pooled sample based on unbalanced panel.
a Concentration index.
* p < 0.1. **p < 0.05.***p < 0.01.
Table 1 mirrors the results in Figure 3, with ability to WFH favouring workers in higher socio-economic status groups. Moreover, the gender differences in inequality were not statistically significant even at the 10% level. These results were consistent across the waves as well as in the pooled population. The results were also robust to restricting the analysis to individuals of at least 25 years old to prevent those yet to finish school from contaminating the results (results available on request). Similarly, the same pattern of results was obtained using monthly wage and monthly per capita household income as ranking variables (see Table A1 in the Appendix).
In Table 2, we present the averages/percentages of the determinants, their concentration indices, coefficients, associated elasticities and contributions to explaining the socio-economic inequality in ability to WFH. Column 1 indicates that the level of casualisation was very high, with 34% of employees being employed in casual jobs. The most common occupational category was elementary occupations followed by professionals while the least common was skilled agricultural, forestry and fishery occupations. Men were in the majority of the employee population while most employees lived in urban areas. In terms of household structure, 44% lived with children under 7 years old while 54% were either married or cohabiting. Sixteen percent of the population had a chronic condition. Average age was 39 years while the average household size was 4.3 persons. The average number of years of schooling was 12 years. Though not shown in Table 2, about 24% of the employee population indicated that they were able to WFH between wave 2 and wave 5.
Table 2. Determinants of socio-economic inequality in ability to WFH.
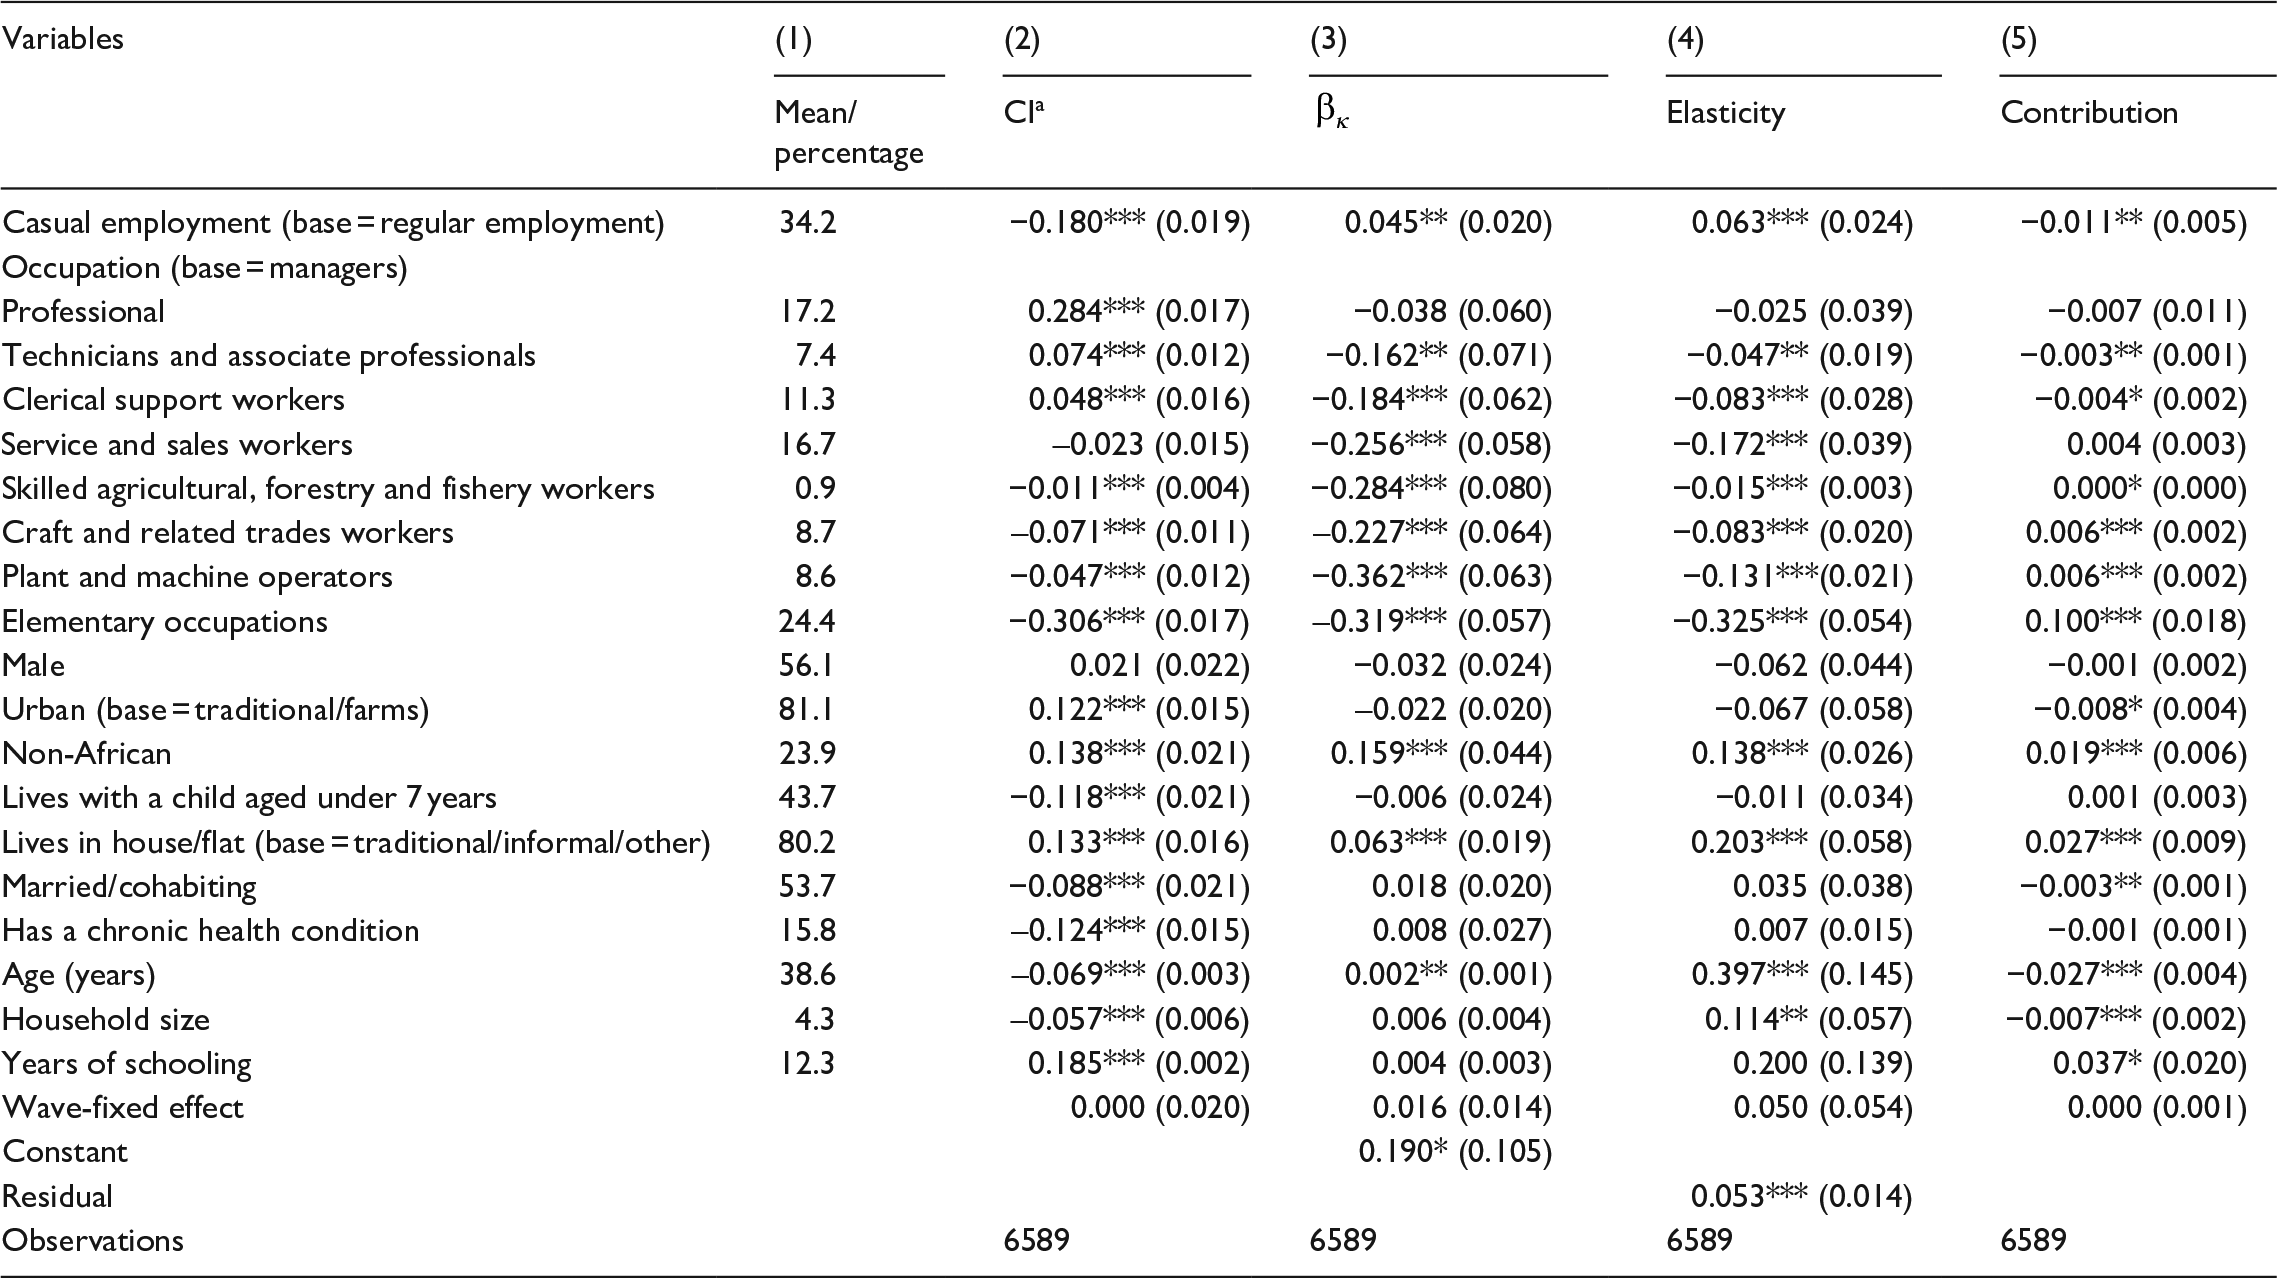
Pooled sample based on unbalanced panel (wave 2–wave 5); estimates weighted by wave-specific sampling weights; standard errors in parentheses.
a Concentration index.
* p < 0.1. **p < 0.05. ***p < 0.01.
Following equation (4), column 5 indicates that being employed in casual (relative to formal) employment, belonging to technical and clerical occupational groups (compared to mangers), urban residence, being married or cohabiting, age and household size contributed to mitigating the pro-richness of ability to WFH. Thus, eliminating the contribution of each of these covariates would make ability to WFH more pro-rich than it is. Such an outcome could result from eliminating/reducing the socio-economic inequalities in these variables and/or the elasticity of ability to WFH to changes in them. The converse obtained for the covariates with positive contribution coefficients such as being in skilled agricultural, craft and related occupations, plant and machine operations and elementary occupations (relative to managers), being non-African, living in a house/flat and having more years of schooling. We note that two determinants having the same contribution sign can sometimes be the result of different signs in both their concentration indices and elasticities. For instance, though being in casual employment and living in urban areas, each has a negative contribution; these contributions were informed by opposite signs in the covariates’ concentration indices and elasticities.
Discussion
That only a quarter of employees were able to WFH over the pandemic period is not surprising and is consistent with the wider international literature which aver that far fewer jobs can be performed from home in developing countries compared to their advanced counterparts (Reference Dingel and NeimanDingel and Neiman, 2020; Reference Hatayama, Viollaz and WinklerHatayama et al., 2020; Reference SaltielSaltiel, 2020). The downward trend in ability to WFH is not surprising too, given that workplaces must have increasingly implemented safety measures at work over time. However, the safety of workers must not be taken for granted while legitimate employee concerns about workplace safety and the premature return to the workplace (Reference Strack, Kovacs-Ondrejkovic and BaierStrack et al., 2021) must be addressed.
Our finding of women being more likely to WFH than males (Figure 1) (even though the gender-related elasticity was not statistically significant in a multiple regression context) concurs with earlier evidence in South Africa (Reference Benhura and MagejoBenhura and Magejo, 2021), but contradicts some international evidence where men were found to be more likely to WFH during the pandemic (Reference Bonacini, Gallo and ScicchitanoBonacini et al., 2021). Indeed, women tend to be more likely than men to request flexible working arrangements (including WFH arrangements) in order to maintain and grow their careers while engaging in childcare (Reference Chung and Van der LippeChung and Van der Lippe, 2020).
While the consistent finding of a significantly pro-rich distribution of ability to WFH during the pandemic is not unexpected, it suggests that ability to WFH may significantly worsen various forms of socio-economic inequalities in the pandemic and post-pandemic periods especially if potential workers’ ability to work remotely becomes an important determinant of employment over time. Already, there are predictions that social distancing regulations will likely increase inequality within and between countries (Reference Bonacini, Gallo and ScicchitanoBonacini et al., 2021; Reference Delaporte, Escobar and PeñaDelaporte et al., 2021).
While the negative concentration index of casual employment conforms to expectations, its associated positive elasticity is unexpected given that the ability to WFH was consistently positively correlated with most markers of socio-economic advantage in South Africa. The positive and significant elasticity was true for both males and females. This positive elasticity, coupled with casual workers being disproportionately worse educated, painted a picture of casualisation mitigating the extent to which the ability to WFH favoured the better educated. The same applies to urban residence where its positive concentration index conforms to expectations given that the better educated are more likely to live in urban areas while its associated negative coefficient/elasticity (though statistically insignificant) is surprising. However, the negative coefficient conforms to earlier evidence from South Africa (Reference Benhura and MagejoBenhura and Magejo, 2021). These atypical findings require further investigation to understand the underlying causes.
That being married/cohabiting enhances the pro-richness of ability to WFH resulted from a combination of those with higher educational attainment being less likely to be married/cohabiting as well as the married/cohabiting being more likely to be able to WFH (positive elasticity). That being married/cohabiting is concentrated more on the less educated in South Africa is not surprising given that prior studies have shown declining marriage rates among the younger generation who are more likely to be better educated (Reference Posel, Rudwick and CasalePosel et al., 2011) – also see the negative age concentration index in Table 2. Furthermore, the positive elasticity of marriage/cohabitation conforms with prior evidence on South Africa (Reference Benhura and MagejoBenhura and Magejo, 2021). That said, the elasticity may be affected by nuanced family composition as some dated studies found stronger interest in telework among couples with no children than those with one to two children (Reference Huws, Robinson and RobinsonHuws et al., 1990).
The negative concentration index of household size is not surprising given the negative relationship between indicators of family size and education as found in previous studies based on developing countries like Mexico and Bangladesh (Reference BinderBinder, 1998; Reference MaitraMaitra, 2003). Also, the associated positive elasticity for household size conforms to pre-pandemic evidence where having more than four household members was positively associated with interest in telework (Reference Huws, Robinson and RobinsonHuws et al., 1990). However, we are mindful that both periods are vastly different in terms of both the motivation for telework and the prevailing social context coupled with the fact that working from home is not identical with telework.
The associated positive schooling elasticity concurs with evidence from the US during the pandemic, as workers there with less education tend to more likely be in jobs where working from home is not feasible (Reference Dey, Frazis and LoewensteinDey et al., 2020).
That race – that is being non-African (relative to African) – increased the socio-economic inequality in ability to WFH is not surprising. This result was due to a positive racial concentration index and a positive elasticity of ability to WFH with respect to being non-African. These results conform to prior studies which demonstrate that Africans have lower educational attainment as well as a lower ability to WFH especially relative to whites during the pandemic (Reference Benhura and MagejoBenhura and Magejo, 2021; Reference SalisburySalisbury, 2016). Thus, the double whammy of Africans having lower educational attainment and lower ability to WFH contributed in increasing the extent to which ability to WFH favoured the socio-economically advantaged. Therefore, eliminating/reducing education-related racial inequality as well as the extent to which non-Africans have a WFH advantage over Africans will reduce the socio-economic inequality in ability to WFH. A similar conclusion applies to living in a house or flat (relative to inferior housing structures such as mud huts and shacks).
Finally, all other occupational groups had a negative elasticity coefficient (relative to the managerial occupational class), with all statistically significant except the professional category. While this is not surprising (see e.g. Reference Dey, Frazis and LoewensteinDey et al., 2020), it highlights the need for policies to provide adequate protection to all categories of workers. While it is understandable that by their nature, certain occupations are less amenable to WFH arrangements in South Africa (e.g. technicians and associate professionals) – see for example Reference Kerr and ThorntonKerr and Thornton (2020), it is essential to provide adequate workplace safeguards for the affected workers. Where possible, flexible working arrangements such as a combination of onsite and remote work can be implemented to enable them discharge their duties in an atmosphere devoid of heightened fear of contracting the virus due to work commitments.
Conclusion
This study shows that ability to WFH has been generally declining over time during the pandemic and is positively associated with various indicators of socio-economic well-being. Particularly, employees able to WFH earn significantly more than those who are not able to, while women are more able to WFH than men even though this relationship is not statistically significant. Ability to WFH consistently favours workers in higher socio-economic groups – irrespective of the measure of socio-economic status used as the ranking variable. Casual employment, urban residence, being married or cohabiting, age, household size and certain occupations (technical and clerical occupational groups, compared to managers) mitigate the degree to which ability to WFH favours those in higher socio-economic classes. Conversely, being non-African, living in a house/flat, having more education and some occupational groups (skilled agricultural, craft and related occupations, plant and machine operations and elementary occupations, relative to managers) accentuates the extent to which ability to WFH favours those who are socio-economically better off. This study provides the first set of evidence on the magnitude and determinants of socio-economic inequality in ability to work remotely in South Africa during the COVID-19 pandemic. This is important given the potentially positive impact of ability to WFH on welfare, and therefore, in driving income inequality in the pandemic and post-pandemic periods. Interventions targeted at inequality-enhancing factors such as race, housing and education may be important in lowering such inequalities. Such interventions will likely mitigate the fears of these economically disadvantaged workers about contracting the virus at work and minimise the need to have to choose between one’s health and livelihood.
Acknowledgements
The authors thank attendees of the NIDS-CRAM authors’ seminar for helpful comments on an earlier version of this paper.
Funding
The author(s) disclosed receipt of the following financial support for the research, authorship, and/or publication of this article: The overall NIDS-CRAM project (i.e. Data Collection) was funded by the Allan and Gill Gray Philanthropy, the FEM Education Foundation and the Michael and Susan Dell Foundation. The funding body was not involved in the conceptualisation, design, analysis and interpretation of our findings in this study. They also did not influence our choice of journal.
Appendix: Socio-economic inequalities in ability to work from home during the coronavirus pandemic
Table A1. Concentration indices of ability to work from home using monthly wage and monthly per capita household income as ranking variables.
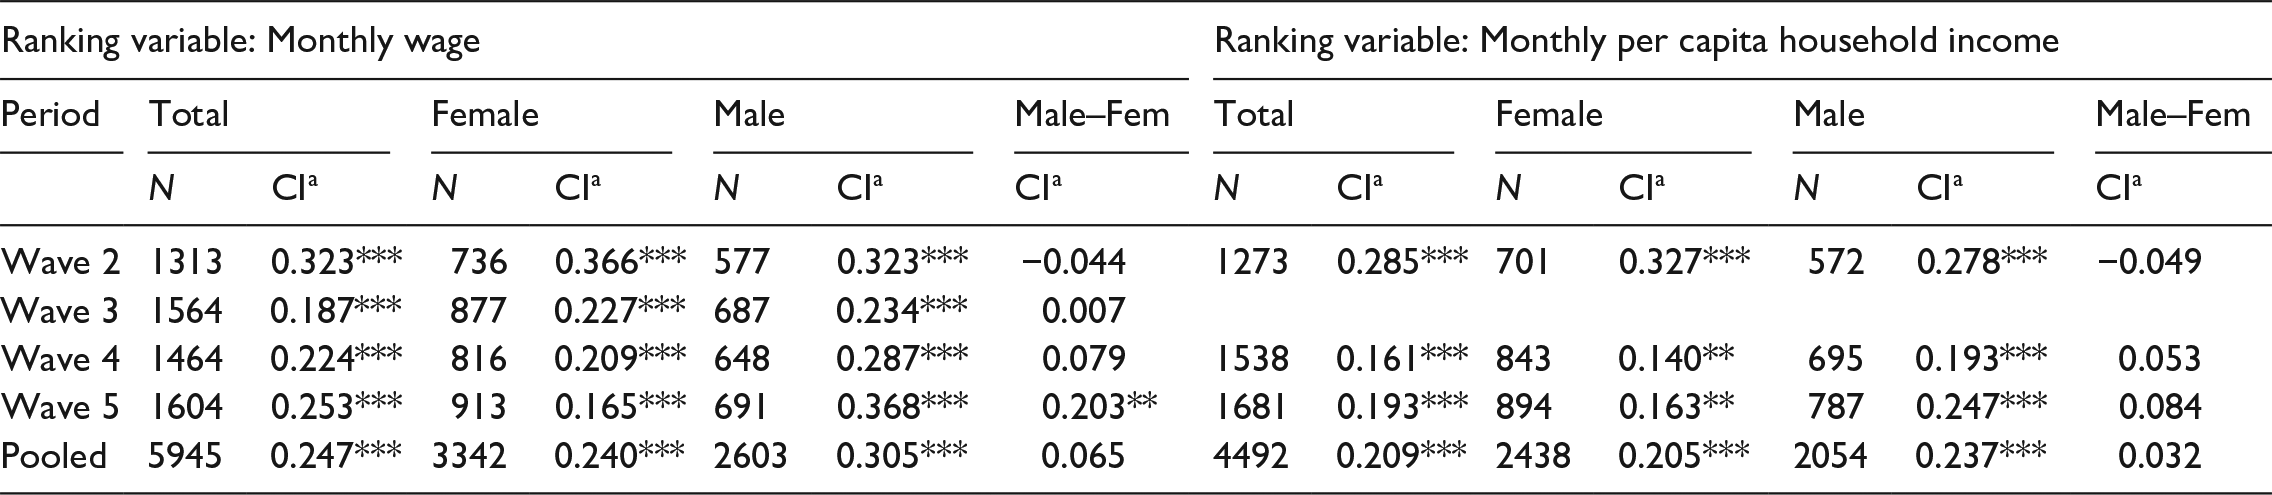
Estimates weighted by wave-specific sampling weights; pooled sample based on unbalanced panel.
a Concentration index; household income not available in wave 3.
* p < 0.1. **p < 0.05. ***p < 0.01.


 Open access