

The “experimental” playwrights of continental Europe have been experimental not because they have imitated modern literature or poetry, but because they have sought to express themselves in theatrical terms, and the great directors, like Jouvet, Barrault, Viertel, and Brecht have been there to make their plays “exist” on the stage.
—Theodore Hoffman, 1959Footnote 1Considering the institutional frames of Sighing, Tian Mansha's production is a star-centred experimental xiqu work.
—Lin Chen, 2019Footnote 2Sixty years separate these two sentences—yet both are statements found in a dataset about experimental theatre. The first one references playwrights and directors in Europe. The article from which it is taken compares the situation in Europe to that in the United States (which Hoffman, a legendary director-educator then based in New York, refers to as “our theatre”). The second sentence talks about Sighing, an experimental adaptation of 戏曲 (xiqu, Chinese opera) by Tian Mansha, one of the most internationally renowned Sichuan opera performers at the time of writing. These two sentences are, respectively, one of the oldest and one of the most recent entries in a dataset of sentences about experimental theatre. The first mentions four men and deals with a Euro-American genealogy of experimental theatre. The second mentions a woman, and explores the meanings of experimental performance in Mainland China and Taiwan. These two sentences are indicative of a larger trend: the progressive diversification of the people and places mentioned in the scholarship on experimental performance. As we might expect, increasingly more women and more places outside of Europe and North America were mentioned in six decades worth of academic articles. However, drilling into the data shows that this story is more complicated. Women became increasingly associated with experimental performance over time, but for almost every year on record, more than half the people in this dataset were still men. In contrast, a diversification of the places started much sooner and increased at a faster pace: as the results below show, in the twenty-first century the vast majority of places mentioned in connection to experimental performance were located outside Europe and North America. Data add nuance and precision to our impressions. If we believe that the diversification of the people and places of theatre scholarship matters, data make important contributions to our methodological palette.
This paper's conclusions are based on a large dataset of theatre scholarship that was analyzed with the help of computational tools. Despite the relative newness of its methods, this project continues a scholarly tradition interested in historicizing how experimental theatre is conceptualized and discussed. Perhaps the most influential example of this tradition is James Harding's The Ghosts of the Avant-Garde(s), which chronicles the ways in which scholars have emphasized and downplayed different accents of meaning of the term “avant-garde.”Footnote 3 Harding writes that “to speak of the avant-gardes necessitates speaking of how the avant-gardes have been received and conceptualized in cultural criticism.”Footnote 4 Harding's book-length history requires a nimble analytical disposition capable of tracing changing contexts and meanings. In comparison, my brief piece of data history focuses on the who and where of experimental theatre scholarship. Histories such as Harding's use the terms “avant-garde(s)” and “experimental” somewhat interchangeably, and focus predominantly on a Euro-American context. The present overview is more expansive in its scope inasmuch as it considers the entire corpus of sentences about experimental work written in theatre research articles, but the price I pay for this expansion is a razor-thin focus on a single term, which necessarily leaves many things out.
All scholarship entails trade-offs of selection and omission, and I hope to convince readers that the conclusions that follow are worth the limitations imposed by computational research. As Debra Caplan notes, “data-driven theatre history, at its best, can reveal previously invisible patterns.”Footnote 5 The patterns I find here are perhaps not wholly invisible, but without data they are blurred and imprecise. Bringing them into sharp relief does not displace other modes of knowing, but suggests novel questions that might in turn be explored by close reading and traditional historiographic methods. Sarah Bay-Cheng notes that digital tools change the practice of historiography, enabling an interactive, performative way of interrogating the past.Footnote 6 This applies not only to the records of performance, but also to our own scholarship. For this research project, I created a new command line interface to help me reimagine the records of theatre scholarship interactively. Below, I give a nontechnical overview of this method and highlight the interpretive moves that underpin my approach.
Computation, Theatre Scholarship, and Distant Reading
When Debra Caplan wrote the influential “Notes from the Frontier: Digital Scholarship and the Future of Theatre Studies” in 2015, she dedicated substantial attention to justifying the importance of digital methods for theatre.Footnote 7 In the span of just a few years, her predictions have come true, and the work she describes has increasingly moved from the frontier to the center. Theatre Journal has dedicated two entire issues to digital theatre scholarship, book-length studies of theatre and digital humanities have been published, a working group dedicated to digital research meets regularly at IFTR, and ATHE gives an annual award for digital scholarship.Footnote 8 Among other things, theatre scholars have used digital methods to study changes in the lengths of production runs, patterns of collaborations among artists, and the cultural transmission of influential playscripts.Footnote 9
The digital humanities are an even more mature field in literary studies, and several influential monographs have been published in recent years.Footnote 10 Literary scholars have also used digital methods to study their fields scholarly production. Andrew Piper's Can We Be Wrong? Textual Evidence in a Time of Data analyzes the prevalence of “generalization” in literary scholarship using machine learning.Footnote 11 To the best of my knowledge, theatre scholars have yet to take advantage of such approaches to study our vast scholarly record. However, focusing on scholarship itself as an important object of study is an uncontroversial research strategy. Take, for example, Shannon Jackson's monumental Professing Performance, which takes scholarship as primary evidence for reconstructing the intellectual history of performance studies across various institutional contexts.Footnote 12
Computational tools enable us to ask these questions at a different scale and afford a level of systematicity that is useful for certain types of question. For example, digital methods have been shown to be especially important when studying representation and diversity. Deb Verhoeven and collaborators have used network analysis to identify structural causes that prevent women from occupying leading creative roles in the film industry.Footnote 13 Counting Together (https://countingtogether.org/) is a database that collects statistics on race, gender, and disability in American theatre. Richard Jean So's Redlining Culture uses a host of computational tools to study racial and gender diversity in postwar American literature.Footnote 14
For this article, I participate in a form of “distant reading” that requires computer-assisted manual classification. As Ted Underwood notes, distant reading encompasses a wide range of activities that may not necessarily be explicitly computational.Footnote 15 Some forms of distant reading could be described as systematic reading, such as Underwood's own analysis of literary time.Footnote 16 In one article, he used digital tools to visualize the data, but the dataset itself was the product of human annotation. This type of work has long roots in the social sciences, where such “qualitative analysis” is often aided by specialized software such as NVivo and ATLAS.ti. The objective of software such as these is to help researchers systematically annotate or classify portions of text (typically from interviews, but also from media reports and other sources). I call the approach I use here “data-assisted” research, a term I have defined more extensively elsewhere, and which I contrast to “data-driven” methodologies.Footnote 17 In data-driven methodologies, data are used to answer specific questions. Researchers create a formal representation of a question and automate a sequence of procedures to provide an answer. The criteria for evaluation are defined beforehand, and the answer is measured against these criteria. In data-assisted methodologies, in contrast, researchers use data to transform their view of a problem. In these approaches, the purpose of framing a theatrical event as data is not to offer a clear answer but to augment our capacity to think about such an event. Data, in other words, provide a good defamiliarization strategy.
Many recent digital humanities projects use computational methods that rely heavily on machine learning techniques.Footnote 18 Though the promise of such computational work is doubtless exciting, computer-aided qualitative text analysis also holds great promise. The latter approach is particularly useful for relatively small datasets (e.g., thousands of datapoints) and for messy data where automation is difficult and a human observer can classify data in ways that are faster or more accurate.
The present study fits both of these conditions. I developed a custom piece of software that allowed me to tag and classify Named Entities (people, places, and companies; hereinafter NEs) semiautomatically within a few thousand sentences. My custom program displayed each sentence individually, in chronological order, and highlighted a number of potential NEs, which I then verified manually. Verification was necessary because some of the potential NEs were false positives, and some NEs were not initially captured. At a second stage, I classified each verified NE according to different categories, as I explain later.
Manual annotation is at the heart of this data-assisted approach, in ways that differ from those of other researchers in the computational humanities, who are interested in developing fully automatic solutions to classification problems. However, it must be noted that even “fully automatic” solutions require human annotators manually to tag a subset of the data, which can be used to draw more generalizable inferences using machine learning (ML). Typically, these systems take a long time to train (the technical term for fitting a model to a portion of the data) and validate, and even the most robust models are never 100 percent accurate, and they can consume large amounts of computational resources.Footnote 19 Larger datasets justify the effort and resources needed to train and deploy such models. But in my case, I had a reasonably “small” dataset that did not, in my opinion, justify the trade-offs required by ML. Thus, I chose to use my time and energy to tag and verify each datapoint manually. That being said, my methods are still computational inasmuch as they are enabled by a custom piece of software that aimed to make my tagging and validation process as fast and reliable as possible.
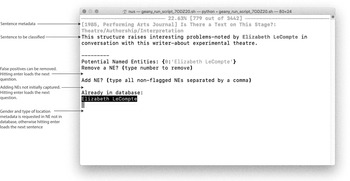
My custom software was built using the Python programming language and a host of open-source libraries.Footnote 20 The program added my manual tagging decisions to a dataset, and new entries were verified against this dataset to ensure consistency and to increase the accuracy of potential NEs in subsequent sentences (see the screenshot in Fig. 1). To display the sentences and the potential NEs I relied on an interactive command line interface (CLI). CLIs might seem arcane or difficult, but they afford enormous flexibility and ease of use. Developing these interfaces is very straightforward, especially when compared to graphic user interfaces with buttons and other features. They require relatively little time to code, and allow a researcher to make changes constantly.
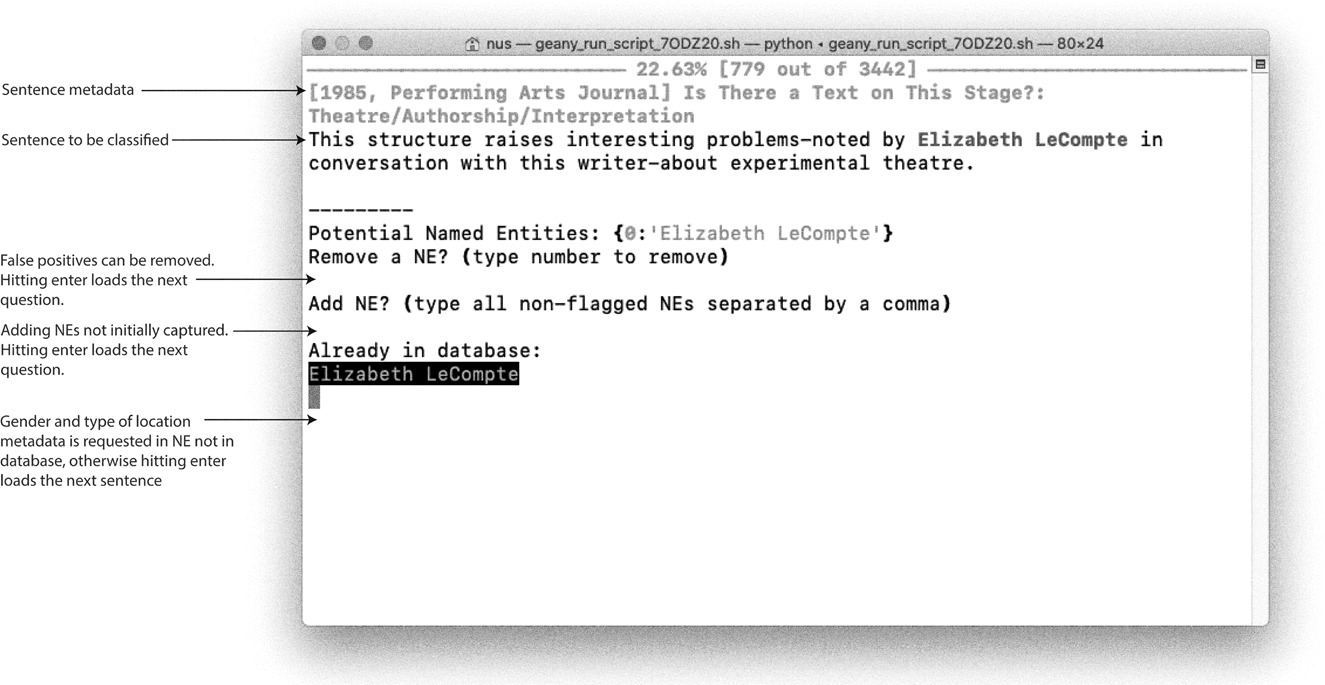
Figure 1. Screenshot of the custom Command Line Interface (CLI) developed for this research project.
When manually revising a dataset of this size (fewer than three thousand items), I find it easier to use the keyboard and a combination of keys for operations that I have to repeat over and over. This adds flexibility, reduces frustration, and ensures higher quality. I used the Rich library to add color to the interface (typically CLIs are black and white) so that potential NEs and NEs already in a dataset could be displayed in different colors. Rather than merely an aesthetic decision, I find that this keeps me alert when doing repetitive work and helps minimize errors. The interface also displayed the current rate of progress—this was important for minimizing frustration, an important consideration given that tagging the NEs took several weeks. Minimizing frustration and ensuring quality and ease of use are fundamental for this type of computationally enabled, systematic reading of thousands of instances.Footnote 21
Software such as the one I built for this project can be thought of as computational assistants, simple programs tailored for specific research objectives rather than full-fledged pieces of software ready to be used in multiple situations. For the reasons given above, I think it makes sense for researchers invested in the systematic manual analysis of thousands of items to develop their own custom software. Out-of-the box solutions for this type of work exist, and they are typically used for manually annotating interviews and other textual records by researchers in the social sciences (such as NVivo and Atlas.ti, as noted earlier). But one distinction between these software packages and my custom-built program is that my solution uses bespoke computational components to learn from my choices and update itself according to parameters within my control. I also find the ability to fully customize shortcuts and the distraction-free environments of CLIs justification enough to develop this type of software.
This study relied on data from Constellate, a portal for textual analytics from JSTOR and Portico. Using this service, I constructed a dataset that includes the metadata and unigram counts (the frequency of single words) for all articles of the following theatre journals: Tulane Drama Review, TDR/The Drama Review, Theatre Research International, PAJ/Performing Arts Journal, New Theatre Quarterly, Theatre Topics, Theatre Survey, Theatre Journal, and Modern Drama. Originally, I also included articles from Educational Theatre Journal (the predecessor of Theatre Journal). However, the online archive for this journal is patchy, as many extant articles for the early years are not research articles but progress on doctoral dissertations or items such as “don'ts for theatre builders”—hence the data for this journal were discarded.
The metadata for the articles include information such as the author, document type, name of the journal, number of pages, date of publication, a unique identifier, and the title of the article. The initial dataset comprised 19,661 titles. Constellate collections are very comprehensive, but some articles are duplicated as they are part of both the JSTOR and the Portico collections. Some journals are covered exclusively by one database, but there is significant overlap, so this required an additional step of deduplication (the technical term for removing duplicates). A complicating factor is that at times the titles are not exact matches, as sometimes a subtitle is missing, markup information (i.e., HTML codes for italics) is present in only one of the datasets, and some non-Latin characters are incorrectly displayed in the Portico dataset (the JSTOR dataset has gone through additional layers of cleaning and is more reliable). Identifying and removing near-duplicates is called fuzzy deduplication, and it is an important part of many data projects.Footnote 22
In order to carry out this process, I created another custom Python script using Pandas (a general purpose library for data science) and FuzzyWuzzy (a library to detect similar strings of texts). If two titles were from the same year and the similarity between them was above a 90% threshold, the script kept only the title in JSTOR (the preferred version). If both versions were from Portico, it kept the one that did not include markup, which was not important for the present research. In order to ensure maximum data quality, I manually verified every flagged title before removal, also using a CLI as the one described earlier.
The Constellate metadata are very comprehensive but not error-free: not all items with the document type of “article” are actual articles. Many of the retrieved documents are letters to the editor, front and back matter, and book reviews. Using another custom script, I removed all “articles” that actually belonged to these categories by relying on regular expressions. A regular expression or regex is a sequence of textual symbols that specifies a search pattern. For example, I looked for titles that included patterns such as “Letter to” or “Letters to,” and manually verified each matching title before removing it from the dataset. After removing such items and keeping only confirmed academic articles, the final dataset comprised 8,938 articles, spanning sixty-three years between 1958 and 2020.
For these articles, I then inspected the unigram (single-word) counts. I counted the number of articles that included the word “experimental” at least once, and divided this number by the total number of articles for a given year. The resulting ratio is the percentage of articles in any given year that includes the word “experimental” at least once. Figure 2 shows this percentage for every year as a bar, as well as the centered, five-year moving average as an overlaid solid line.
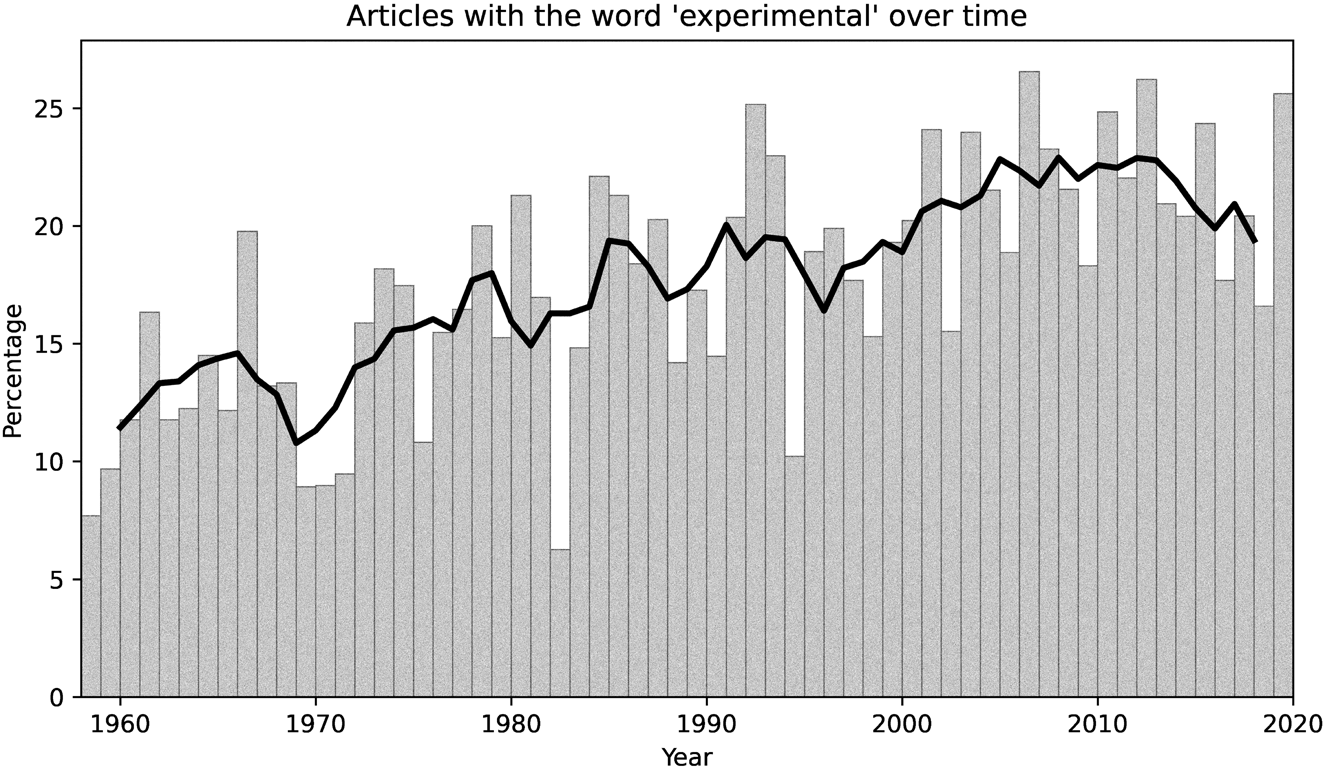
Figure 2. Percentage of articles per year that include the word “experimental” at least once. The bars indicate the raw percentage. Note: In this and other figures, the lines always depict a five-year, centered moving average, and thus always end in 2018 (the last year for which this can be calculated, as the dataset ends in 2020).
This visualization indicates a clear, if slightly subtle upward trend that peaks at around 25 percent in the 2000s and 2010s. There is a surprising dip in the 1970s, but overall increasingly more articles include the word “experimental” over time. How meaningful is this pattern in the context of theatre scholarship? To answer this question, I also calculated the percentages of three other terms: “contemporary,” “modern,” and “avant-garde*” (the asterisk denoting that I combined searches for “avant-garde” and “vanguard,” two terms that are often used interchangeably). Figure 3 presents the five-year, centered moving average for each of these terms. This visualization shows that the trend of “avant-garde*” is similar to that of “experimental” until the 1990s, at which point it starts becoming less common. In contrast, “modern” and “contemporary” are always disproportionally more common than “experimental.” “Contemporary” continues in an upward trend into the late 2010s, whereas the frequency of “modern” starts to decay in the late 2010s. Both terms also dip in the 1970s—note that these percentages are adjusted for the total number of articles in any given year, so they cannot be explained away by decreases or increases in that total. The pattern for “experimental” looks less dramatic in this comparison than it did in Figure 2. We can say that, although there is a slight upward trend, the usage of “experimental” remains reasonably consistent when placed against the backdrop of other terms with more dramatic changes over time.
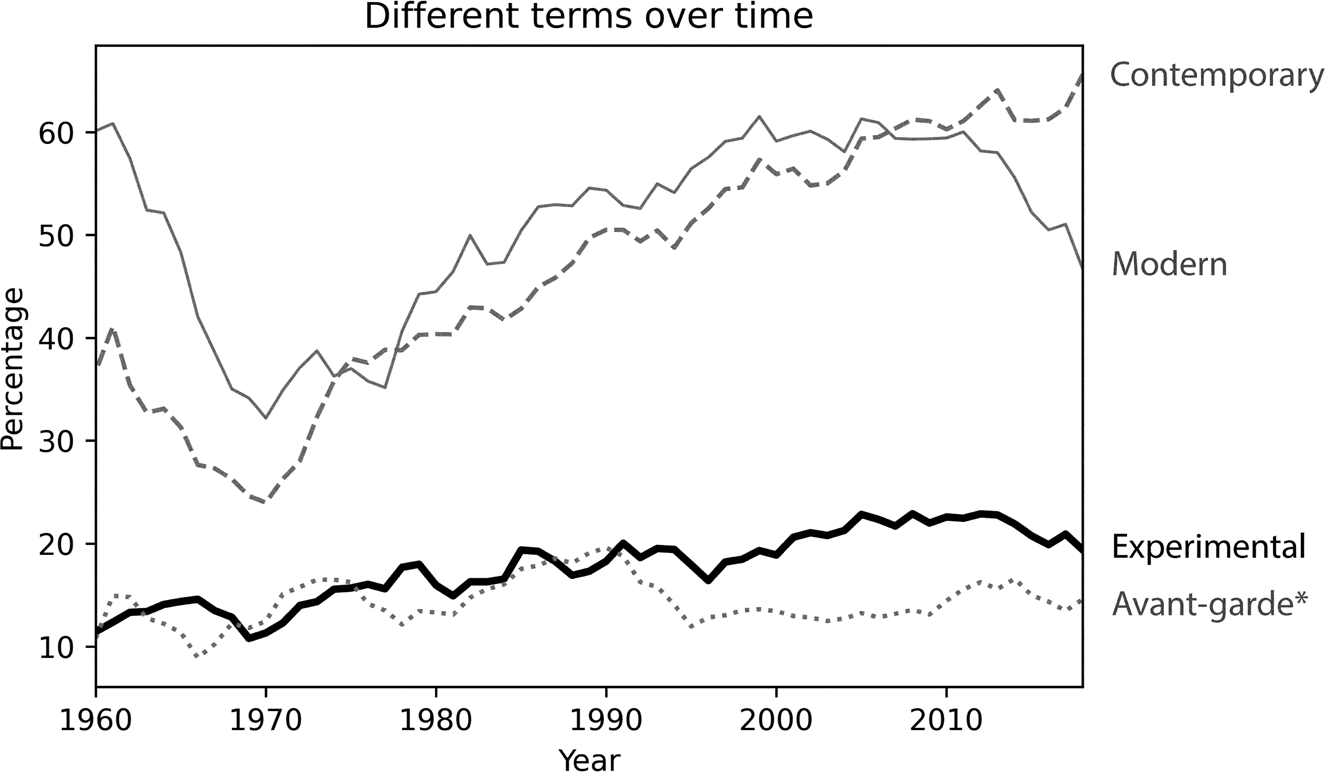
Figure 3. Percentage of articles per year that include the words “contemporary,” “modern,” “avant-garde*,” and “experimental” at least once. The lines indicate the five-year, centered moving average.
Given the trend described above, another question arises: Are the mentions of “experimental” consistent across the various journals? Figure 4 shows the arithmetic mean and standard deviation for the percentage of articles that include the word “experimental” across the different journals. There is some variation, from over 10 percent to 25 percent in the arithmetic means of the journals. Note that PAJ and Performing Arts Journal are treated as separate journals, even if there is a historical continuity between them. However, the mean and standard deviation of both journals is not substantially different, and jointly they include a larger percentage of articles with “experimental” than any other journal.
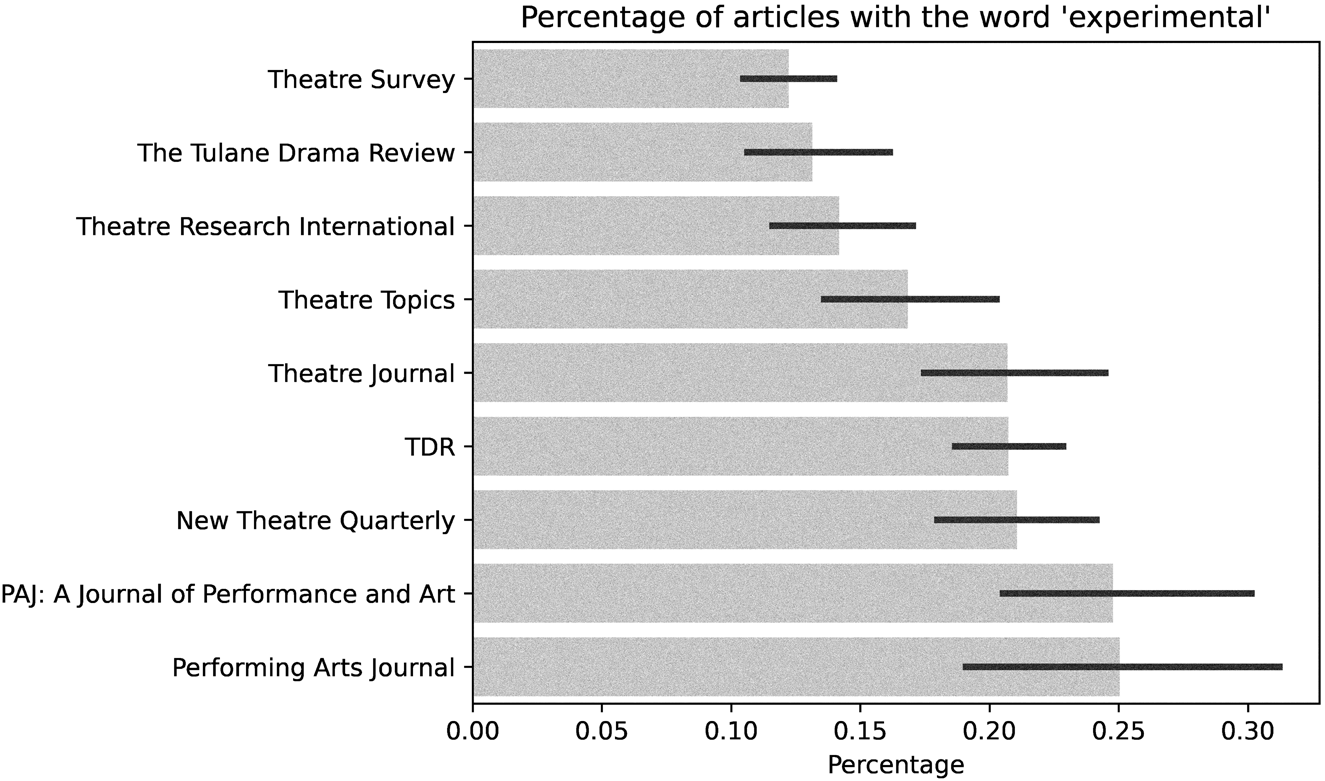
Figure 4. Percentages of yearly articles with the word “experimental” per journal. The gray bars indicate the arithmetic mean values, and the solid darker lines indicate the standard deviation. On the vertical axis, the journals are ordered by the arithmetic mean, from smaller (top) to larger (bottom).
Close Reading 3,051 Sentences
Besides analyzing the data above, which are directly accessible from the Constellate portal, I made an additional data request directly to the Constellate team, and they kindly provided me with a dataset of every sentence that uses the word “experimental” from all the theatre journals mentioned above. (They used the Python NLTK package to segment the articles into sentences.) The dataset included all sentences and unique identifiers, and I used these to remove all items that were discarded from the original dataset (duplicates and items that were not academic articles, as noted above).
After deduplication, the final dataset comprised 3,051 sentences. I then close-read each of these sentences and used the custom-built Python CLI described earlier to tag people, places, and theatre companies or collectives mentioned in those sentences semiautomatically. The identification of people, places, and companies in this manner is called Named Entity Recognition (NER). Many research projects, including some in digital humanities, often rely on automatic NER.Footnote 23 This works better for some fields than others—for example, identifying names of US politicians in news articles typically yields high accuracy.Footnote 24
I could have relied entirely on an automatic system for NER and estimated its accuracy (e.g., by manually tagging a random subset of the sentences and comparing it with the results of automatic NER in the same subset). I could then use this to estimate false positives and false negatives in the NER. I could determine that a result above a certain threshold (say, 80%? or 90%?) is acceptable. However, given that my dataset is still reasonably small and within a scale where manual inspection is possible (if labor-intensive), I decided to take a different approach. I used an automatic NER system (using the library spaCy) to flag potential NEs in each sentence and then manually verified each flagged named entity. Besides increasing accuracy, there is another important reason why I preferred this semiautomatic approach: I wanted to ensure that only NEs directly described in connection to experimental art were included. To this end, I first discarded sentences that referred to experimental science or experimental medical treatments (and there were more such sentences that I had previously imagined). Given the extensive references to other art forms, I decided to keep references not only to performance but also to literature, music, and film. If I had not read at least a subset of the sentences closely, I might have missed this characteristic of the dataset.
Second, I made a conscious decision to extract NEs only in the portion of a sentence that is about experimental art. Sometimes many people and places are described in the space of a single sentence, and I kept only those places and people directly and explicitly described as experimental. Consider this sentence in an article by Guillermo Gómez-Peña as an example:
The four-day Arty-Gras included art workshops for children, poetry readings, experimental video at Larry's Giant Sub Shop, performances by the Emperor Oko Nono and the Georgia Independent Wrestling Alliance, the Oakhill Middle School Band, the Haramee African Dance Troupe, Double Edge Dance and Music, and the Baldwin High School Concert Choir, and an exhibition by Chicano artist Robert Sanchez.Footnote 25
While many places, people and companies are mentioned here, only video is described as experimental. The only relevant NE is Larry's Giant Sub Shop. However, as I explain below, I was interested only in specific references to cities, countries, regions, and continents. I could have searched for the specific location of the Larry's Sub Shop under consideration, but I did not pursue this level of specificity. Gómez-Peña could have written this sentence in a way that explicitly stated the name of a city (say, Palm Beach Gardens, FL). In that case, I would have included the city as a NE. There is, in other words, some level of “noise” in the data. Ultimately, I am making claims about what scholars have written, not about the geographies of experimental theatre as such. In the same vein, it is important to note that I am reworking these sentences into data, for a purpose very different from their intended objective. Most likely, when writing these words, Gómez-Peña never imagined that someone would be using his sentence in the way I am doing now. In explaining this limitation, I seek full methodological transparency so that readers of this article can determine whether my approach is reasonable and useful—and so that other people interested in verifying or expanding my results can follow different paths in subsequent data projects.
Who Makes Experimental Work?
In spite of the limitations, I show that the data reveal fascinating trends about who is said to be making experimental work. But reaching these conclusions required additional layers of data cleaning and classification. In the sentences, people are often referred to by their last names. In cases where this happened—and where I could not determine the social identity of the person from the context—I read longer portions of the articles, and often additional sources, in order to ascertain the social identity of the person under consideration.
When evaluating potential people's names in the sentences, I chose only people who were described as artists and producers, rather than scholars whose ideas on experimental theatre were reported in the text. My focus was on the people involved in the creation of experimental art and performances, rather than on those who have theorized experimental theatre (which is also an interesting, but separate question). This means that I discarded Schechner when he was mentioned as a theorist, but not when he was described as an experimental director.
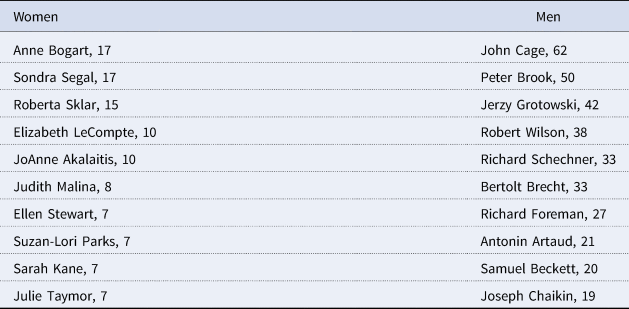
To calculate gender ratios, I included both proper names and pronouns. In some sentences people are described only by pronouns, and in those cases I used this pronoun information as proxy for gender. For proper names, I manually assigned each person to a social gender identity after individually researching each name. Sometimes people are referred to only by their last names, so I standardized all names after the initial process of semiautomated tagging. For this purpose, I again used FuzzyWuzzy to detect similar entities. In this case, the program matched partial ratios, when a string of text was identified within another string of text. This flagged “LeCompte,” “Elizabeth LeCompte,” and “Liz LeCompte” as potential matches. I manually verified every potential match before conflating them into a single standardized named entity and choosing a “canonical” name (“Elizabeth LeCompte” in the example above). Table 1 shows the ten women and men most often mentioned in the sentences. Figure 5 visualizes the ratio of women over time, both as raw percentages and as a five-year, centered moving average. This graph shows a steady increase in the percentage of women mentioned in connection to experimental work, with two “local peaks” in the 1980s and early 2000s. Shockingly, the percentage of women in the first two years was zero, and the percentage for any given year exceeded 50 percent only on two occasions.
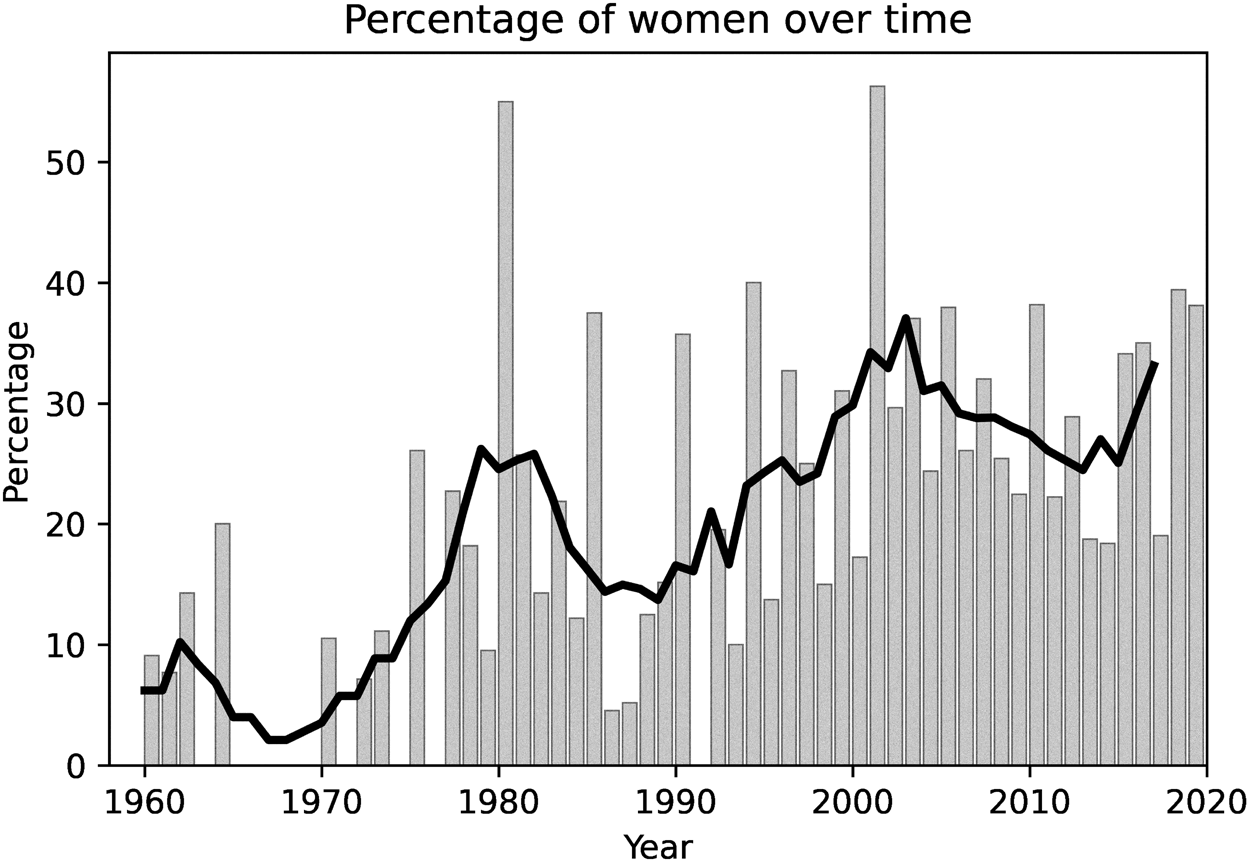
Figure 5. Percentage of women mentioned in sentences with the word “experimental.” The data combine proper nouns and pronouns. The bar plots indicate the raw percentages, and the solid line is the five-year, centered moving average.
Table 1. The ten women and men most often mentioned in the sentences
The gender imbalance is striking if not totally surprising.Footnote 26 It must be noted that the binary approach to gender would be woefully inappropriate for other types of question. Gender is a textured and complex category whose construction is the subject of intense academic and artistic attention, especially in experimental theatre. Why then, still classify gender in this way? As scholars, we can be committed both to a textured understanding of gender, and also to highlighting imbalances in the representation of women in art and academia.Footnote 27 When identifying the social identity of each person, I manually sought out information on each of them (as noted above, this often meant extensive additional research). I followed each person's explicit statements of their gender identity when this information was available in an attempt to avoid misgendering a person—but this was harder to do with historical data and for artists for whom little information is known. This caveat should be taken into account when evaluating this type of research. Gender is not the only contested term that computational approaches aim to model in a way that reduces the complexity of a phenomenon—race is another such term. That being said, sometimes reducing the complexity of a term for the purpose of data representation reveals important imbalances. An excellent example comes from Redlining Culture by Richard Jean So, a data history of publishing in the United States that reveals the overwhelming extent to which people of color are underrepresented in book publishing. As So notes, “quantification always means losing something; thinking about race with numbers risks reduction and reification,” but it can also enable detailed follow-up studies and reveal patterns that are easy to miss when we focus only on individual examples.Footnote 28 The same attitude guides the present investigation—a desire for precision, tempered by a recognition of the importance of nuance. This type of work encourages, rather than forecloses, more detailed attention at a different scale of analysis (individual works and careers), but also helps to reveal important patterns and omissions at the level afforded by data.
One limitation of focusing on individual people is that often the sentences do not discuss only single artists and producers, but also companies and collectives. As noted above, I also tracked mentions of theatre companies. As with peoples’ names, sometimes the same company can be referred to in multiple ways (e.g., “The Living” is sometimes a shorthand reference to “The Living Theatre”). For this reason, I applied the same type of verification and named entity resolution described above in connection to peoples’ names to the company data. Figure 6 shows the top ten most common companies and collectives mentioned in the sentences, and their distribution over time.
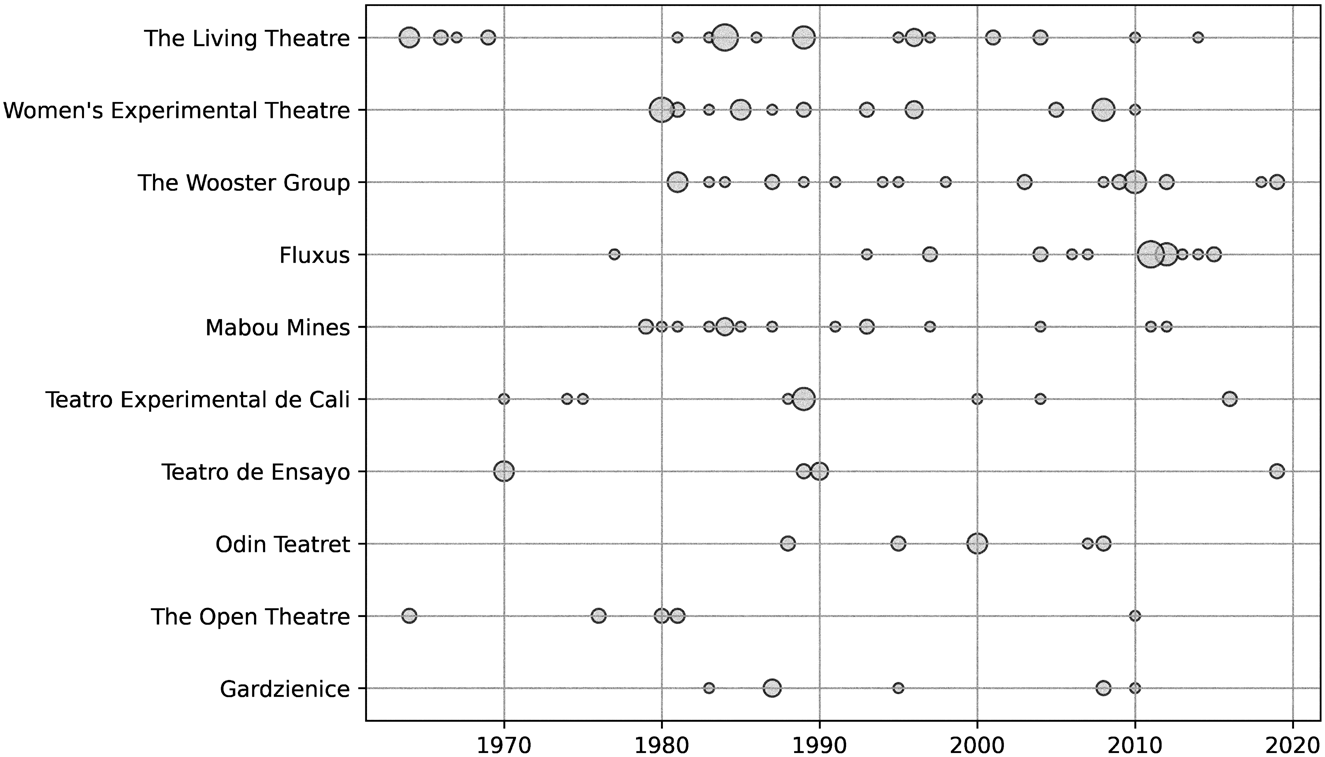
Figure 6. A bubble chart with the ten most common companies and collectives mentioned in the sentences. The horizontal axis shows the year of the mention. The diameter of the circles shows the comparative number of mentions in that given year. The companies/collectives are arranged in the vertical axis from the most common (top) to the tenth-most common (bottom).
The Women's Experimental Theatre, The Wooster Group, and Mabou Mines were all lead by women (and women have played crucial roles in others, such as The Living Theatre). But perhaps not surprisingly, the women associated with these companies are also the ones with the highest mentions in Table 1 (Sondra Segal, Roberta Sklar, Elizabeth LeCompte, JoAnne Akalaitis, and Judith Malina). We also see that two of the companies are outside of Europe/North America: Teatro de Ensayo (Chile) and Teatro Experimental de Cali (Colombia). However, looking at the distribution of the mentions over time shows that this is due to distinct bursts rather than continuous referencing. It is to this topic—the presence of artists and groups outside Europe and North America—to which I now turn.
The Shifting Geographies of Experimental Work
For named places, I identified cities, provinces, countries, continents, and larger cultural regions (e.g., Latin America). In a second stage, I classified each of these toponyms as being either located in Europe and North America, or outside these regions. I did not include theatre venues, even though some (e.g., LaMaMa Experimental Theatre Club) have been central to the history of experimental work, and terms such as Broadway, which refer to specific geographies. Figure 7 shows the percentage of places that are outside of Europe and North America in sentences with the word “experimental.” As before, this includes raw counts and the five-year, centered moving average.
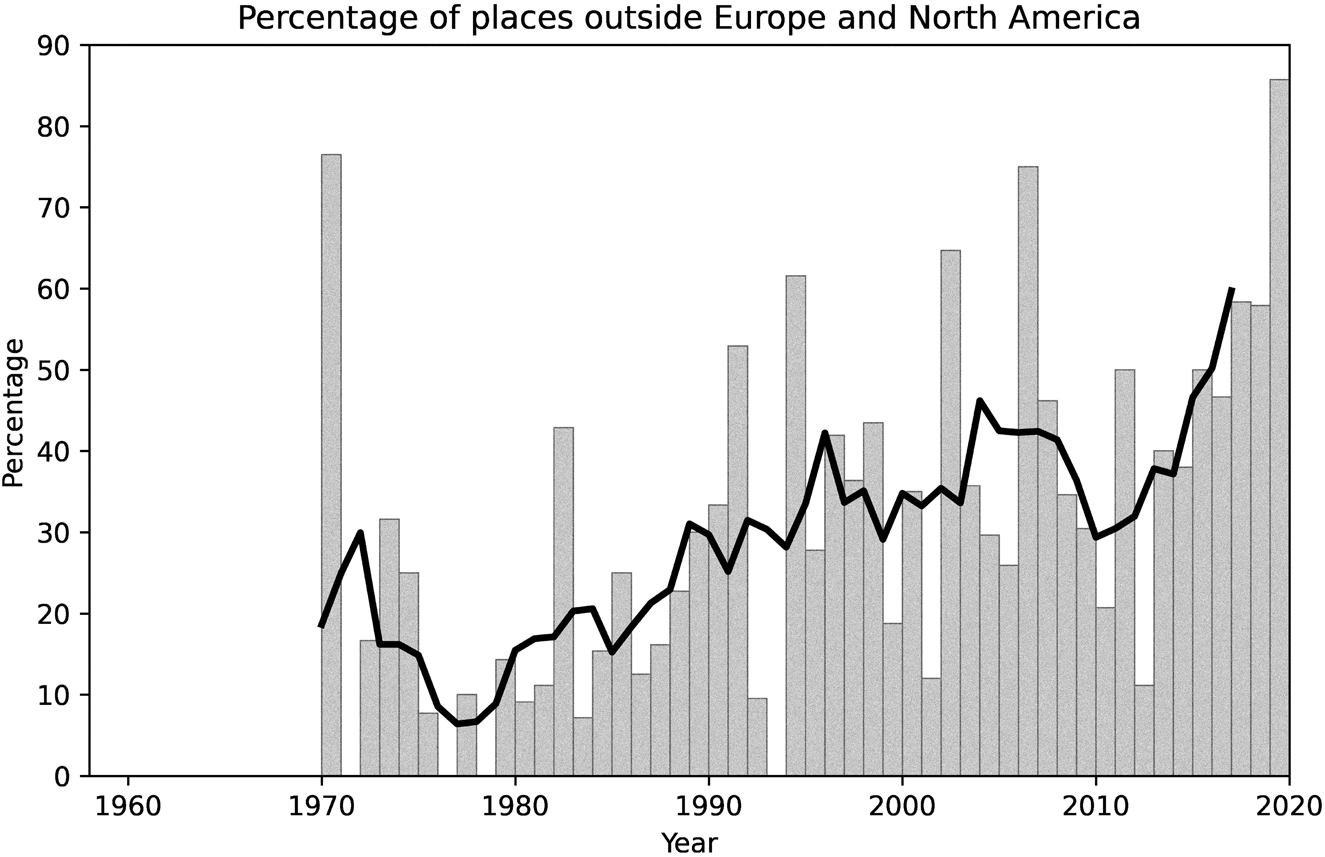
Figure 7. Percentage of places that are outside of Europe and North America in sentences with the word “experimental.” The bar plots indicate the raw percentages, and the solid line is the five-year, centered moving average.
The distinction between Europe/North America and “elsewhere” elides important differences (e.g., between Western and Eastern Europe), but, as in the case of gender, it helps shed light on histories of imbalance and change. As in the case of gender, this is a story of increased representation (see Fig. 7). Yet here, there were no mentions of any place outside Europe and North America before 1970—the first twelve years in the data. However, the increase in the presence of places outside Europe and North America is dramatic, with many years far exceeding 50 percent of all mentions, and becoming the norm in the last part of the 2010s. This steady increase could be due to the addition of journals to the dataset over time, as perhaps more recent journals had a more international orientation. To explore this alternative hypothesis, I plotted mentions of places outside Europe and North America in the Tulane Drama Review and TDR (which, combined, constitute the journal with the largest spread in the dataset), and compared this to all journals (Fig. 8). Both curves (moving averages) tell stories of increased geographical diversity, but this was more pronounced in TDR for most years, except for the most recent five, during which combined counts for all journals overtook TDR. An important caveat for interpreting this graph is that the Tulane Drama Review + TDR data are counted twice: both on their own and as part of the combined totals. The reason why this makes sense is that the objective of the visualization is to show that the trend of the oldest journal in this dataset is not significantly different from the overall trend. Hence, the reason for the increased geographic diversity is not that Tulane Drama Review is the only journal for which data are available in the first few years.
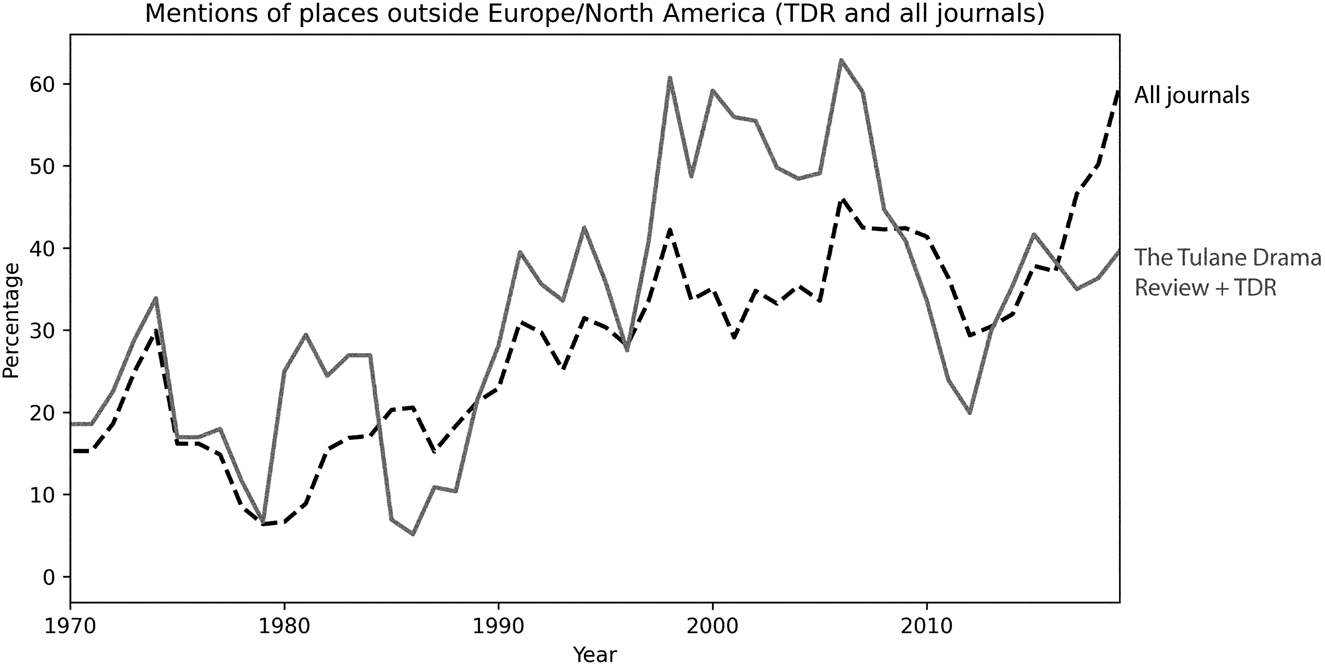
Figure 8. Percentage of places that are outside of Europe and North America in sentences with the word “experimental.” A comparison of all journals (dashed line) and Tulane Drama Review/TDR (solid line). Both lines represent five-year, centered moving averages.
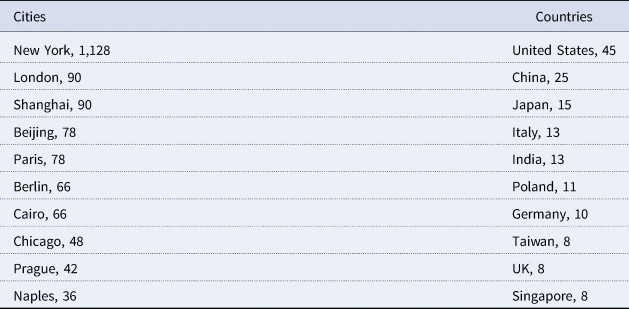
So far, I have described the increasing geographic diversification in broad brush strokes, but what are the specific places mentioned in the sentences? As for other named entities, I also did a semiautomatic verification and resolution, conflating a range of terms together (i.e., NYC and New York City). Table 2 displays the ten most common cities and countries, and Figure 9 plots all mentioned cities in a world map. Notably, New York is disproportionally more common, with more than a thousand mentions, all other cities being in the order of tens, and this frequency was not represented visually in the map. When manually classifying geographical entities, I also identified a series of “larger regions,” but only a handful are mentioned more than once (Europe, 16; Africa, 6; Latin America, 3; Caribbean, 2; North America, 2). The same is true for provinces/states (California, 7; Michigan, 7; Québec, 4; Fujian, 3; Flanders, 2; Bali, 2; Ohio, 2).
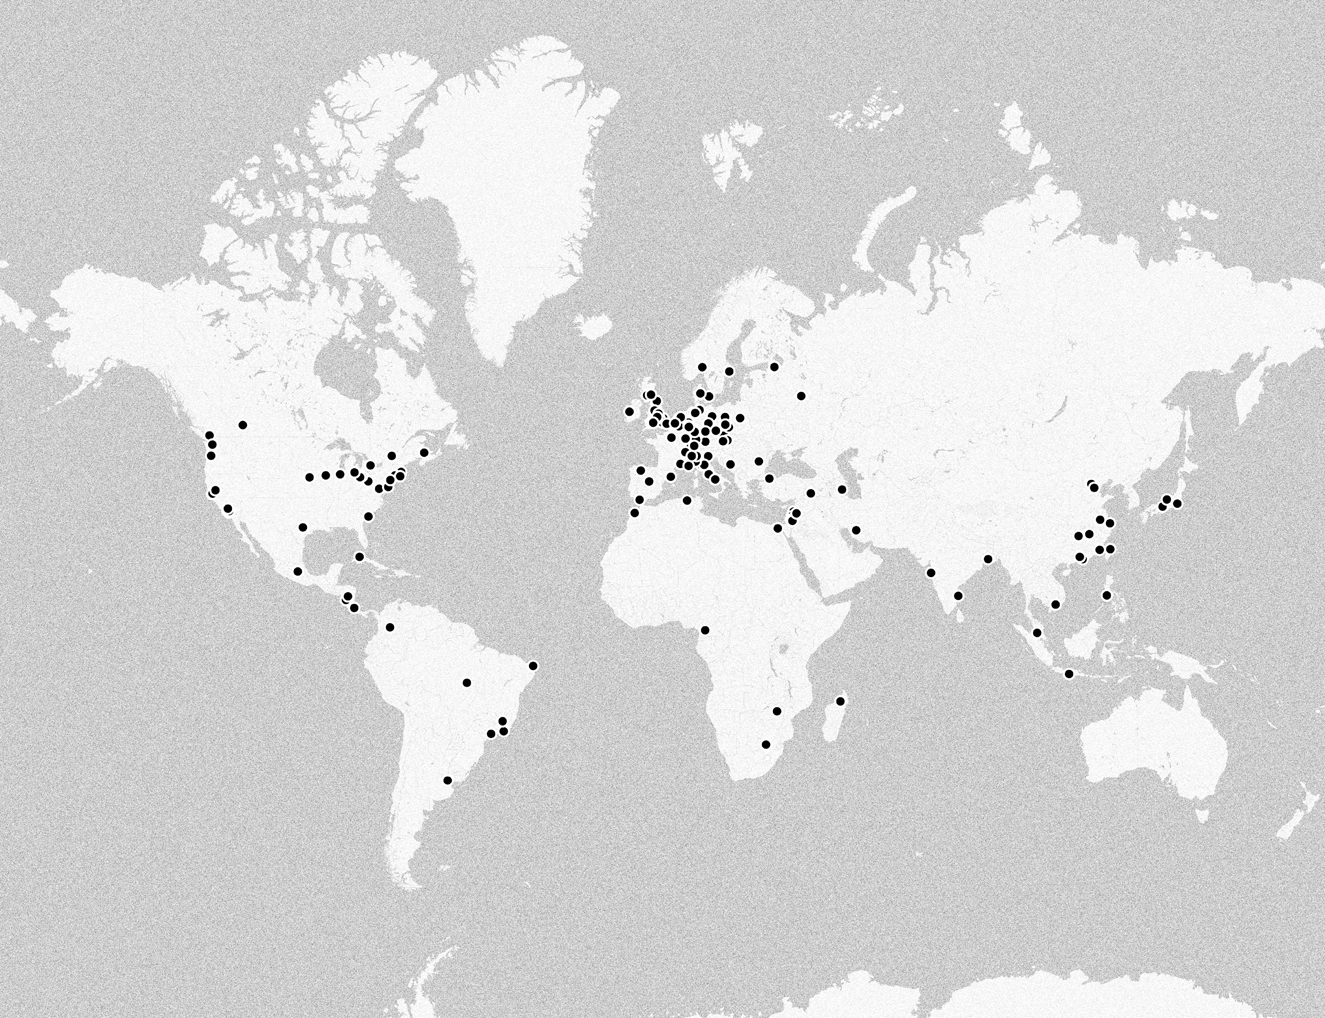
Figure 9. A map of all cities mentioned in sentences with the word “experimental.”
Table 2. The Ten Most Common Cities, Countries, and Regions in the Sentences
In comparison with the gender ratio visualization, here we see a clear dominance of places outside of “non-Western” spheres in more recent years. However, both the mentions of women and the mentions of places outside Europe and North America became increasingly common over time. Figure 10 places both trends side by side. We also see that, not only did the ratio of non-Western places increase at a faster pace, but it experienced its first peak much earlier. The reasons for these trends cannot be ascertained fully by the data collected here. My hope is that untangling the causal mechanisms of these patterns will prove a tantalizing question for other types of historical analysis in the future.
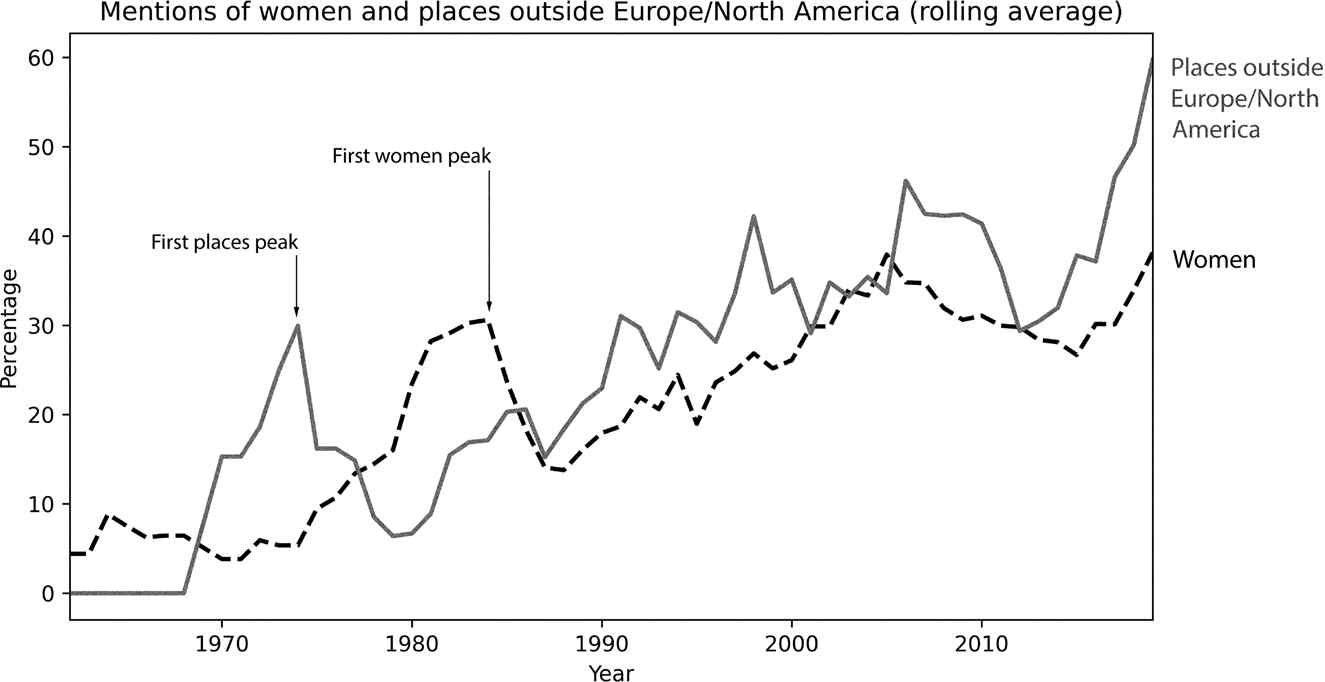
Figure 10. A comparison of the percentage of women and the percentage of places that are outside of Europe and North America in sentences with the word “experimental.” Both lines represent five-year, centered moving averages.
The data analyzed so far indicate that the scope of experimental theatre, as represented in scholarship, became increasingly diverse over time (even if men continue to be more associated with experimental work than women). What do these results mean for the history of experimental theatre? The current analysis doesn't seek to disprove previous claims in experimental theatre scholarship or to make extant histories of this term any less useful or accurate. But the data do reveal that, collectively, when we as scholars talk about experimental theatre, we still have a tendency to talk about men, even if we have widened the geographical scope of the term “experimental.” What shall we do with this information? Perhaps it can help us think more closely about our own biases and change the direction of our future scholarship. When we talk to our colleagues and students about experimental work, of whom are we thinking? Are we unconsciously conjuring up images of John Cage and Jerzy Grotowski? Or are we also choosing our words and examples in ways that ensure our audiences are also picturing Judith Malina and Julie Taymor?
As I bring this article to a close, I want to highlight once again the many assumptions that are baked into the current analysis. First, these trends are based on scholarship, not on actual performances as counted by playbills or critic's reviews, and it would be fascinating to compare these data to other sources. A good inspiration for doing this is Derek Miller's analysis of Broadway, which demonstrates how we can compare actual show data to plays that are included in canonical scholarly collections.Footnote 29 Articles published in the 1980s might describe performances from the 1920s. Second, these results are based on sentences in which the word “experimental” was used. Choices of how individual writers decided to split ideas into sentences have influenced these results in ways that are hard to track. Fourth, the named entities and their trends are the result of highly interpretive decisions, as I focused only on artists and producers rather than scholars.
Listing these assumptions, as I have done, helps limit and contextualize the scope of my results. However, it also strengthens the research inasmuch as it renders my decisions and shortcomings visible. Others might disagree with my interpretive decisions in the handling of my sources, and an important characteristic of data work is that these decisions can be described and disproved by subsequent research.
One question I still have, and that this article doesn't even begin to explore, is whether male artists are discussed more often than female artists in general, across all theatre scholarship. Are male scholars more likely to talk about male artists? Are younger scholars more sensitive to gender imbalances in their choice of examples? These are important questions that I hope we will take seriously as a discipline and bring the best of our methods to bear upon, from close reading to computational techniques.
The limitations of this piece of data history, which I have tried to communicate as candidly as possible, might also help other people imagine new avenues for research. For example, this article focuses on sentences, as this is easy for a systematic first case study. But what about artists whose work is described at length in a single article? Do we see the same trends in such cases? As one anonymous reviewer of this article suggested, we could also further contextualize these results with some other possible terms and find trends for named entities near words such as “mainstream,” “commercial,” or “Broadway,” to name a few. This might require more advanced computational techniques that justify recourse to machine learning. As I noted earlier, I preferred to eschew this approach here, given the relative smallness of my dataset. But if we seek to expand our attention to longer portions of scholarly texts, the dataset will be much bigger and the trade-off of size and precision might no longer lead to the same methodological choices.
This paper identified a moderate increase in the representation of women in sentences about experimental work, and a more dramatic increase in the global geographies represented in the same dataset. However, the extent to which this is an eminently positive development should also be scrutinized with critical attention. It would be reductive to assume that every single label (modern, contemporary, classical, etc.) should be increasingly diverse. Perhaps, as the objects of scholarly attention become wider, the labels should also become more varied. There is a danger in recycling old terms to describe new work. As Rosella Ferrari notes in her study of experimental theatre in China, it is important to trace the Eurocentric assumptions of constructs such as the “avant-garde” before uncritically applying them to other contexts.Footnote 30
A fuller commitment to tracking the diversification of scholarship requires more studies similar to the present one. If we, as theatre scholars, are so inclined, we would need a more general and expansive analysis of all artists and places that have been described in scholarship. This type of work has been developed in other fields (such as the aforementioned analysis of literary scholarship by Andrew Piper), and data can help us better understand the history, diversity, and omissions of our collective work as scholars. The type of computational work outlined here, which combines systematic interpretive attention at the level of individual instances with the explanatory power of visualizations, can also be applied to understand further the shape and history of theatre research.
When collecting the data, I had expected that both geographical and gender diversity would rise slowly over time. But I believed that, by the second decade of the twenty-first century, the majority of people mentioned in the scholarship would still be men, and the majority of places would still be in Europe and North America. I was right in my first hypothesis, but I stand happily corrected on the second. This is why data and quantification matter. People are naturally good at noticing changes, but the vagaries of time-based trends might elude us if we don't rely on numbers. We might thus be blind to positive developments, or inattentive to truly dire imbalances, which might be worse than we fear. In other words, the main advantage of quantitative studies is that they give precise contours to the vague shape of our intuitions.
Tackling important issues requires seeking precise data when possible, and considering sources of uncertainty when needed. At the time of this writing, recent historical events such as the COVID-19 pandemic and unprecedented floods in Europe and Asia have demonstrated all too well the challenges we face in areas such as public health and climate change. We might argue that the crises before us are evident even without looking at the numbers. But quantitative precision adds nuance and context to our impressions, and can help us better understand our current moment and our potential for future action. In the digital humanities, a particularly interesting example of data-supported strategies for real-world interventions is found in Verhoeven et al.'s use of simulations to model the impact of different policies that aim to bring greater gender equity and inclusivity to film production.Footnote 31 Empirical analyses backed by data cannot help but sharpen our perceptions and enhance our resolve to change what we see before us.
Miguel Escobar Varela is Assistant Professor of Theatre Studies at the National University of Singapore. His primary area of research, often in collaboration with scientists and engineers, is the application of computational methods—including textual analytics, network analysis, image and video processing, and geospatial analysis—to the study of theatre. He is also involved in the development of multimedia interfaces for theatre research. His publications include Theater as Data: Computational Journeys into Theater Research (University of Michigan Press, 2021) and articles in such journals as Theatre Research International, Asian Theatre Journal, Digital Scholarship in the Humanities, International Journal of Performance Arts and Digital Media, and Journal of Historical Network Research. A full list of publications and digital projects is available at https://miguelescobar.com.


 Open access