


Introduction
Glyphosate is the world’s most widely used herbicide, and as of 2018, glyphosate resistance has been reported in 41 species in 29 countries worldwide (Heap Reference Heap2018), although no cases have yet been described in the United Kingdom. Most glyphosate-resistant weeds occur in rotations in which genetically modified crops with tolerance to glyphosate are grown and in perennial crops or noncropped areas (e.g., orchards, vineyards, fence lines), where selection pressure for glyphosate-resistance evolution is high (Beckie Reference Beckie2011). Glyphosate use patterns in the United Kingdom mean that the inherent risk of glyphosate-resistance evolution is lower than in countries where glyphosate-tolerant crops are grown, as a relatively small fraction of the total weed population is exposed to glyphosate, thus reducing selection pressure (Neve et al. Reference Neve, Diggle, Smith and Powles2003). Additionally, in the United Kingdom, the use of glyphosate to control weeds before crop sowing is typically followed by cultivation and the application of other herbicide modes of action within the crop, so that initially rare resistant survivors are controlled by other means, reducing the risk of resistance evolution (Cook et al. Reference Cook, Wynn and Clarke2010; Neve Reference Neve2008).
However, glyphosate resistance has evolved globally in conventional arable cropping systems in which glyphosate use is similar to its use the United Kingdom—in fallow phases of the rotation and before crop sowing (Owen et al. Reference Owen, Martinez and Powles2014; Powles Reference Powles2008). The first European case of glyphosate resistance in arable cropping was reported in Lolium spp. (ryegrass) in Italy in 2014, where repeated low rates were applied before crop sowing (Collavo and Sattin Reference Collavo and Sattin2014). Clearly, there is precedence for evolution of glyphosate resistance associated with early-season use in conventional arable systems, raising concerns for the potential for glyphosate resistance evolution in UK weed species.
Glyphosate was first used commercially in the United Kingdom in 1974 (Moss Reference Moss2017a), but over the past two decades its use has increased drastically, particularly in arable cropping systems. In 1995, 324,000 ha of arable land were treated with glyphosate, but by 2016 this had increased to 2,665,000 ha (Garthwaite et al. Reference Garthwaite, Barker, Ridley, Mace, Parrish, MacArthur and Lu2018). This increase in glyphosate use is due to several factors, including the loss of paraquat, which was banned in the European Union in 2007 (Chauvel et al. Reference Chauvel, Guillemin, Gasquez and Gauvrit2012; Clark Reference Clark2012), increasing herbicide resistance to other modes of action in the United Kingdom (Hicks et al. Reference Hicks, Comont, Coutts, Crook, Hull, Norris, Neve, Childs and Freckelton2018; Moss Reference Moss2017b; Moss et al. Reference Moss, Marshall, Hull and Alarcon-Reverte2011), and a reduction in the cost of glyphosate since 1993 (Woodburn Reference Woodburn2000). Together, these factors have led to greater glyphosate usage and, consequently, have increased the risk of glyphosate resistance in the United Kingdom, particularly in weeds that are becoming more prevalent in arable farming situations.
Poverty brome (Bromus sterilis L.) [sterile or barren brome, syn. Anisantha sterilis (L.) Nevski] has emerged as a problematic UK weed over the past 40 yr (Smart et al. Reference Smart, Bunce, Marrs, LeDuc, Firbank, Maskell, Scott, Thompson and Walker2005) due to the increased adoption of minimum tillage, an increase in winter cereal production, and a lack of effective herbicides for control of brome species (Bromus spp.) (Clarke Reference Clarke2000; Escorial et al. Reference Escorial, Loureiro, Rodriguez-Garcia and Chueca2011). Bromus sterilis usually infests field margins, but it also invades fields, with severe infestations causing yield losses in cereal crops of up to 45% (Peters et al. Reference Peters, Froud-Williams and Orson1993). Due to the short persistence of seeds in the soil (<2 yr), infestations can be effectively controlled through seed burial by plowing; however, high uptake of minimum tillage has reduced the use of this agronomic tool. Consequently, glyphosate is often used to control B. sterilis populations before crop sowing. In this situation, glyphosate selection pressure is higher than for other grass weed species, as individual B. sterilis plants produce seeds with low dormancy and high levels of early-season germination, exposing most of the emerging population to glyphosate selection (Green et al. Reference Green, Barker, Marshall, Froud-Williams, Peters, Arnold, Dawson and Karp2001; Lintell Smith et al. Reference Lintell Smith, Freckleton, Firbank and Watkinson1999; Neve Reference Neve2008; Steinmann and Klingebiel, 2004).
There are no current reports of herbicide-resistant B. sterilis populations in the United Kingdom, but populations resistant to acetolactate synthase inhibitors have been reported in France and to acetyl CoA carboxylase inhibitors in Germany (Heap Reference Heap2018). In Australia, there are, however, glyphosate-resistant populations of ripgut brome (Bromus diandrus Roth) and red brome (Bromus rubens L.) that infest wheat (Triticum aestivum L.) crops and fallow land, respectively (Heap Reference Heap2018). Some Australian B. diandrus populations have been found to have an increased EPSPS gene copy number, which can cause glyphosate-resistant individuals to survive five times the dose used to control wild-type individuals (Malone et al. Reference Malone, Morran, Shirley, Boutsalis and Preston2016).
Considering the prevalence of herbicide-resistant weeds to multiple mechanisms of action in the United Kingdom (Hicks et al. Reference Hicks, Comont, Coutts, Crook, Hull, Norris, Neve, Childs and Freckelton2018; Moss Reference Moss2017b; Moss et al. Reference Moss, Marshall, Hull and Alarcon-Reverte2011) and the increasing glyphosate selection pressure, it has become important to take a proactive approach to monitoring risks of glyphosate resistance in prominent weeds such as B. sterilis. Herbicide resistance is the inherited ability of a plant to survive and reproduce following exposure to a dose of herbicide normally lethal to the wild type (Vencill et al. Reference Vencill, Nichols, Webster, Soteres, Mallory-Smith, Burgos, Johnson and McClelland2012), but there are no clearly defined means to designate when a population becomes resistant. Given the importance of glyphosate for weed control and the global precedent for evolution of glyphosate resistance, it is increasingly important to identify the early stages of resistance evolution by demonstrating that (1) suspected resistant plants survive significantly higher doses than neighboring unsprayed populations and (2) populations with reduced glyphosate sensitivity lie outside the range of normal variation in sensitivity expressed among a range of populations of the study species.
Here, we report a series of experiments that confirm evolving resistance to glyphosate in B. sterilis populations from the United Kingdom. These results highlight the importance of a proactive approach to monitoring risks of glyphosate resistance before reports of full field resistance in UK weed populations.
Materials and Methods
Plant Material
In 2010, a report was received from an arable farm near Oakham, Rutland, in central England, of inadequate control of B. sterilis by glyphosate in a postharvest stubble. Mature seeds were collected from surviving plants, and seedlings were exposed to 270 g ai ha−1 glyphosate (50% of the recommended UK use rate). Six surviving individuals were grown to maturity, and seed was collected. The progeny of these six surviving individuals became the SEL-R population. In 2012, B. sterilis seeds of an additional population were received from a field near Charlbury, Oxfordshire (OXON-R) after a report of inadequate control with glyphosate. This field was about 100 km from SEL-R.
Populations adjacent to SEL-R and OXON-R that had no historical exposure to glyphosate were identified. The SEL-S population was collected from a roadside within 500 m of the field where the SEL-R population originated. OXON-S was collected from a hedgerow about 100 m from the OXON-R field collection site in 2013.
A glyphosate-exposed but previously confirmed sensitive (SM, unpublished data) B. sterilis population (ADAS) collected from Extra Close field at ADAS Boxworth, Cambridgeshire, was used as a reference population for glyphosate sensitivity assays. The remaining 30 B. sterilis populations used in this study were provided by ADAS Boxworth from collections made between 2007 and 2011 across 16 UK counties for studies on seed dormancy, with none of the populations having been reported to be poorly controlled by glyphosate.
Glyphosate Sensitivity Screen for Suspected Resistant and Sensitive Field Populations
An initial screen of the glyphosate sensitivity of SEL-R, SEL-S, OXON-R, and the ADAS reference population was performed. Seeds were pre-germinated by sowing into Petri dishes (90 mm) containing two 90-mm filter papers and deionized water (5.5 ml). Petri dishes were placed in a growth cabinet (Sanyo MLR-350) (Wolf Laboratories Limited, Colenso House, 1 Deans Lane, Pocklington, YORK, YO42 2PX) for 6 d with a 14-h light (17 C) and 10-h dark (11 C) photoperiod. After 6 d, seven germinated seeds were sown into 90-mm plastic pots containing sterilized Kettering loam soil and lime-free grit (3 to 6 mm) in a 4:1 ratio, with the addition of Osmocote fertilizer (2 kg m−3). Pots were placed in an unheated glasshouse with supplementary lighting. There were five replicate pots for each of the four populations and two herbicide-dose and untreated control combinations. Glyphosate doses were 360 and 540 g ha−1 (540 g ha−1 being the recommended field rate in the United Kingdom for control of annual grass weeds on stubbles). Pots were arranged in five blocks within the glasshouse, with split plots for herbicide dose (four pots for each block by herbicide dose were placed in a single seedling tray). Tray location was randomized within each block. At 5 d after sowing, the number of plants per pot was reduced to five to ensure that all pots contained the same number of plants.
At 23 d after sowing, when plant size was between 5 leaves and 2 tillers (growth stages [GS] 15 to 22), plants were treated with glyphosate (Clinic Ace, NuFarm; aqueous solution of the isopropylammonium salt glyphosate, 360 g L−1), using a laboratory track sprayer, with a TeeJet® 110015VK flat-fan ceramic nozzle, at a pressure of 228 kPa and a water volume of 208 L ha−1. After being sprayed, plants were returned to the glasshouse compartment and not watered for 24 h. At 35 d after glyphosate treatment, all plant material was cut at soil level, and fresh weight measurements were taken.
Glyphosate Sensitivity Screen for 35 Bromus sterilis Populations
Following confirmation of glyphosate sensitivity in the SEL-S and ADAS populations and reduced glyphosate sensitivity in the SEL-R and OXON-R populations, a more comprehensive glyphosate screen, including a further 30 field-collected populations and a population (OXON-S) collected near the location of OXON-R, was carried out. This experiment sought to determine whether the suspected resistant populations demonstrated reduced glyphosate sensitivity in comparison to a broader range of field populations. To improve discrimination between populations in their response to glyphosate in this glasshouse experiment, a dose of 270 g ha−1 (half the recommended field rate of glyphosate for annual grass weeds in the United Kingdom) was used.
Seeds were pre-germinated (as described earlier), and after 5 d, five germinated seeds were sown into 90-mm plastic pots as described earlier. There was one glyphosate treatment (270 g ha−1) plus an untreated control, 35 populations, and four replicate pots per treatment. For each glyphosate dose, individual pots (populations) were randomly arranged in a single seedling tray, giving two trays per replicate. The four replicates were arranged as blocks within the glasshouse, with the position of the two trays randomized within blocks. Glasshouse conditions were identical to those of the previous experiment. Plants were watered as required.
At the 3- to 4-leaf growth stage (GS 13 to 14), plants were thinned to four plants per pot, with individuals smaller or larger than 3 to 4 leaves removed. Five days later, plants were treated with glyphosate at 270 g ha−1 (Clinic Ace, NuFarm) using a laboratory track sprayer, with a TeeJet® 110015VK flat-fan ceramic nozzle, at a pressure of 210 kPa and a water volume of 194 L ha−1. After being sprayed, plants were returned to the glasshouse compartment and not watered for 24 h. At 21 d after glyphosate treatment, plants were cut at soil level. Plant material from each pot (population*dose*replicate combination) was placed in an individual paper bag. Paper bags were placed in a drying oven (70 C) for 72 h before dry weight was measured.
Glyphosate Dose–Response of 11 Bromus sterilis Populations
A dose–response assay of 11 populations was conducted to further quantify the variability in glyphosate sensitivity in B. sterilis populations. SEL-S, OXON-S, and ADAS were used as sensitive controls, and based on results from the glyphosate sensitivity screen, 09D118, SEL-R, OXON-R, 10D82, 08D59, 09D34, 09D87, and BBRED07 were included as less sensitive populations. The experimental setup and conditions for the dose–response experiment were as described earlier, except that seven glyphosate doses (81, 121.5, 162, 270, 405, 540, and 810 g ha−1) were used plus an untreated control, with four replicates. For each glyphosate dose, individual pots (populations) were randomly arranged in a single seedling tray, giving eight trays per replicate. The four replicates were arranged as blocks within the glasshouse, with the position of the eight dose trays randomized within blocks. At 21 d after glyphosate treatment, plant mortality was assessed, and plants were cut at soil level for dry weight assessment, as described earlier.
Statistical Analysis
Initial Glyphosate Sensitivity Testing
Fresh weight was analyzed using two-way ANOVA analysis (R v. 3.2.4). Factors were population and dose; replicate (block) was used an error term. Following ANOVA, Tukey’s HSD was calculated to determine whether there were significant pairwise differences in glyphosate sensitivity between SEL-R and SEL-S and OXON-R and ADAS, respectively.
Glyphosate Screen of 35 Bromus sterilis Populations
Glyphosate sensitivity (percent control) was assessed for each population by expressing the dry weight at 270 g ha−1 as a percent of the dry weight of untreated controls. These data were logit transformed, and a one-way ANOVA was performed in GenStat (Release 16.1). Population was a factor and replicate was an error term (block). Pairwise Tukey’s HSD tests were performed to compare percent control of the paired populations OXON-R and OXON-S and SEL-R and SEL-S.
To determine whether the percent control of the suspected resistant populations at 270 g ha−1 was significantly different from the mean response among sensitive populations, a normal distribution was fit to the mean percent control of the sensitive populations. Subsequently, Z-tests were performed to determine whether the response of suspected resistant populations was significantly different from the mean response of sensitive populations.
Dose–Response Analysis
Dose–response models were fit to the data using the drc package in R (v. 3.2.4). Survival data for the dose–response experiment were assessed by fitting models with binomial endpoints. Dry weight data were fit to four-parameter models. Lack-of-fit F-tests (model fit) were performed to assess model fit.
A two-parameter binomial Weibull-2 model was selected to model survival data for 10 of the 11 populations. For the population 09D118, a three-parameter Weibull-2 model was used, as the data did not fit a two-parameter model due to high survival at the highest dose used. For dry weight data, a log-logistic four-parameter model with a constrained slope was used. As the residuals were not normally distributed, the model and residuals were transformed using a Box-Cox transformation.
Following model selection and simplification, ED50 and ED90 (estimated dose) values for survival data and GR50 (growth rate) values for dry weight data were calculated. The SI function (t-test) in the drc package was used to determine significant differences between estimated ED values to identify significant differences in parameter estimates between populations and to estimate the resistance indices (Ritz et al. Reference Ritz, Baty, Streibig and Gerhard2015).
Results and Discussion
Several factors suggest that SEL-R, OXON-R, and an additional population (09D118) have evolved reduced sensitivity to glyphosate. First, this study originated as a complaint from a farmer about repeated, inadequate control in the field following treatment with the rate of glyphosate (540 g ha−1) recommended for control of this weed postharvest in the United Kingdom. Second, evidence for poorer control was found consistently in all experiments. Third, at the SEL-R and OXON-R sites, populations collected from nearby areas that had never been treated with glyphosate showed no evidence of insensitivity. Finally, the populations exhibited insensitivity outside the range of “normal” sensitivity assayed in a large collection of UK populations. However, the degree of difference in glyphosate control between the three highlighted populations and sensitive populations was quite modest.
In initial glyphosate sensitivity screening, fresh weight varied significantly between populations (F-value=10.38, P<0.001), with a significant interaction between population and dose (F-value=2.40, P<0.05), indicating that populations responded differently to increasing doses of glyphosate (Figure 1). For both SEL-R and OXON-R, there were no significant differences in fresh weight of glyphosate-treated plants at 360 g ha−1 in comparison with the control treatment. At 540 g ha−1, OXON-R showed no significant difference in fresh weight between treated and untreated plants, but the fresh weight of treated SEL-R plants was significantly lower than that of untreated plants (P<0.001). The sensitive ADAS and SEL-S populations were both well controlled by the highest glyphosate dose, but only partially controlled by the 360 g ha−1 dose. Pairwise comparisons between the SEL-S and SEL-R populations indicated no significant difference in fresh weight at 360 g ha−1, but at 540 g ha−1 fresh weight was significantly higher for SEL-R (P<0.05). A similar result was observed when comparing the OXON-R and ADAS populations (P<0.05) (Figure 1).
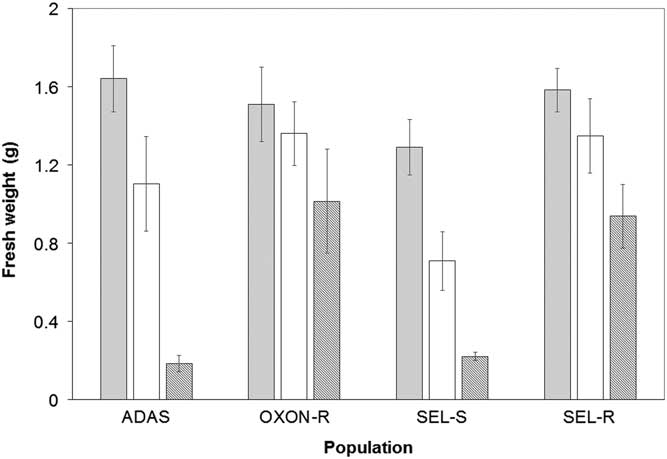
Figure 1 Mean foliage fresh weight per plant (g) for suspected glyphosate-resistant (OXON-R and SEL-R) and glyphosate-sensitive (ADAS and SEL-S) populations of B. sterilis following glyphosate treatment: untreated control (gray), 360 g ha−1 (white), and 540 g ha−1 (dark gray). Error bars are standard error of the mean.
To provide further evidence that the SEL-R and OXON-R populations are adapting to glyphosate selection, their response to glyphosate was subsequently compared with a broader range of B. sterilis field-collected populations. Glyphosate screening of suspected resistant populations, adjacent untreated populations, and an additional 30 sensitive populations confirmed that glyphosate sensitivity varies significantly among UK populations of B. sterilis. The mean foliage dry weight per pot treated at 270 g ha−1 glyphosate for each population ranged from 0.88 to 1.69 g in control treatments and from 0.2 to 1.1 g in treated pots. Mean percent control (dry weight of treated plants/dry weight of control plants) varied significantly between populations (F-value=6.94, P-value<0.001) (Figure 2). Pairwise comparisons of the suspected resistant (SEL-R and OXON-R) and adjacent sensitive (SEL-S and OXON-S) populations indicated that there were significant differences in glyphosate sensitivity (P<0.05), confirming results reported in the preliminary sensitivity screen. In addition to OXON-R and SEL-R, another suspected resistant population, 09D118, was found to have low percent control (Figure 2).
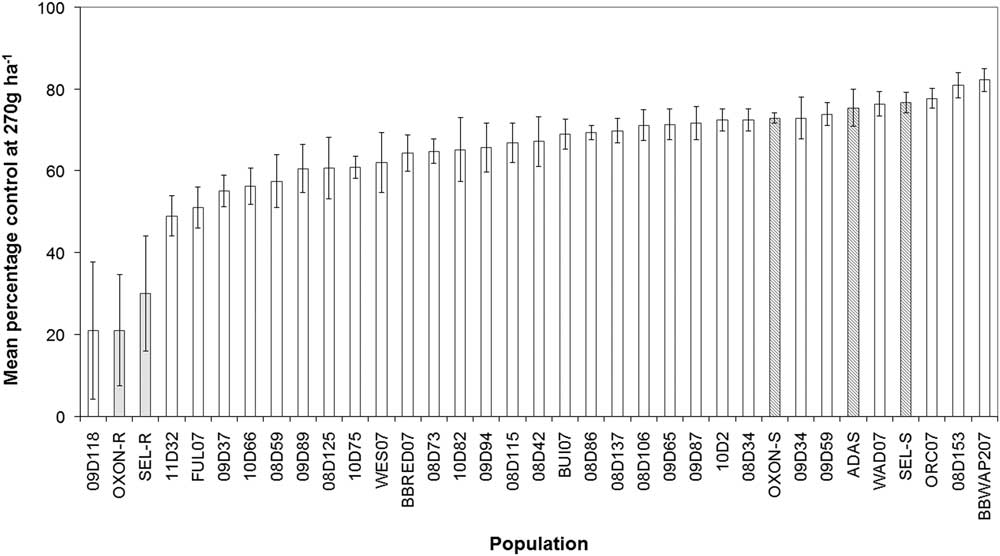
Figure 2 Percentage reduction in foliage dry weight relative to untreated controls for 35 UK B. sterilis populations treated with 270 g glyphosate ha−1. Shaded bars represent sensitive (dark gray) and suspected resistant (gray) populations based upon the initial glyphosate screen. Error bars are standard error of the mean.
To determine whether the three suspected resistant populations responded significantly differently to the remaining B. sterilis populations, a normal distribution was fit to the mean percent control values of the remaining 32 populations (mean=68%, SD=8.3%). Z-tests showed that for all three suspected resistant populations, glyphosate sensitivity was significantly reduced compared with the 32 sensitive populations (P<0.01), providing further evidence that populations SEL-R (30% control), OXON-R (21%), and 09D118 (21%) sit outside the normal distribution of glyphosate sensitivity for B. sterilis and being indicative that these populations have evolved reduced sensitivity to glyphosate.
A final dose–response experiment was performed to explore in greater detail the response of these three suspected resistant populations in comparison to a subset of the glyphosate-sensitive populations. Dose–response model fitting for survival indicated that both ED50 (likelihood ratio [LR] value=35.85, P<0.001) and slope (LR value=69.79, P<0.001) varied significantly between the populations, further confirming that there are significant differences in glyphosate sensitivity in UK B. sterilis populations. ED50 values ranged from 241 to 821 g glyphosate ha−1 (Figure 3), and ED90 values ranged from 283 to 1,081 g ha−1. There were no significant differences in ED50 values between the seven most sensitive populations, with ED50 values ranging between 241 and 283 g ha−1 (Figure 3), and ED90 values ranging between 283 and 370 g ha−1. Although BBRED07 was classified as glyphosate sensitive, its ED50 (313 g ha−1) was significantly higher than estimated for the 08D59 (P<0.05), 09D34 (P<0.01), and ADAS (P<0.001) populations. BBRED07 also had a higher ED90 value of 466 g ha−1.
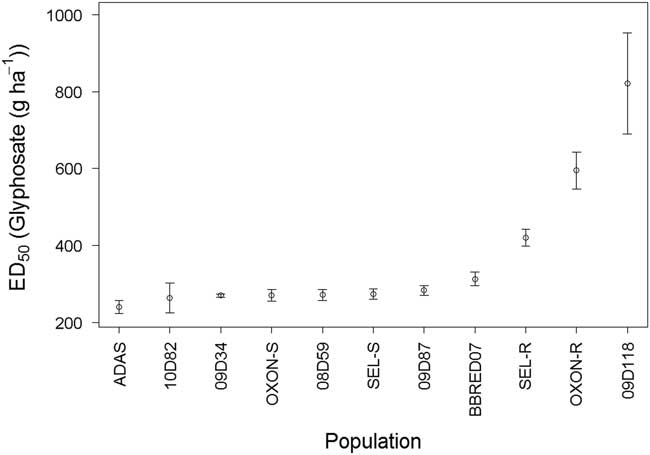
Figure 3 Calculated glyphosate ED50 values for 11 field-collected B. sterilis populations from the United Kingdom. Error bars are standard error of ED50 parameter estimates.
ED50 values for SEL-R (420 g ha −1), OXON-R (595 g ha−1), and 09D118 (810 g ha−1) were all significantly higher compared with the remaining eight populations tested, including BBRED07 (P<0.001). ED90 values for SEL-R (584 g ha−1) and OXON-R (1081 g ha−1) were also significantly higher (P<0.001) than those of the sensitive populations. ED90 could not be calculated for 09D118, as survival was 50% at the highest dose of 810 g ha−1.
Both OXON-R and SEL-R had significantly higher ED50 (P<0.001) and ED90 (P<0.01) values when compared with OXON-S and SEL-S. Although SEL-R and SEL-S are significantly different, their resistance index is low (1.55) (Figure 4A). The resistance index for OXON-R relative to OXON-S was higher, at 2.2 (Figure 4B). No unexposed, adjacent population was assessed for the population with the highest ED50, 09D118. However, the resistance indices for 09D118 compared with the unexposed OXON-S and SEL-S are 3.05 and 3.02, respectively, and 4.48 compared with the most sensitive population, ADAS (Figure 4C). Therefore, considering the results of these experiments, we conclude that there has been a significant reduction in glyphosate sensitivity of both the OXON-R and SEL-R populations, with OXON-R having an ED50 value more than two times higher than the unexposed OXON-S population, and that it is highly likely that 09D118 has also responded to glyphosate selection pressure in UK field situations.
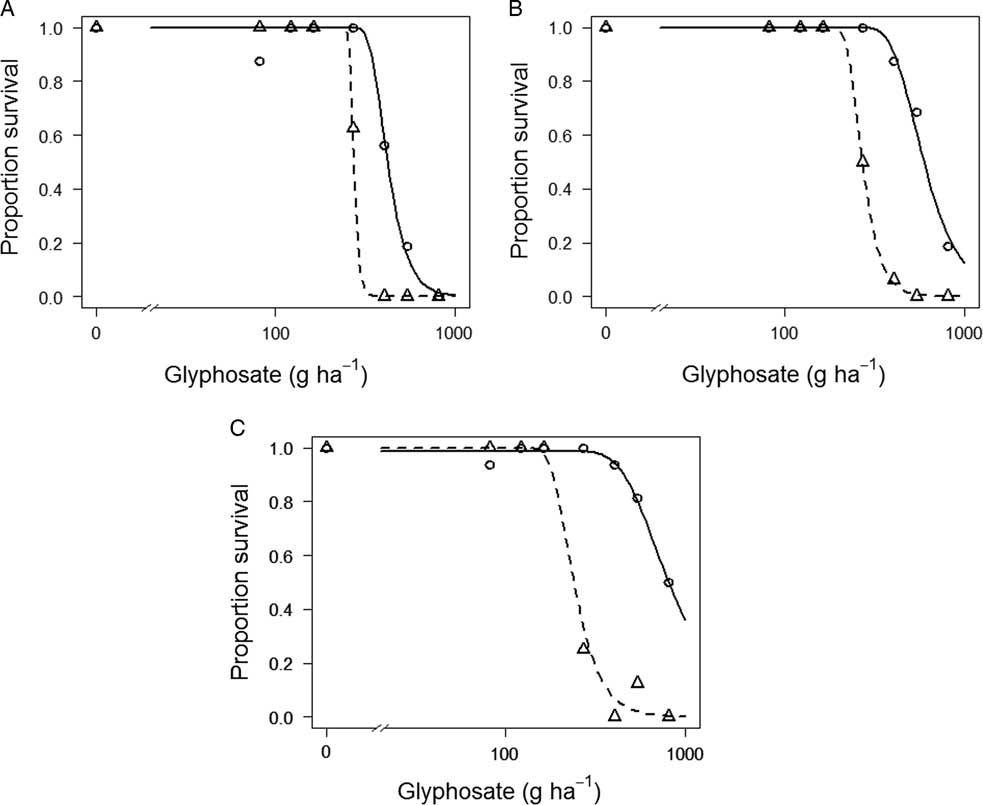
Figure 4 Glyphosate dose–response curves for survival of three suspected glyphosate-resistant B. sterilis populations (SEL-R, OXON-R, and 09D118) and three glyphosate-sensitive populations (SEL-S, OXON-S, and ADAS). Symbols represent mean observed survival data, and lines are fitted regression models. (A) SEL-R (continuous line) and SEL-S (dashed line); (B) OXON-R (continuous line) and OXON-S (dashed line); and (C) 09D118 (continuous line) and ADAS (dashed line).
Foliage dry weight GR50 varied significantly (F-value=6.78, P<0.001) between the populations, but slope did not (F-value=0.2217, P=0.9226) and was therefore constrained to a single value during model selection. GR50 values ranged from 143 to 307 g glyphosate ha−1 (Figure 5). ADAS had a significantly lower GR50 (P<0.05) compared with all other populations, and 09D34 had a significantly lower GR50 compared with BBRED07 (P<0.01), 08D59 (P<0.01), 09D118 (P<0.001), SEL-R (P<0.001), and OXON-R (P<0.001). OXON-R, SEL-R, and 09D118 all had significantly higher GR50 values than the remaining eight populations tested (P<0.05) (Figure 5), confirming that these three populations sit outside the range of glyphosate sensitivity of other UK B. sterilis populations for both survival and foliage dry weight.
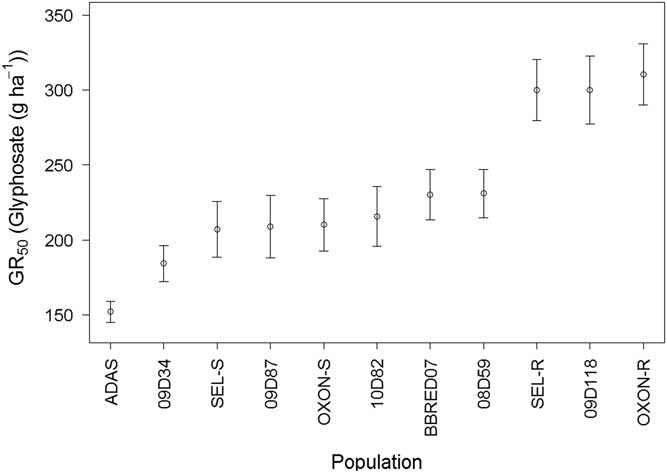
Figure 5 Calculated glyphosate GR50 values from log-logistic dose–response model of 11 field-collected B. sterilis populations from the United Kingdom. Error bars are standard error of GR50 parameter estimates.
SEL-R (P<0.001) and OXON-R (P<0.001) had significantly higher GR50 values compared with SEL-S and OXON-S, with resistance indices of 1.40 and 1.48, respectively, confirming that there has been a significant decrease in glyphosate sensitivity in both populations. The resistance indices for 09D118 compared with SEL-S (P<0.01), OXON-S (P<0.01), and ADAS (P<0.001) were 1.41, 1.37, and 1.97, respectively.
These dose–response analyses confirm that populations SEL-R, OXON-R, and 09D118 are significantly less sensitive to glyphosate and are responding to glyphosate selection. However, the dry weight resistance indices are much lower than those of the survival resistance indices, indicating that these populations have reduced sensitivity to glyphosate, and strongly suggest that these populations are in the process of evolving glyphosate resistance. This is the first reported case of reduced glyphosate sensitivity in any UK weed species and in B. sterilis worldwide (Heap Reference Heap2018).
The reduced sensitivity of the suspected resistant populations was greater than reported in a number of previous studies that have identified significant variation in glyphosate response in sensitive weed populations. Davies and Neve (Reference Davies and Neve2017) reported ED90 values in UK blackgrass (Alopecurus myosuroides Huds.) ranging from 354 to 610 g ha−1. Burgos et al. (Reference Burgos, Shivrain, Scott, Mauromoustakos, Kuk, Sales and Bullington2011) found percent injury at 400 g ha−1 varied from 41% to 100% between weedy red rice (Oryza sativa L.) populations. Barroso et al. (Reference Barroso, Loureiro, Escorial and Chueca2010) found I50 (the herbicide dose resulting in 50% reduction of biomass or survival) values for baseline sensitivity in B. diandrus ranged between 85 and 117 g ha−1, and Escorial et al. (Reference Escorial, Loureiro, Rodriguez-Garcia and Chueca2011) found reduction in fresh weight at 400 g ha−1 glyphosate ranged from 2% to 79% in populations of B. diandrus exposed to glyphosate.
The responses to glyphosate of SEL-R, OXON-R, and 09D118 are comparable to those of the first reported cases of glyphosate resistance in rigid ryegrass (Lolium rigidum Gaudin) in European arable cropping, where the LD50 of marginally resistant populations ranged from 373 to 552 g ha−1, with resistance indices from 2 to 5 (Collavo and Sattin Reference Collavo and Sattin2014), although a population with much higher resistance was also found (LD50 3,407 g ha−1). The ED50 values are also similar to those of the first reported case of glyphosate resistance in Australia (LD50 600 to 1,800 g ha−1), where resistant populations exhibited 7- to 11-fold resistance compared with sensitive populations (Powles et al. Reference Powles, Lorraine-Colwill, Dellow and Preston1998), and are much higher than those reported in glyphosate-resistant B. diandrus populations in Australia (275 to 288 g ha−1), where evolved glyphosate resistance has been attributed to amplification of the EPSPS gene target (Malone et al. Reference Malone, Morran, Shirley, Boutsalis and Preston2016).
Although no detailed field histories are available for the populations evolving resistance, glyphosate had been applied regularly to all three fields since the late 1970s. In addition, both the SEL-R and 09D118 populations were from fields with a long history of minimum tillage or direct drilling. Long-term glyphosate use coupled with minimal soil disturbance can greatly increase the risk of glyphosate resistance evolution (Neve et al. Reference Neve, Diggle, Smith and Powles2003) and could be a strong factor in the glyphosate response of these populations. This, combined with an increasing move toward minimum-tillage systems in the United Kingdom, highlights the increasing risk of glyphosate resistance evolution in the United Kingdom and the need for glyphosate monitoring and stewardship (Cook et al. Reference Cook, Wynn and Clarke2010).
This study has confirmed that there is significant interpopulation variation in glyphosate sensitivity among UK B. sterilis populations. Known glyphosate-sensitive populations were controlled at the recommended field rate for glyphosate use in the United Kingdom (540 g ha−1). Three populations, SEL-R, OXON-R, and 09D118, have been identified that are incompletely controlled at recommended glyphosate use rates. In all experiments, these populations exhibited significantly reduced control at agronomically relevant doses of glyphosate. While resistance indices were low and not indicative of a high level of glyphosate resistance, we believe they are noteworthy. The three populations with reduced glyphosate sensitivity exhibited phenotypic responses to glyphosate that were outside the range of glyphosate sensitivity evident in a broad collection of B. sterilis populations, and significantly less sensitive than plants grown from seeds collected from adjacent unexposed plants. Taken together, we believe these results provide robust evidence that UK populations of this species are evolving resistance to glyphosate. We believe these results are a timely reminder of the risks associated with increased glyphosate use, providing an early indication of the need for stewardship of glyphosate use.
Acknowledgments
The research reported in this paper was supported by a Biotechnology and Biological Sciences Research Council industrial CASE studentship awarded to LRD (BB/I016856/1). Financial support was also provided to LRD by Dow Agrosciences as the industrial partner. No conflicts of interest have been declared. We are grateful to Sarah Cook at ADAS; to many farmers for the provision of seed samples; and to Andrew Mead, Jens Streibig, and Isabel Whitely, who provided advice on statistical analysis.


 Open access