

Introduction
Volatilization of herbicides from the soil and leaf surfaces can result in the movement of herbicide vapor in the air. Soil-applied herbicides such as EPTC, trifluralin, pendimethalin, and clomazone have high volatility potential, resulting in reduced weed control if left unincorporated in the soil. The vapor pressure of a herbicide can affect its potential for volatilization (McWhorter and Gebhardt Reference McWhorter and Gebhardt1988). Herbicides with a vapor pressure of >10,000 µPa have the highest potential for loss compared with those with lower vapor pressures (McWhorter and Gebhardt Reference McWhorter and Gebhardt1988). Herbicides with a vapor pressure of less than 100 µPa typically have a low potential for volatility (Hanson et al. Reference Hanson, Bond and Buhl2016). Volatility can be a characteristic of the active ingredient or in some cases the formulation of the herbicide. Vapor pressure can be used to compare the potential for volatility between active ingredients or formulations. 2,4-D is an example of an herbicide that can be formulated three ways, as the acid, a salt, or an ester. The form of 2,4-D can significantly impact potential for volatility. The vapor pressure of 2,4-D acid (19 µPa at 25 C) is less volatile than 2,4-D 2-ethylhexyl ester (480 µPa at 25 C) (Jervais et al. Reference Jervais, Luukinen, Buhl and Stone2008). Dicamba acid has a vapor pressure of 4,500 µPa at 25C (Bunch et al. Reference Bunch, Gervais, Buhl and Stone2012), indicating it has greater potential for volatility than 2,4-D acid.
Amine salts of 2,4-D are generally considered nonvolatile (Gile Reference Gile1983; Grover et al. Reference Grover, Maybank and Yoshida1972; Moore Reference Moore2008; Que Hee and Sutherlan Reference Que Hee and Sutherlan1974). However, if the amine volatilizes, it can result in the formation of the acid form of the herbicide during or after application (Kramer et al. Reference Kramer, Ouse, Pearson, Tank and Zettler2015; Ouse et al. Reference Ouse, Gifford, Ahmed and Jennings2011). Behrens and Lueschen (Reference Behrens and Lueschen1979) used a closed-jar system to determine that 92% of dicamba acid volatilized from a glass slide within 12 h compared with 43% of dicamba dimethylamine (DMA) and 4% of dicamba diethanolamine (DEOA). Soybean [Glycine max (L.) Merr.] plants placed in the closed jars had 64% injury with the DMA salt of dicamba compared with 4% with dicamba DEOA salt (Behrens and Lueschen Reference Behrens and Lueschen1979). The amount of volatility can be impacted by the surface to which the pesticide is applied, with greater volatility from plant leaves than soil surface (Bedos et al. Reference Bedos, Cellier, Barriuso and Gabrielle2002; Behrens and Lueschen Reference Behrens and Lueschen1979). Volatilization of herbicides can occur over an extended period of up to 3 d (Bedos et al. Reference Bedos, Cellier, Barriuso and Gabrielle2002; Behrens and Lueshcen Reference Behrens and Lueschen1979; TC Mueller, personal communication).
Plant bioassays have been used in the past to compare relative volatility of synthetic auxin herbicide formulations (Bauerle et al. Reference Bauerle, Griffin, Alford, Curry and Kenty2015; Breeze and Rensburg Reference Breeze and Rensburg1991; Egan and Mortensen Reference Egan and Mortensen2012; Sciumbato et al. Reference Sciumbato, Chandler, Senseman, Bovey and Smith2004; Sosnoskie et al. Reference Sosnoskie, Culpepper, Braxton and Richburg2015). Field bioassays have commonly involved placing pots of susceptible crop species in and around an herbicide-treated area for a 24-h period followed by a grow-out period of 7 to 21 d before visual evaluations of plant response were determined. Comparisons are often limited to within a trial due to variability in the treated area (crop vs. bare ground), size of treated area, placement of pots, and differences in susceptibility of crop species to synthetic auxin herbicide tested. Environmental factors such as wind direction, rainfall, and temperature of air and soil can impact the level of exposure of potted plants to herbicide vapor. Bioassays have been conducted in greenhouses with some success, allowing for relative comparison of volatility of multiple herbicides (Sciumbato et al. Reference Sciumbato, Chandler, Senseman, Bovey and Smith2004; Strachan et al. Reference Strachan, Casini, Heldreth, Scosas, Nissen, Bukun, Lindenmayer, Shaner, Westra and Brunk2010). For assessment of new formulations for reduction in volatility, bioassays represent a slow qualitative assessment of relative differences.
While previous research has used different system designs to attempt to understand and quantify volatility of herbicides, the different systems have limitations in determining relative comparisons of herbicide volatility. Behrens and Luschens (Reference Behrens and Lueschen1979) bioassay in a closed system resulted in rapid elevation of the relative humidity (RH) to 90% during the 6-h test. The system utilized by Sciumbato et al (Reference Sciumbato, Chandler, Senseman, Bovey and Smith2004) did not quantify herbicide concentration in the air, but rather relied on correlating plant response with a dose response from direct foliar applications of the herbicide. Strachan et al. (Reference Strachan, Casini, Heldreth, Scosas, Nissen, Bukun, Lindenmayer, Shaner, Westra and Brunk2010) determined volatility by quantifying the loss of herbicide from a glass surface in an open system and compared the relative difference in plant injury from volatility of herbicide from a glass surface in a closed system for 6 h. Gavlick et al. (Reference Gavlick, Wright, MacInnes, Hemminghaus, Webb, Yermolenda and Su2016) quantified volatility from a soil surface. The approaches used by Strachan et al. (Reference Strachan, Casini, Heldreth, Scosas, Nissen, Bukun, Lindenmayer, Shaner, Westra and Brunk2010) and Gavlick et al. (Reference Gavlick, Wright, MacInnes, Hemminghaus, Webb, Yermolenda and Su2016) do not account for volatility from leaf surfaces.
Researchers at Corteva Agriscience™, Agriculture Division of DowDuPont, designed a system for studying volatility of herbicides that sought to overcome limitations of volatility assessment systems previously reported (Table 1). Six key attributes were identified: (1) RH control; (2) volatility from soil and plant surface; (3) constant flow of fresh air into the chamber; (4) intake air supply not contaminated by exhaust air from the chambers; (5) sampling herbicide concentration over a minimum of 72-h period; and (6) ability to conduct a bioassay to assess plant response in the volatility chambers. The intent was to design and test a system that provided highly repeatable results that could become the standard for testing volatility of synthetic auxin herbicides and other pesticides. This system could allow for a relatively rapid quantitative assessment of volatility reduction from new formulation technologies. Further, the inclusion of bioassays within the volatility chamber would enable correlation between active-substance air concentrations and plant response for relative comparison.
Table 1 Comparison of attributes of volatility chamber systems in the literature compared with the Corteva Agriscience™ system.

a Attributes of the volatility chamber systems utilized by Behrens and Luschen (1979), Sciumbato et al. (Reference Sciumbato, Chandler, Senseman, Bovey and Smith2004), and Gavlick et al (Reference Gavlick, Wright, MacInnes, Hemminghaus, Webb, Yermolenda and Su2016).
b Attributes of the system presented in this research.
The objectives were to test a new controlled environment system to validate that it met the defined attributes for an optimized system and would enable reliable and reproducible quantification of pesticide volatility and to compare the volatility of 2,4-D and dicamba formulations alone and in mixtures with other herbicides and additives.
Materials and Methods
Plant Propagation and Herbicide Application
A series of experiments were conducted to evaluate the effect of herbicide salt, temperature, and RH on the volatility of herbicide treatments. Plants were propagated in a greenhouse with an average temperature of 28 C and a 16-h light and 8-h dark period. Natural light was supplemented with 1,000-W metal-halide overhead lamps with an average illumination of 500 μE m−2 s−1 photosynthetic active radiation. One Enlist™ corn (Zea mays L.) seed cell−1 was planted in 72-cell plastic plug flats containing Metro-Mix® 360, a peat-based potting soil. Metro-Mix® is a growing medium consisting of 35% to 45% specially processed coconut coir pith, 10% to 20% horticultural-grade vermiculite, 15% to 25% processed ash bark, and 20% to 30% choice Canadian sphagnum peat moss, and proprietary nutrients and other ingredients (Sun Gro Horticulture, 770 Silver Street, Agawam, MA 01001-2907). At the 1-leaf growth stage, six Enlist™ corn seedlings were transplanted to flats (24.75 by 8 by 5 cm) containing soil. Enlist™ corn was chosen because it is tolerant to the 2,4-D treatments and has good tolerance to dicamba. The soil used in these experiments was a clay loam composed of 45% sand, 34% silt, 21% clay, 1.4% organic matter, a cation exchange capacity of 10.3, and pH of 7.6. Flats were top-watered before treatment and subirrigated after treatment. Corn was transplanted 5 d before treatment. Applications were made using a Generation III research track sprayer manufactured by DeVries Manufacturing (86956 MN-251 Hollandale, MN 56045). The spray solution was applied through an 8002E nozzle at a spray pressure of 262 kPa and speed of 3.5 kph−1 to deliver 187 L ha−1. The nozzle height was 46 cm above the plant canopy. For each chamber, three corn flats were treated. 2,4-D DMA (DMA® 4 IVM, 456 g ae L−1 ) and 2,4-D choline (GF-2564, 456 g ae L,−1) were sourced from Corteva Agriscience™, Agriculture Division of DowDuPont (Corteva Agriscience, 9330 Zionsville Road Indianapolis, IN) and dicamba diglycolamine (DGA), Clarity™, (BASF, 100 Park Avenue, Florham Park, NJ 07932), containing 480 g ae L−1 were used in the experiments. 2,4-D was applied at 1,120 g ae ha−1 and dicamba was applied at 560 g ae ha−1 to flats containing Enlist™ corn. After a 15-min drying period, the flats were moved into volatility chambers that were then placed in a growth chamber (Figure 1). The volatility chambers were not brought into the room where applications were performed to avoid potential contamination. The volatility chambers can also be configured to include a treated crop and a bioassay species (Figure 2).
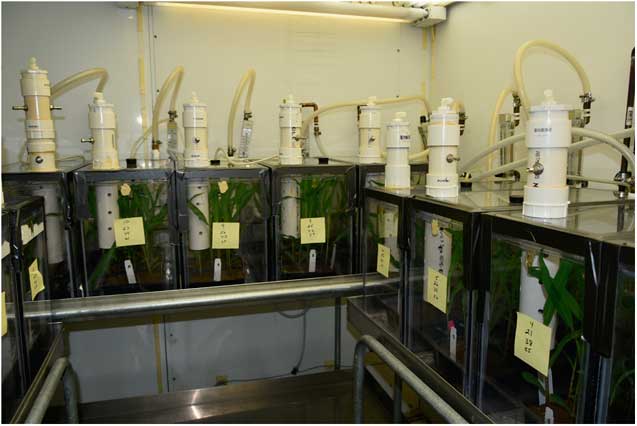
Figure 1 Picture of acrylic volatility chambers designed for use in testing herbicide volatility.
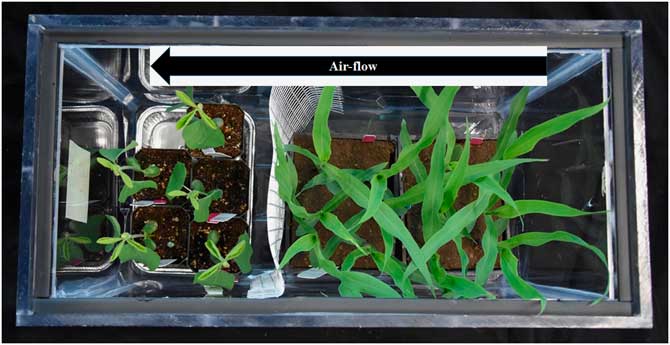
Figure 2 Picture of acrylic volatility chambers with treated corn and a sensitive bioassay crop included in the system.
Volatility Chambers
Volatility chambers were made of 0.9-cm-thick acrylic with outside dimensions of 51 by 26 by 39 cm (length, width, height) (Figure 3). A 0.9-cm-thick molding with a rubber seal on top was recessed onto the inner walls of the volatility chamber so that the chamber cover would rest on the molding and fit flush with the top of the chamber walls. The chamber cover was also acrylic. Low-residue duct tape (3M Center, St Paul, MN 55144) was applied to the edge of the cover to ensure a tight seal. Each cover was fabricated with three holes. For the air inlet, one hole had a 2.8-cm outside diameter into which was fit a section of 2.8-cm-diameter PVC pipe extending 23 cm vertically into the chamber and then extended for 17.5 cm at a 90° angle. In this pipe, nine evenly spaced holes, 0.64-cm in diameter, were drilled to allow airflow into the chamber. A 7.6-cm-wide hole was drilled on the opposite end of the cover in which a 20-cm section of 7.6 cm diameter PVC pipe was placed vertically as the air exhaust extending below the cover and with a 20.5-cm section extending above the chamber cover. The exhaust pipe was open at the bottom and also had sixteen 0.64-cm holes drilled in four rows. The top of the exhaust pipe extended through the cover, and a PVC end cap with a 1.3-cm inside diameter hole was fit with a 90° elbow (Figure 3).
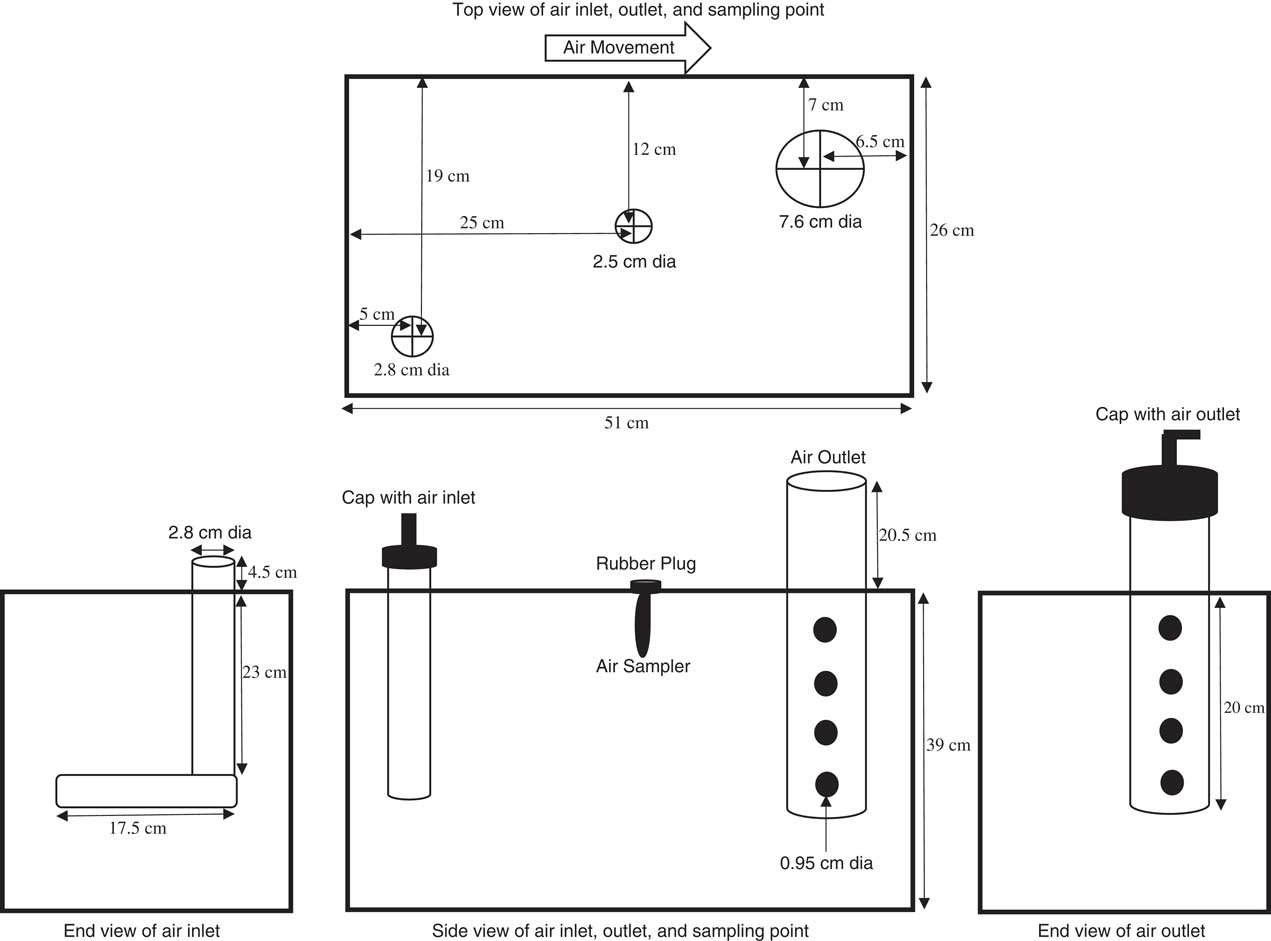
Figure 3 Volatility chamber diagram with top, side, and end views with associated dimensions on size and placement of air supply and exhaust ventilation.
Clean compressed air was supplied from a remote source and was regulated with a pressure gauge set at 10 psi inside the growth chamber. A pressure relief valve rated at 15 psi was also included to avoid overpressurization of the volatility chambers. Copper tubing (1.3 cm in diameter) was installed around the inside walls of the growth chamber (Conviron model PGV36, Controlled Environments Ltd., 590 Berry St., Winnipeg, Manitoba R340R9, Canada) to supply compressed air from the pressure regulator to adjustable Dwyer airflow meters (model RMB-53D-SSV, Dwyer Instrument, 102 Indiana Hwy. 212, Michigan City, IN 46360). Airflow meters were used to adjust the flow rate to 21 L min−1 for each volatility chamber. Flexible rubber tubing, with a 1.3-cm inside diameter, connected the Dwyer airflow meter to the volatility chamber. The volume of air flowing out of the volatility chamber was also periodically checked with an airflow meter (Omega model FMA-22322, One Omega Drive, Stamford, CT 06907-0047).
Air-sampling tubes (SKC OVS, XAD-2, catalog no. 226-30-16, 863 Valley View Road Eighty Four, PA 15330) were connected to 0.64-cm-diameter tubing placed through a 2.5-cm rubber stopper with a hole in the center and fit into the 2.5-cm hole in the center of the chamber cover. A centralized source supplied a vacuum calibrated to 1 L min−1 with airflow valves (SKC adjustable low flow tube holder, catalog no. 224-26-01) for each volatility chamber. Sampling tubes were removed and replaced at 24, 48, 72, and 96 h after herbicide application and frozen at −20 C in a White-Westinghouse freezer (model MWF421M4AW). Liners (a humidome from Hummert International, 4500 Earth City Expressway Earth City, MO 63045) were cut to fit inside the bottom of each volatility chamber to minimize cleanup and potential for cross contamination from one experiment to the next. Flats were subirrigated during the course of the experiments by removing the stopper in the center of the lid and adding water through a hose to the bottom of the liner. A total of 21 L min−1 of air was moved through the system, resulting in a complete air exchange of the chambers in 2.1 min.
Volatility chambers were washed thoroughly in mechanical dishwashers between experiments. Chamber covers and associated PVC piping were washed with soapy water, followed by a rinse in water with 0.5% v/v All Clear Extra (spray tank cleaner, Loveland Products Inc., 3005 Rocky Mountain Avenue, Loveland, CO 80538) and then a final water rinse.
Temperature and Relative Humidity Control
The experiments were conducted in a growth chamber where temperature was kept at 30 or 40 C for 96 h. Lights inside the growth chamber were cycled on a 16-h day and 8-h night period. Compressed air at 20% RH was supplied by a centralized air-compressor system. To achieve RH averaging 50%, compressed air was passed through a 20-L Nalgene low-density polyethylene carboy (plastic #4 carboy, Fisher Scientific, 168 3rd Avenue, Waltham, MA 02451; catalog no. 02-961A) with a polypropylene (PP) screw cap adapted for air transfer with barbed bullhead fittings (13 mm) with acetal nuts, silicone gaskets, and port caps (Fisher Scientific catalog no. 15-315-1). Tap water was added to the carboy to bring the volume to 15 L. The PP screw cap was fit with PP tubing (13 mm, Fisher Scientific catalog no. 14-176-153) on one of the fittings and extended to the bottom of the carboy. Air was passed through this tubing into the water to absorb moisture and exit through the other port in the top of the carboy and out to the volatility chambers through flexible tubing (13-mm Tygon flexible tubing, Fisher Scientific catalog no. 14-171-234). Temperature and RH inside the volatility chambers were periodically measured with a gauge (Fisherbrand™ Traceable™ Relative Humidity/Temperature Meter, Fisher Scientific catalog no.11-661-13) in three random chambers to ensure they were within ±10% of target settings. Experiments comparing 2,4-D choline to 2,4-D DMA had three replications and were repeated twice. Each temperature and RH combination was tested separately. Experiments to assess dicamba DGA volatility were conducted only at a temperature of 40 C and RH of 20% with two replications per time point, and experiments were repeated twice.
Sample Processing and Quantification
Sampling tubes were thawed and processed as a batch for each experiment. After removal from the freezer, the outside of each sampling tube was rinsed with methanol to ensure it was not contaminated with the herbicides during handling. Air-sample tubes were placed in 60-ml glass vials, and the packing was pushed out with a small applicator stick (0.2 cm in diameter, 15 cm long). Forty milliliters of methanol was added to each vial, and each vial was sealed with a Teflon®-lined cap. Samples were placed on a shaker for 30 min and then centrifuged at 1,000 rpm for 5 min. This resulted in all packing material forming a pellet in the bottom of the vials, thus eliminating the need for filtration. A portion of the supernatant was transferred to a small glass vial and analyzed. The acids of 2,4-D or dicamba were quantified on a Spark Holland Symbiosis Pharmam MDS SCIEX API 5000 (P. de Keyserstraat 87825 VE, Emmen, The Netherlands) liquid chromatography and tandem mass spectrometry system using MDS SCIEX Analyst 1.4.2 data system software (SCIEX, 500 Old Connecticut Path, Framingham, MA 01701). The separation column was a C18 Phenomenex Synergi Hydro-RP (411 Madrid Avenue, Torrance, CA 90501-1430) (4.6 by 75 mm, 4 µm). Injection volume was 25 µl, and samples were run for 12 min at room temperature. Mobile phase A was 0.1% acetic acid in water, and mobile phase B was 0.1% acetic acid in methanol. The flow rate was 1 ml min−1. Standard curve dosages were 0.5, 1, 2, 5, 10, 25, 50, and 100 ppb of the acid forms of either 2,4-D or dicamba. The following mass spectral conditions were used: ionization mode, APCI; polarity, negative; scan type, MRM; quantitation ion, 219.0; confirmation ion, 221.0. This method is capable of quantification of both 2,4-D and dicamba. The authors assumed no measurements of 2,4-D or dicamba salts were needed.
To determine the recovery of 2,4-D and dicamba acid, SCK air-sampling tubes were spiked with known concentrations of 2,4-D acid or dicamba acid. The tubes were extracted as described earlier, and recoveries were determined at the initial set up of the system. The XAD-2 tubes were also spiked with 0.5 and 20 ng of 2,4-D and dicamba and attached to a pump pulling approximately 1 L min−1 to determine whether breakthrough of the herbicide occurred. After 13 h, the XAD-2 tubes were taken and spilt into two front and back portions. Analytical analysis showed that there was no 2,4-D or dicamba detected above the level of detection in the back half of the sampler.
Statistical Analysis
Air concentrations across the different evaluation times (24, 48, 72, and 96 h after herbicide application) were analyzed with a linear mixed model for repeated measures:
 $$\eqalignno{ & {\rm Volatility}(\mu \,{\rm gm}^{{{\minus}3}} )_{{{\rm ijklmn}}} {\equals}{\rm \mu }{\plus}{\rm Formulation}_{{\rm i}} {\plus}{\rm Temperature}_{{ j}} \cr &\hskip100pt {\plus}{\rm Relative}\,{\rm Humidity}_{{k}} {\rm {\plus}Formulation} \cr & \hskip100pt {\times}{\rm Temperature}_{{{ij}}} {\plus}{\rm Formulation}\cr & \hskip100pt {\times}{\rm Relative}\,{\rm Humidity}_{{{ik}}} {\plus}{\rm Temperature}\cr & \hskip100pt {\times}{\rm Relative}\,{\rm Humidity}_{{{jk}}} {\plus}{\rm Formulation}\cr & \hskip100pt {\times}{\rm Temperature}{\times}{\rm Relative}\,{\rm Humidity}_{{{ijk}}} \cr & \hskip100pt {\plus}{\rm Time}{\times} {\rm Formulation}{\times}{\rm Temperature}\cr & \hskip100pt {\times}{\rm Relative}\,{\rm Humidity}_{{{ijkl}}} \cr & \hskip100pt {\plus}{\rm Experiment}_{{m}} {\plus}{\rm e}_{{{ijklmn}}} $$
where the subindex n denotes the replicate. Experiment was modeled as a random effect and all the other factors were modeled as fixed effects. The factor Time×Formulation×Temperature×Relative Humidity (where Time is a covariate) models the regression slopes for the change of volatility over time for each combination Formulation×Temperature×Relative Humidity. Correlation between repeated measures was modeled with the compound symmetry covariance matrix (Stroup Reference Stroup2012). To improve the normality and homogeneity of variance of the data set, both requirements for linear model application, values were transformed using natural logarithmic transformation. Significance of the fixed effects was evaluated with F-approximate test and least-squares means were compared with Tukey’s test (α=0.05). The estimation method was a restricted maximum likelihood and a Kenward-Rogers approximation was used to determine degrees of freedom. Significance of the random effect (experiment) was evaluated with a likelihood ratio test (Stroup Reference Stroup2012). Statistical analysis was performed with Proc GLIMMIX in SAS v. 9.3 (SAS 2011).
Results and Discussion
2,4-D acid was applied to separate SKC air-sampling tubes at 0.25, 1, or 4 µg. The herbicide was extracted from the sampling tubes, and recoveries ranged from 89% to 107% of the applied amount of 2,4-D (Table 2). Dicamba acid was applied to tubes at 1 or 4 µg tube−1 and recoveries ranged from 88% to 106% of the dicamba applied. These recoveries are well within the 67% to 116% range observed by Mueller et al. (Reference Mueller, Wright and Redmund2013) with dicamba applied at 5 and 15 µg to polyurethane foam sampling plugs. Spikes and recoveries were only done at the beginning of the experiments. Data were not corrected for percent recovery.
Table 2 Spike amounts and recoveries of 2,4-D or dicamba acid on SKC air-sampling tubes (n=2).
Use of the volatility chamber system to quantify volatility provided good repeatability with SE of 35% or less over experimental runs at 40 C and 20% RH (Figure 4). The mixed-model analysis showed that there was no random variance explained by experimental effects, so data were pooled across experiments.
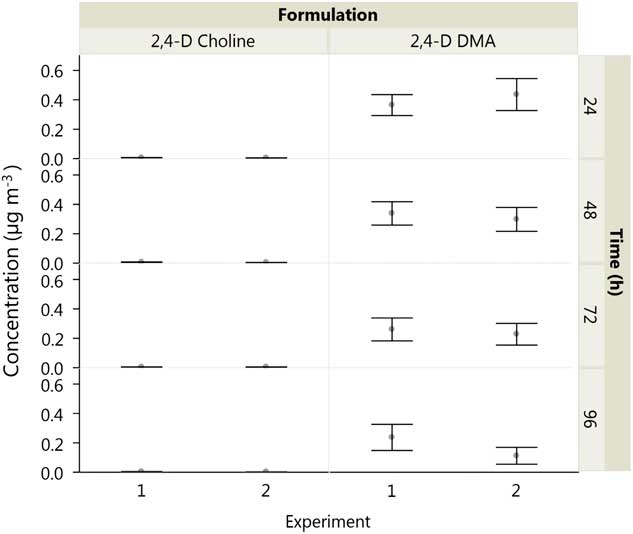
Figure 4 Means and SEs of 2,4-D acid recovered following applications of 2,4-D dimethylamine (DMA) and 2,4-D choline in volatility chambers held at 40 C and 20% relative humidity.
The effects of formulation (salt) of 2,4-D, temperature, and formulation by RH interaction on volatility were statistically significant (α=0.05) (Table 3). The DMA formulation of 2,4-D was more volatile than 2,4-D choline at 30 or 40 C and at both RHs at all time intervals (P<0.001) (Figure 5). Air concentration of 2,4-D acid from 2,4-D DMA was 0.399 µg m−3 at 40 C and 20% RH compared with 0.005 µg m−3 for 2,4-D choline at the same temperature and humidity at 24 h after application. In the interval from 24 to 96 h, the volatility decreased significantly over time for 2,4-D choline at 40 C and 20% RH (t 46.3=−3.37, P=0.0015), 2,4-D DMA at 40 C and 20% RH (t 46.3=−6.98, P<0.0001), and 2,4-D DMA at 40 C and 50% RH (t 46.3=−2.70, P<0.0096); regression equations for each set of conditions are listed in Table 4. In the rest of the Formulation×Temperature×Relative Humidity combinations, the volatility did not decrease over time in the interval from 24 to 96 h after herbicide application.
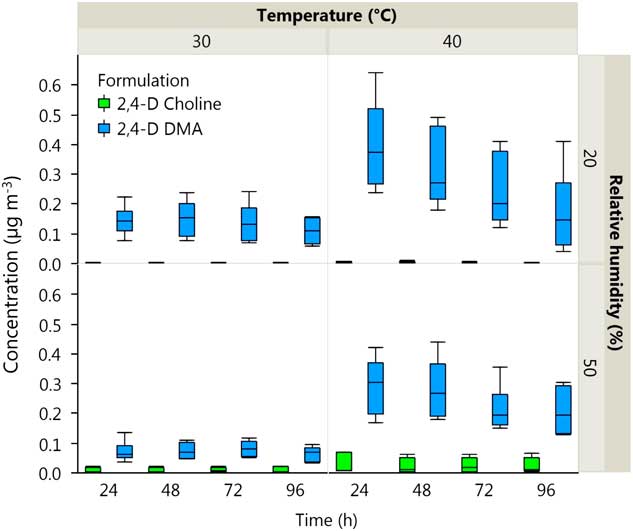
Figure 5 Box-and-whisker plot of air concentrations of 2,4-D acid comparing formulation (dimethylamine [DMA] vs. choline), temperature (30 vs. 40 C), and relative humidity (20 vs. 50%) recovered at 24-, 48-, 72-, and 96-h intervals after application to Enlist™ corn in volatility chambers kept in a controlled environment growth chamber.
Table 3 Analysis of 2,4-D volatility from applications of 2,4-D DMA and 2,4-D choline as measured at 24, 48, 72, and 96 h after herbicide application with P-values associated with main effects and interactions of formulation, temperature and relative humidity.
Table 4 Regression equations for the different conditions of formulation, temperature, and relative humidity (RH) for which the decrease of volatility from 2,4-D over time (24 to 96 h) was statistically significant (P<0.05).
Increasing temperature from 30 to 40 C resulted in a large increase in the average volatility of 2,4-D DMA, from 0.093 to 0.245 µg m−3 (F(1,41.2)=14.13, P=0.0005), whereas a small increase in the average volatility of 2,4-D choline was observed from 0.004 to 0.008 µg m−3 with the same temperature increase (F(1,41.2)=7.36, P=0.0097). Although the average main effect of RH was not significant across the 24- to 96-h time interval (Table 3), it was significant when evaluated at 72 and 96 h after application (F(1,42.9)=5.15, P=0.0286 and F(1,46.4)=7.67, P=0.0080, respectively). Volatility of 2,4-D choline at 40 C was slightly higher at 50% compared with 20% RH (F(1,41.2)=16.85, P=0.0002) (Figure 5). Volatility from 2,4-D choline at 40 C increased from 0.00458 to 0.0263 µg m−3 and from 0.00341 to 0.025 µg m−3 when humidity increased from 20% to 50% at 72 and 96 h after treatment, respectively. This follows a general trend identified in the literature, in which herbicide volatility can increase when soil moisture or RH increase due to less adsorption of the herbicide to soil (McWhorter and Gebhardt Reference McWhorter and Gebhardt1988). Volatility of 2,4-D DMA was numerically higher at 20% RH compared with 50% RH at 24 and 48 h after application, but was not statistically different across the whole time interval from 24 to 96 h (F(1,41.2)=1.80, P=0.1874).
Overall, volatility from 2,4-D choline was several times lower than observed from 2,4-D DMA. These results align with field bioassay observations of Sosnoskie et al. (Reference Sosnoskie, Culpepper, Braxton and Richburg2015), in which cotton (Gossypium hirsutum L.) was exposed to different forms of 2,4-D. Cotton injury was greater when exposed to 2,4-D ester compared with injury from the 2,4-D DMA or choline formulations, and 2,4-D DMA caused greater cotton injury than 2,4-D choline.
Dicamba DGA volatility was quantified at a temperature of 40 C and about 20% RH. The random effect of experiment had a variance estimate equal to zero. The mean air concentration of dicamba pooled across experiments ranged from a high of 0.1195 µg cm−3 at 72 h to a low of 0.0761 µg cm−3 at 96 h. There was a trend for lower dicamba volatility at 96 h after treatment compared with earlier timings. However, there was not a significant decrease in volatility over the time interval from 24 to 96 h (F(1, 13)=0.22, P=0.6455) (Figure 6).
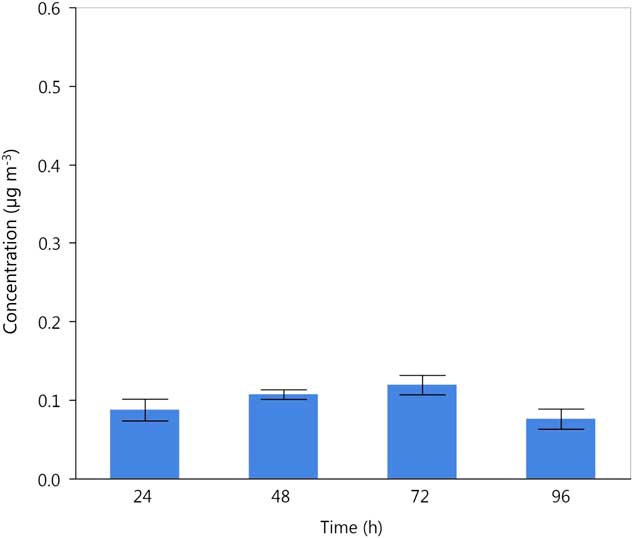
Figure 6 Recovery of dicamba acid from application of dicamba diglycolamine at 40 C and 20% RH, 24, 48, 72, and 96 h after herbicide application. Data are means and SEs across experimental runs and replications.
These results for both 2,4-D and dicamba reinforce the importance of assessing volatility of synthetic auxin herbicides over several days, as 2,4-D (Figures 4 and 5) and dicamba (Figure 6) were detected and quantified up to 96 h after treatment. Bio-indicator crops placed downwind of dicamba treatments were injured for 3 d after applications in the field (Behrens Reference Behrens and Lueschen1979). Other published methods (Strachan et al. Reference Strachan, Casini, Heldreth, Scosas, Nissen, Bukun, Lindenmayer, Shaner, Westra and Brunk2010) assessed volatility of synthetic auxin herbicides by exposing sensitive plants in enclosed chambers for 6 h, and Gavlick et al. (Reference Gavlick, Wright, MacInnes, Hemminghaus, Webb, Yermolenda and Su2016) assessed volatility for 24 h. Both methods may not have assessed the complete time frame in which volatility could occur. Furthermore, only bare soil was treated in the system used by Gavlick et al. (Reference Gavlick, Wright, MacInnes, Hemminghaus, Webb, Yermolenda and Su2016), and Strachan et al. (Reference Strachan, Casini, Heldreth, Scosas, Nissen, Bukun, Lindenmayer, Shaner, Westra and Brunk2010) treated a glass surface as a source to generate vapors. Both methods may underestimate the volatility of synthetic auxin herbicides when applied to crop foliage (Bedos et al. Reference Bedos, Cellier, Barriuso and Gabrielle2002). Additionally, the methods described in this paper were different from most other lab experiments (Mueller Reference Mueller2015), in which plants are not sprayed with herbicides and airflow was either static or very low compared with the 21 L min−1 used in this method.
This volatility quantification method provided good repeatability and consistency across replications and experiments. It provides a rapid screening tool for assessing and comparing the volatility of different formulations and salts of pesticides and also has the advantage of eliminating humidity buildup, which is often a problem with closed systems. Potential cross contamination with herbicides was mitigated by: (1) keeping the volatility chambers in a room separate from where applications occurred; (2) using a source of clean compressed air located remotely from the growth chamber where experiments were conducted; (3) maintaining positive air pressure in the volatility chambers for the duration of experiments; and (4) thoroughly cleaning the volatility chambers and component parts between experiments.
Acknowledgments
The authors would like to thank Debbie Bingham-Burr and Tracy Wade for their assistance in establishment of these experiments. This research received no funding from any governmental agency. All authors are employees of Dow AgroSciences, and this research was funded by Dow AgroSciences.


 Open access