


Introduction
Glycerol can be considered as one of the most widely used ingredients in the pharmaceutical, food, and personal care industries for a variety of products such as different types of medicines, oral care products, cosmetics, antifreeze, and preservatives due to its lubricating and humectants nature[Reference Robertson1]. These broad applications of glycerol increase its demand continuously and hence to fulfill the market supplies its adulteration is practiced by various sources using its cheap and toxic supplement. Out of many variants of alcohol having nearly similar properties to that of glycerol, diethylene glycol (DEG) and ethylene glycol (EG) are the most commonly used adulterants in glycerol and these are almost three times cheaper than glycerol [Reference Robertson1].
In the recent past, some of the major incidents were faced by the biomedical industry due to the contamination of glycerol with severely toxic metabolic incompatible DEG. Some of the severe cases of the pandemic glycerol adulteration are described below to understand the severity of condition when patients are injected with mixed glycerol. In 1986 in Mumbai, India, 14 patients died of poisoning by the DEG adulterated glycerol (https://bmmbox.com/cafe/showthread.php/5467-JJ-Deaths?s=1a552556b8c4d532b17fbf57ae2d884d). Another tragic incident has taken place between November 2008 and January 2009 in which 84 children in Nigeria died after ingesting DEG-contaminated teething syrup [Reference Molever2]. Also, in 2006 in Panama, hundreds of people died of cough syrups which were manufactured using DEG instead of glycerol [Reference Robertson1]. The FDA has recently taken steps to reduce the risks due to biomedical substances adulterated with the economically motivated adulteration. To get rid of this problem, the FDA has directed the manufacturers of finished products to assay and confirm that incoming glycerol should meet the specified limits (https://bmmbox.com/cafe/showthread.php/5467-JJ-Deaths?s=1a552556b8c4d532b17fbf57ae2d884d) [Reference Robertson1–Reference L´opez-S´anchez3]. Therefore, before using glycerol for any human consumption, it is a prime and uttermost requirement to test its purity with reasonable accuracy. Another challenge faced by medical practitioners today is the detection of diabetes in humans at an early stage, which otherwise results into several complications because of hyper and hypoglycemia. The severity of the disease toward negligence can be understood by the fact from the survey carried out in 2014, where surprisingly it was found that nearly 422 million adults were living with diabetes in 2014 while 1.5 million deaths were recorded in 2012 worldwide mainly due to diabetes [Reference Chan4]. This basically means that the early stage detection and constant monitoring of glucose level in a diabetic patient is necessary to prevent and control diabetes. Hence, it is required to develop a glucose sensor with better sensitivity and accuracy to detect the presence of glucose at an early stage.
From the above discussion, it can be inferred that the two issues related to the estimation of adulteration level in glycerol and detection of diabetes at an early stage are quite important for the biomedical and pharmaceutical industry which necessitates the development and realization of a compact sensor conforming to the medical standard. Apart from this, detection of the glucose concentration in the various edible-energy drinks and fruit juices before their actual human consumption also plays a crucial role for the medical and pharmaceutical industry. This motivated us to develop a dedicated radio frequency (RF) biosensor for humanitarian applications which can provide viable solution for both of the above specified issues. It should be noted that RF sensors usually conform to the greener form of technology as they don't involve any residue like chemical sensors. Moreover, RF sensors can be made fully noninvasive, which is quite advantageous for applications such as glucose detection [Reference Awang, Tovar-Lopez, Baum, Sriram and Rowe5]. The design and implementation of RF and microwave sensors can be performed using two resonant techniques especially for applications where high accuracy and sensitivity are required [Reference Chen, Ong, Neo, Varadan and Varadan6–Reference Krupka8]. In the last few years, use of planar resonators has been found quite fascinating for various applications including bio-medical industry, food industry, and pharmaceutical industry due to their ease of integration into other planar components and devices [Reference Kim, Babajanyan, Hovsepyan, Lee and Friedman9–Reference Bait-Suwailam Al Busaidi, Shahimi and Al14]. Out of many planar resonant structures, metamaterial unit cell-based sensors have gained more popularity due to their compact size, improved sensitivity, and excellent resolution compared with other planar sensors [Reference Boybay and Ramahi15–Reference Schueler, Mandel, Puentes and Jakoby17]. Metamaterial inspired sensors are usually realized using metamaterial unit cell-based resonators such as interdigitated capacitors (IDCs) [Reference Adhikari and Kim18], split ring resonators (SRRs) [Reference Tiwari, Singh and Akhtar19], and complementary split ring resonators (CSRRs) [Reference Yang, Huang, Lan and Li20, Reference Sun, Tang and Du21]. The electrical size of the sensing area in the metamaterial unit cell-loaded sensors is relatively small, and hence it is possible to develop compact planar RF sensors for biomedical applications where the available sample volumes are minimal in quantity [Reference Boybay and Ramahi15, Reference Lee, Lee, Yoo and Yook22]. Also, the localization of electric field in the small-sensing region of metamaterial-based sensors helps to obtain improved sensitivity which facilitates the development of adulteration detection sensor systems for monitoring the quality of various agricultural and bio-products even with lower volume [Reference Chen, Li and Sun16, Reference Schueler, Mandel, Puentes and Jakoby17]. In the literature, a number of methods have been reported to detect glucose concentration using microwave techniques [Reference Hofmann, Fischer, Weigel and Kissinger23–Reference Harnsoongnoen and Wanthong28]. The detection of glucose concentration in biological samples using a non-resonant microwave technique has also been reported [Reference Hofmann, Fischer, Weigel and Kissinger23]. However, the non-resonant approach has limited sensitivity and hence it requires high concentration of solution for actual measurement. The resonant cavity approach for the detection of biological samples has been briefly discussed in [Reference Gennarelli, Romeo, Scarfì and Soldovieri24] but these approaches employ a non-planar cavity/dielectric resonator (DR) structure, which increases the minimum required volume of the test specimen. An SRR-based glucose sensing technique using the change in magnitude of the S-parameter has been proposed [Reference Harnsoongnoen and Wanthong25], but still, there is a requirement of a relatively larger quantity of the test sample. The sensitivity of resonant sensors can be increased using an improved IDC structure which facilitates the detection of glucose concentration for minimal volume [Reference Adhikari and Kim18, Reference Kim, Adhikari, Dhakal, Chuluunbaatar, Wang and Kim26]. However, in these studies a thick GaAs substrate was used for fabrication of sensors and hence hindering the realization of flexible glucose sensors. Recently, an LC-based resonator is also employed to study the change in dielectric properties with the corresponding change in glucose concentration [Reference Ebrahimi, Withayachumnankul, Al-Sarawi and Abbott27, Reference Harnsoongnoen and Wanthong28]. However, the accuracy of this method is not significant for concentrations lower than 40 mg/ml as the developed graphical relation does not bear the linear relationship in this region [Reference Ebrahimi, Withayachumnankul, Al-Sarawi and Abbott27]. On the other hand, the work presented in [Reference Harnsoongnoen and Wanthong28], has the quite small relative change in the magnitude of the transmission coefficient that necessities the requirement of the larger sample volume to obtain the desired sensitivity. The work presented in [Reference Kim, Kim, Babajanyan, Lee and Friedman29] shows that the variation in glucose concentration can also be detected using the magnitude of measured S-parameters with limited accuracy. The all abovementioned the sensors are actually non-flexible type. However, the flexibility of a sensor can play an important role in developing noninvasive conformal (to human body) sensors which can detect glucose concentration. This is one of the main motivations behind the present work to realize a flexible RF biomedical sensor.
Apart from this, until now only chemical-based techniques have been mainly being explored to understand the behavior of a mixture of water/sorbitol solution with glycerol and other variants of alcohol [Reference Molever2, Reference McDuffie, Quinn and Litovitz30–Reference Davidson and Cole34], to the best of authors knowledge. As a matter of fact, chemical-based approaches show very high sensitivity toward the operating environment, which might introduce error in the detected dielectric behavior of the test sample [Reference McDuffie, Quinn and Litovitz30–Reference Davidson and Cole34]. Moreover, this approach requires repeating of all the steps for each test specimen with special attention that makes the overall procedure time consuming. The microwave technique has not much investigated for a study of the complex permittivity behavior of glycerol over the broad frequency range especially in the higher frequencies. The complex permittivity behavior of glycerol has studied only for the small frequency range using microwave approaches [Reference Brady and Stuchly31]. Therefore, there is a scarcity of the microwave-based approach for adulteration detection in glycerol rather than the design of microwave-based chemical sensors [Reference Salim, Ghosh and Lim35]. A microwave-based approach can provide a viable solution to detect the contamination in biomedical samples with good repeatability and accuracy throughout the lifespan of the sensor in contrary to chemical sensors, where the reusability is quite limited. This is the second main reason behind the proposed work to develop microwave-based simplified approaches to find out the toxic DEG and EG concentrations in the biograded glycerol using the proposed biomedical sensor. The thin-film design topology of the proposed sensor can facilitate its ease of integration into state-of-the-art low-power thin-film technology. Also, the biodegradable substrate used in the sensor design confirms green technology. Thus, a low-power biodegradable compact biomedical sensor can be designed using the proposed sensor topology to meet the demand of the medical industry.
This work mainly considers the abovementioned two important aspects of the bio-medical industry to improve the safety of the humankind by effective implementation of compact, flexible bio-sensors. For this purpose, an IDC resonator-etched coplanar waveguide (CPW) loaded with a liquid container is designed on a biodegradable flexible RF substrate using an in-house customized photolithography fabrication process. The resonant frequency of the proposed sensor is tuned deliberately to 2.45 GHz, which basically serves two purposes, first the sensor can operate at the industrial, scientific and medical (ISM) band, and second there is a higher possibility to discriminate between DEG and glycerol at this frequency as explained in a later section. The numerical analysis corresponding to the bending of the proposed sensor shows that the resonant frequency does not change considerably with the change in the bending curvature up to a certain extent (~450), which makes it a suitable candidate to develop wearable RF sensors, conformal to human body. Finally, a measurement of the glucose concentration at different volume proportions and adulteration detection of glycerol using the fabricated sensor is carried out. Thereafter, a graphical relation between the measured resonant frequency and the concentration of the test specimens is developed which actually helps to determine an arbitrary level of adulteration in test specimens using the measured resonant frequency.
Theoretical aspect of proposed sensing methodology
Basic physics behind the proposed sensing mechanism can be better understood using electromagnetic theory, where the sensing elements can equivalently be described using the distributed element model. Also, the quasi-static lumped equivalent model can be developed corresponding to the proposed sensor to get more insight into the change in resonant frequency concerning a dielectric constant and volume proportion of the contaminant in the pure glycerol.
Electromagnetic theory
Sensing mechanism of the proposed biomedical RF sensor can conceptually be understood using material perturbation theory [Reference Chen, Ong, Neo, Varadan and Varadan6]. According to this theory, the loading of the test material into a resonator results in a change in the resonant frequency of resonator depending on the dielectric constant of the test specimen loaded on the resonator (1):
 $$\displaystyle{{\,f_{radls}-f_{r0}} \over {\,f_{radls}}} = -\displaystyle{{\int_{Vs} {\lpar {\varepsilon_{radls}-\varepsilon_{r0}} \rpar E_{adls}\cdot} E_0^{^\ast} dV} \over {2\int_{V_R} {\varepsilon _{radls}E_{adls}\cdot} E_0^{^\ast} dV}}$$
where E 0, E adls and f r0, and f radls represent the electric field and the resonant frequency corresponding to the resonator without perturbation and with perturbation, while V s and V R represent the sample and resonating energy storage volume of the resonator, respectively. For small perturbation of the resonator, the perturbation theory can be modified as the small perturbation theory which is mainly derived for the conventional metallic closed resonators to relate the change in the measured resonant frequency with the dielectric property of the test specimen [Reference Krupka8]. Assuming various constraint possesses by the small perturbation theory, the simplified relationship between the measured shifts in the resonant frequency and the complex permittivity of the test specimen can be obtained using (2):
 $$\eqalign{& \varepsilon _{radls} = 1 + \left( {\displaystyle{2 \over {SF}}} \right)\left( {\displaystyle{{\,f_{radls}-f_{r0}} \over {\,f_{radls}}}} \right) \cr & SF = \displaystyle{{4V_s} \over {V_R}}} $$
From (2), one can easily notice that any change in the dielectric property of the test specimen results in the corresponding change in the measured resonant frequency. However, the developed relationship (2) only holds for the conventional closed resonant structures such as metal cavity and dielectric resonators because of small electric-field perturbation, large volume, and high Q-factor associated with these structures. On the other hand, for the open resonator, this relationship is not strictly valid. It shows that the mechanism of the shift in the resonant frequency due to the change in the dielectric constant will always be taken place, material perturbation theory (1). Thus, equation (1) can suitably be used for the qualitative explanation about the shift in the resonant frequency corresponding to the dielectric property of the contaminated glycerol solution. But the constraints imposed in the perturbation theory to derive the closed form relation (2), cannot directly be applied for the quantitative analysis of the open resonator due to their small Q-factor and substantial amount of perturbation. That is the main reason that most of the researchers have developed the empirical relationship between the measured resonant frequency and the dielectric constant of the test specimen. This helps to perform the quantitative analysis by modeling the real measurement scenario without need of any constraint, which is required to derive (2). Here, it is to be underlined that our main aim is not a direct extraction of the complex permittivity of the test specimen. But instead, the proposed approach requires the indirect use of the dielectric behavior of the test specimens for the qualitative interpretation of the measured resonant frequency. From the above discussion, it becomes evident that the change in the dielectric property of the contaminated solution will reflect the shift in the measured resonant frequency. The effective dielectric property of the mixed solution will change according to the change in volume proportion of its constituent adulterant. A detailed explanation about the evolution of the effective permittivity of the mixed solution with the variation in volume proportion of its constituents has been presented in the literature [Reference Nelson36]. According to the mixing formulation, it can be ascertained that the effective dielectric constant of the concoction will always lie between the dielectric constant of the individual constituents used in the mixture. Also, with an increase in the volume proportion of the higher dielectric constant material, the total dielectric constant of the contaminated solution tends to increase and vice versa. There are different relationships available in the literature to relate the effective permittivity of the contaminated solution with specific permittivity of its constituent materials used. Expression (3) shows a typical formulation for the effective permittivity of the mixed solution (ε radls), which is in the present case is adulterated glycerol, in terms of the permittivity of adulterant (ε radlt) and solvent (ε rsol):
 $$\eqalign{& \root 3 \of {\varepsilon _{radls}} = v_{adlt}\root 3 \of {\varepsilon _{radlt}} + v_{sol}\root 3 \of {\varepsilon _{rsol}} \cr & v_{adlt} + v_{sol} = 1} $$
From (1) and (3), it can be ascertained that the change in the volume proportions of adulterant (v adlt) and solvent (v sol) in the contaminated solution will change its effective dielectric constant, thereby change in the measured resonant frequency. Using this observation, in the proposed work the adulteration level of the DEG and EG in the glycerol is successfully investigated. Here, special care is taken to select the operating frequency such that different test specimens can be discriminated with ease, based on their individual dielectric properties.
Circuit theory
A quasi-static lumped equivalent circuit model of the proposed sensor can be developed to relate the dielectric constant of the liquid specimens with the measured resonant frequency. The resonator in the present work is implemented using the IDC-based structure which is directly etched on the main signal line. The quasi-static model of the proposed IDC resonator can be developed using a similar approach [Reference Pozar37], where various open stub- and shorted stub-based resonators are modeled with the equivalent lumped circuit elements. The equivalent circuit model of the proposed resonator is shown in Fig. 1(a).
(a) Equivalent circuit of the proposed resonant sensor, and capacitance associated with the unloaded and loaded resonator (b) and (c), respectively.
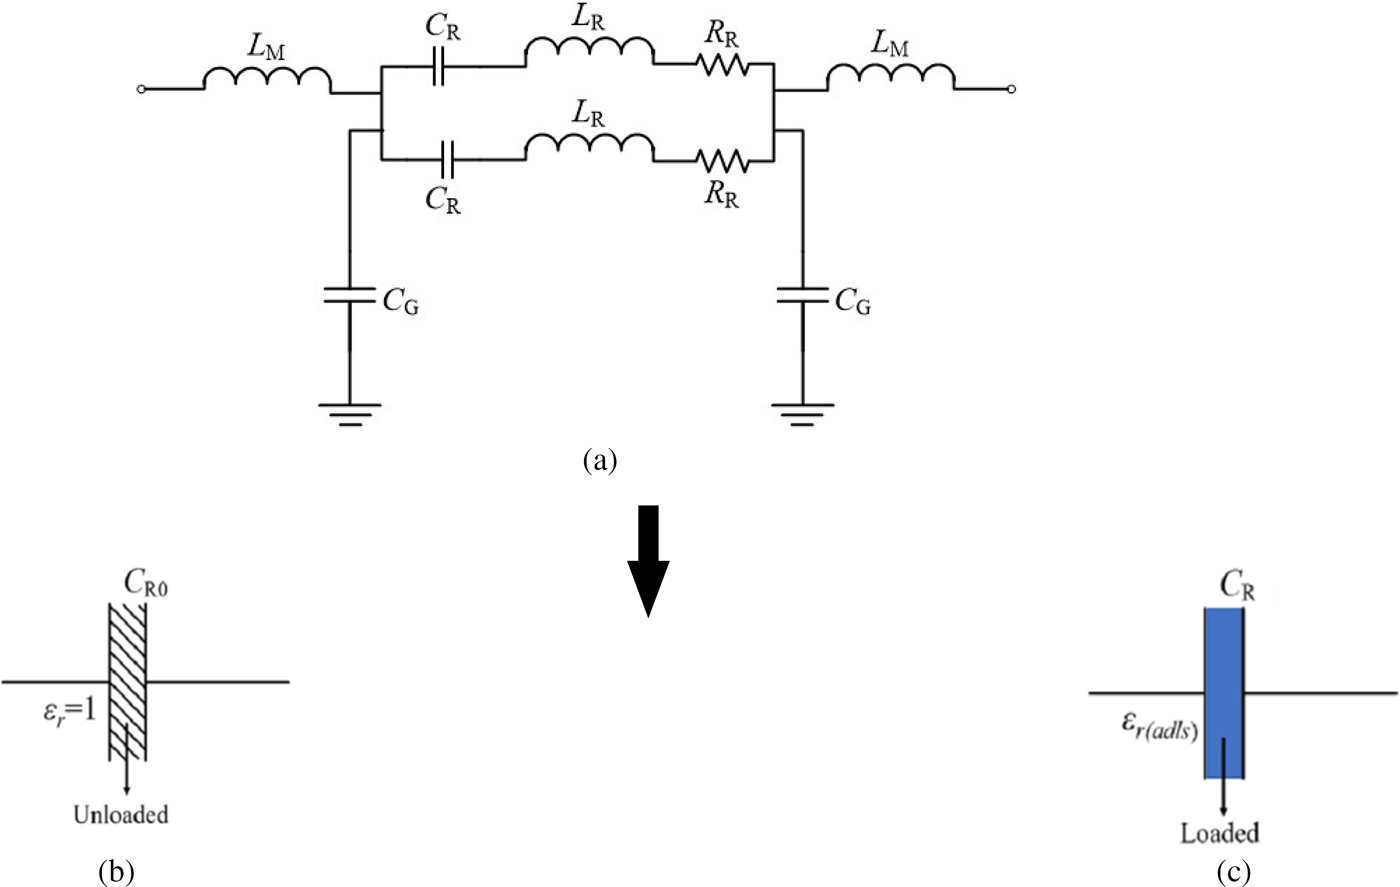
Here, L M shows the inductance associated with the main signal line, while the C G represents the capacitance between the signal line and the ground. The L R, C R, and R R represent the inductance, capacitance, and resistance associated with the resonator, where two branches are corresponding to the two gaps between the main line of the CPW and the ground. The capacitance C R0 represents the unloaded capacitance of resonator and ε r(adls) describes the dielectric constant of the adulterated solution in Figs 1(b) and 1(c). Here, it is to be noted that L R and C R are the parameters which mainly control the resonant frequency of the resonator while R R is used here to model the loss associated with the resonator. The resonant frequency of the proposed resonator is given by (4):
 $$\eqalign{\,f_r\approx &\displaystyle{{K_1} \over {2\pi \sqrt {L_R(C_R(\varepsilon _{r(adls)})}}} \cr \approx &\displaystyle{{K_1} \over {2\pi \sqrt {L_R\lpar {C_{R0}\cdot \varepsilon_{r(adls)}} \rpar }}}, \;{\rm where}\;C_R = C_{R0}\cdot \varepsilon _{r(adls)} \cr \Rightarrow f_r\propto &\displaystyle{1 \over {\sqrt {\varepsilon _{r(adls)}}}} \cr {\rm} \propto &\lpar {v_{adlt}\root 3 \of {\varepsilon_{radlt}} + v_{sol}\root 3 \of {\varepsilon_{rsol}}} \rpar ^{-1.5} \cr \Rightarrow f_r = &K_2\cdot \lpar {v_{adlt}\root 3 \of {\varepsilon_{radlt}} + v_{sol}\root 3 \of {\varepsilon_{rsol}}} \rpar ^{-1.5}} $$
The insight of the developed equivalent circuit model of the proposed resonator can be understood using the combination of the equivalent circuit modeling of two basic elements (open and closed resonators) [Reference Pozar37]. Once the test specimen is loaded on the top of the sensing region, the equivalent capacitance associated with the resonator gets modify, following the dielectric constant of the test specimen ((3) and (4)). In the present work, the tested samples are generally of the dielectric nature, and hence there would not be any significant change in the associated inductance of the resonator.
Therefore, this section confirms the finding of perturbation approach i.e. loading of the solution under test with different volume proportions of its individual constituent changes the effective dielectric constant of the adulterated liquid. This eventually produces the change in the associated capacitance of resonator, which results in the shifts in the measured resonant frequency (4). This fact helps to deploy the proposed sensor to detect any arbitrary concentration of the contamination in the test solution.
Numerical modeling of the proposed sensor
The numerical simulation model of the proposed sensor is developed using the frequency domain solver of the CST-MWS to obtain the improved sensitivity at the ISM band of frequency (2.45 GHz), shown in Fig. 2(a). The meshing and port size in the simulation model is chosen appropriately to achieve the convergence criteria. The sensor is designed on a 0.13 mm thin polyethylene terephthalate polyester (PETP film). The dimensions of the CPW structure are chosen accordingly to realize a 50-Ω line for better matching with the feeding port to comply the realistic measurement scenario. After that, the IDC is etched directly on the main signal line with its design parameters such that it resonates at 2.45 GHz frequency point. The simulated S-parameter response corresponding to the unloaded and loaded sensors is shown in Fig. 2(b).
Numerical simulation model of the proposed sensor loaded with test specimen: (a) actual sensor, (b) the S-parameter response of the proposed sensor under unloaded and loaded conditions.
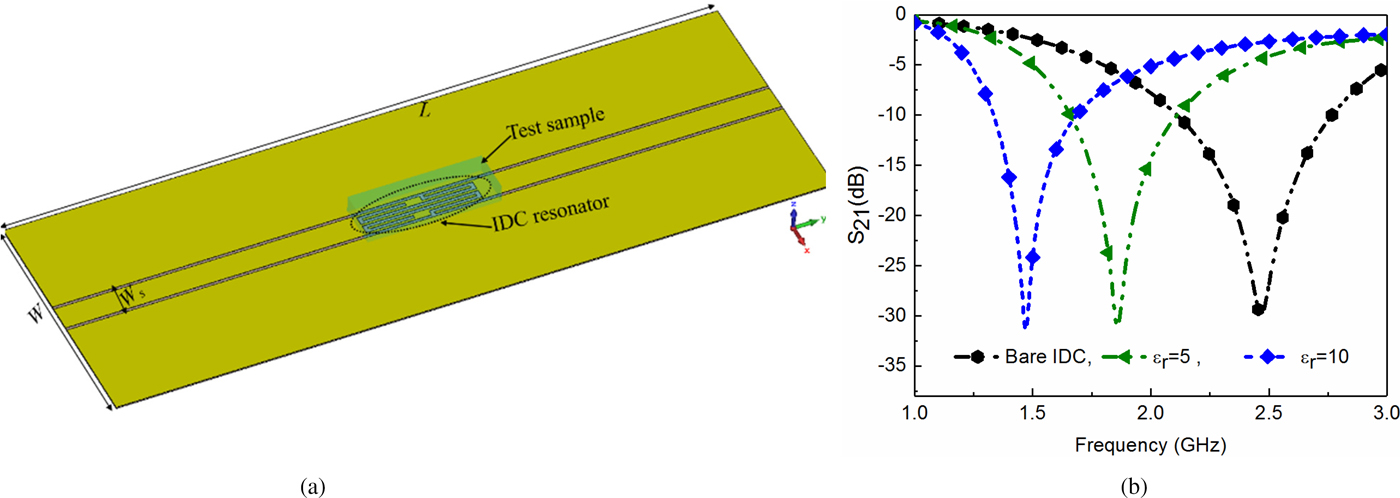
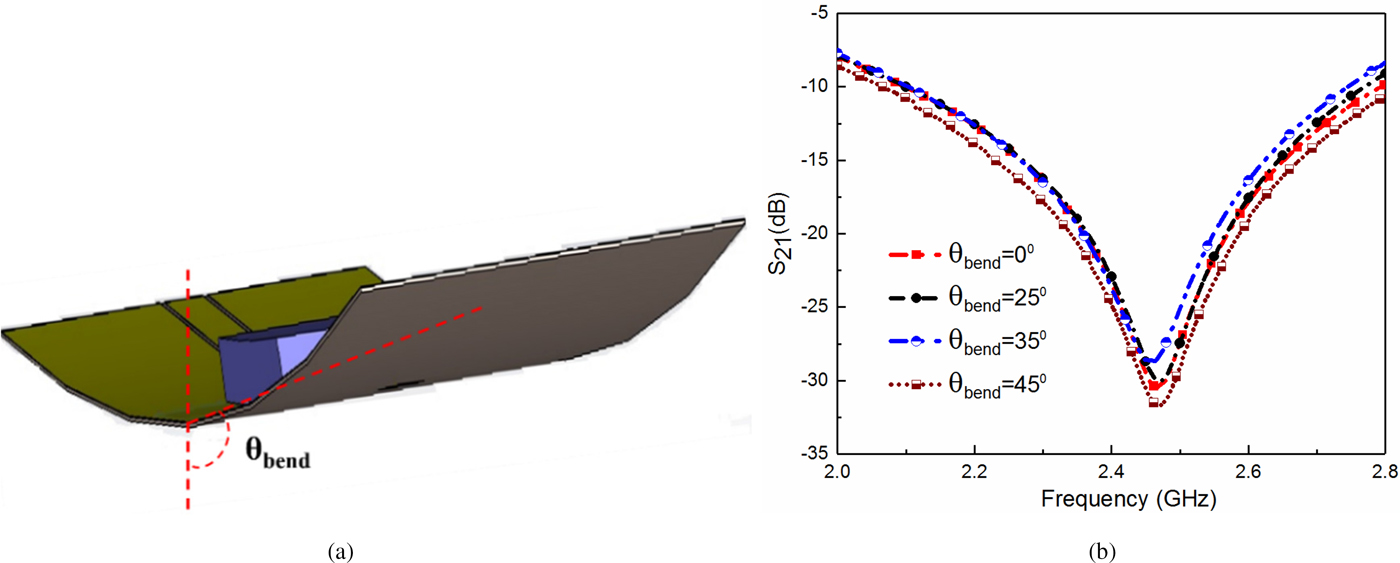
From this figure, it can be seen that an increase in the dielectric constant actually shifts the resonant frequency toward the left side which is quite evident as per (3). Afterward, the bending analysis of the proposed sensor is performed so that its applicability as a thin-film sensor in real life biomedical applications can be studied. The numerical simulation model for bending analysis and corresponding simulated S-parameters for different bending curvature are shown in Fig. 3. From this figure, it can be observed that there is a very minimal change in measured resonant frequency if the bending radius is less than 45°. Thus, the designed sensor confirms the thin-film technology in a realistic scenario. The developed sensor is implemented using the IDC structure, and hence it removes the need of any separate resonant sensing elements unlikely to the SRR/CSRR-based sensor, where the resonators are magnetically/electrically coupled with the main signal line. As a consequence, using the IDC-based structures a relatively miniaturized sensor can be realized than that of their counterpart.
(a) Sensor with finite bending (θ bend) and (b) plot of S 21 for different values of bending curvature (θ bend).
Multilayer model
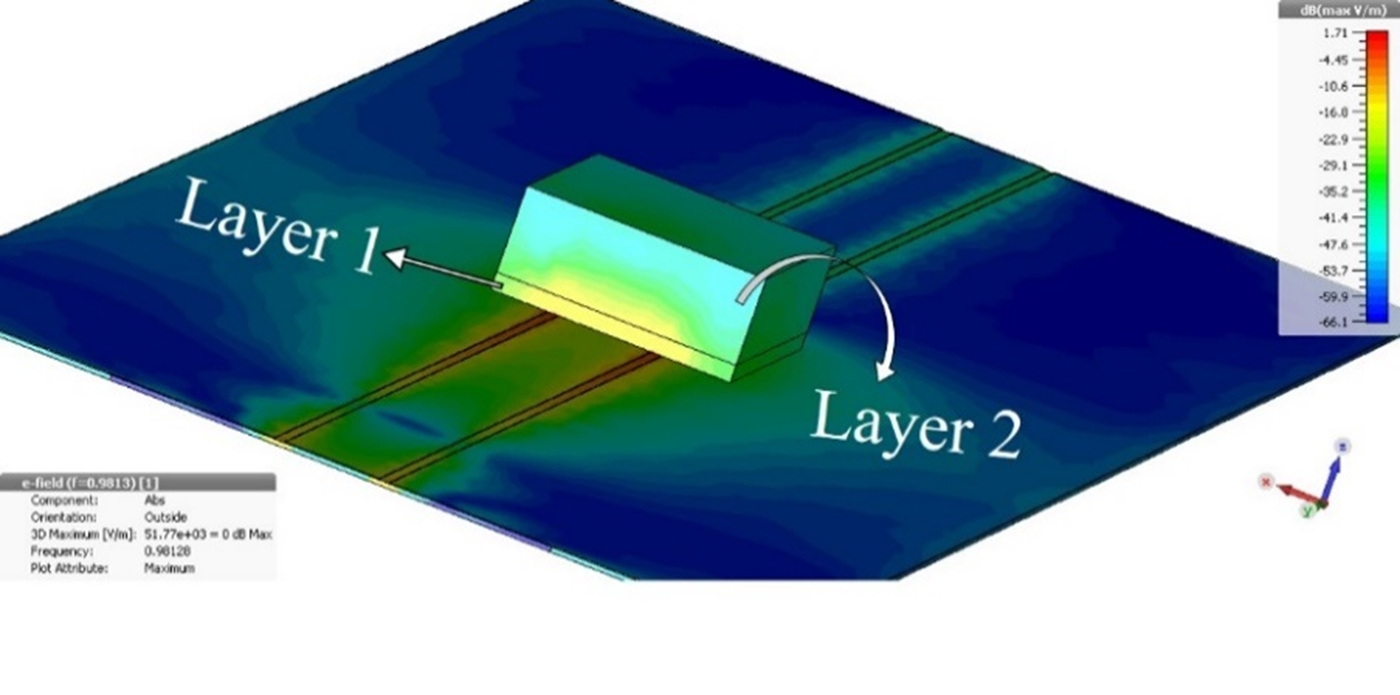
This section mainly focuses on the performance of the proposed sensor in a multilayer environment using the investigation of the associated electric field of the sensing region as shown in Fig. 4. The practical scenario of glucose detection in human blood can be better represented using the multi-layer model due to the presence of skin, and fat layer surrounding the blood vessel. Therefore, the sample shown in Fig. 4 is represented by two layers, viz., skin layer (layer 1) and effective blood media (layer 2). From the plot of electric field shown in this figure, it can easily be visualized that there is a presence of sensing region electric field in layer 2 as well as in layer 1 which shows the applicability of the proposed sensor in a multi-layered environment. As a matter of fact, any change in layer 2 dielectric property will perturb the near field of the sensor that can be related either to the shift in resonant frequency or magnitude of transmission coefficient at the resonant frequency of the sensor (1)–(5). For example, if the glucose concentration in the blood changes then accordingly the electric field of second layer gets perturbed resulting in change in the resonant frequency/quality factor of the proposed sensor which can be measured using the proposed sensor.
CST model of multilayer environment involving two layers, layer 1 represents the skin while layer 2 shows the effective blood media i.e. blood and fat.
Fabrication and measurement
Fabrication of flexible IDC sensor
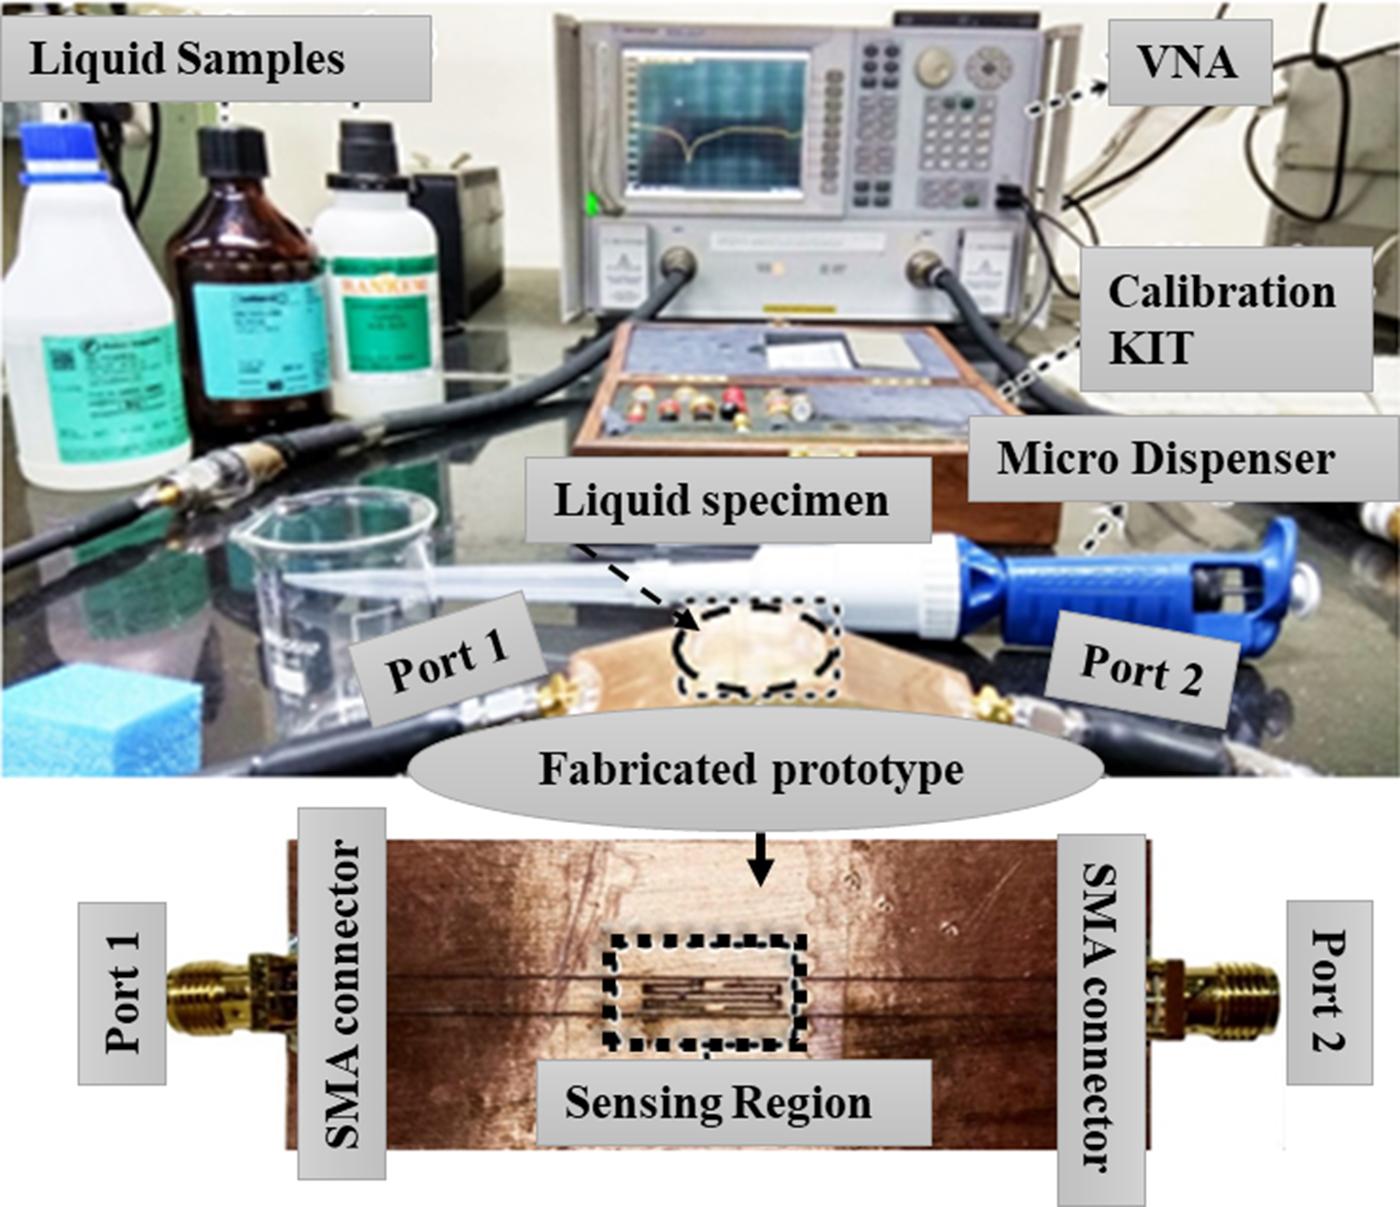
The fabricated prototype of the proposed flexible RF biosensor realized on a 130-micron thin biodegradable substrate PETP film of having dielectric constant ε r ~ 4.3 – 0.08i, using the in-house customized photolithographic procedure, shown in Fig. 5. A sample holder is attached to the sensing region where the electric-field intensity is higher to ensure the high sensitivity and uniform sample volume throughout the measurement. The sample holder walls are kept outside the sensing region which basically helps to test the constant sample volume of the test solution without substantial degradation in the sensitivity of the fabricated sensor. The experimental setup employed in this work consists of the fabricated sensor loaded with sample holder, vector network analyzer (VNA), connecting coaxial cables, micro dispenser, and biomedical test samples (Fig. 5). Before attaching the sensor with the VNA, its full two-port calibration is performed to remove any undesired effect on the measurement. The number of points and IF BW are chosen as 1601 and 50 Hz, respectively during all the subsequent measurement to ensure the accuracy of the measured result.
Fabricated prototype of thin-film RF biomedical sensor and measurement setup where sensor is connected to the VNA.
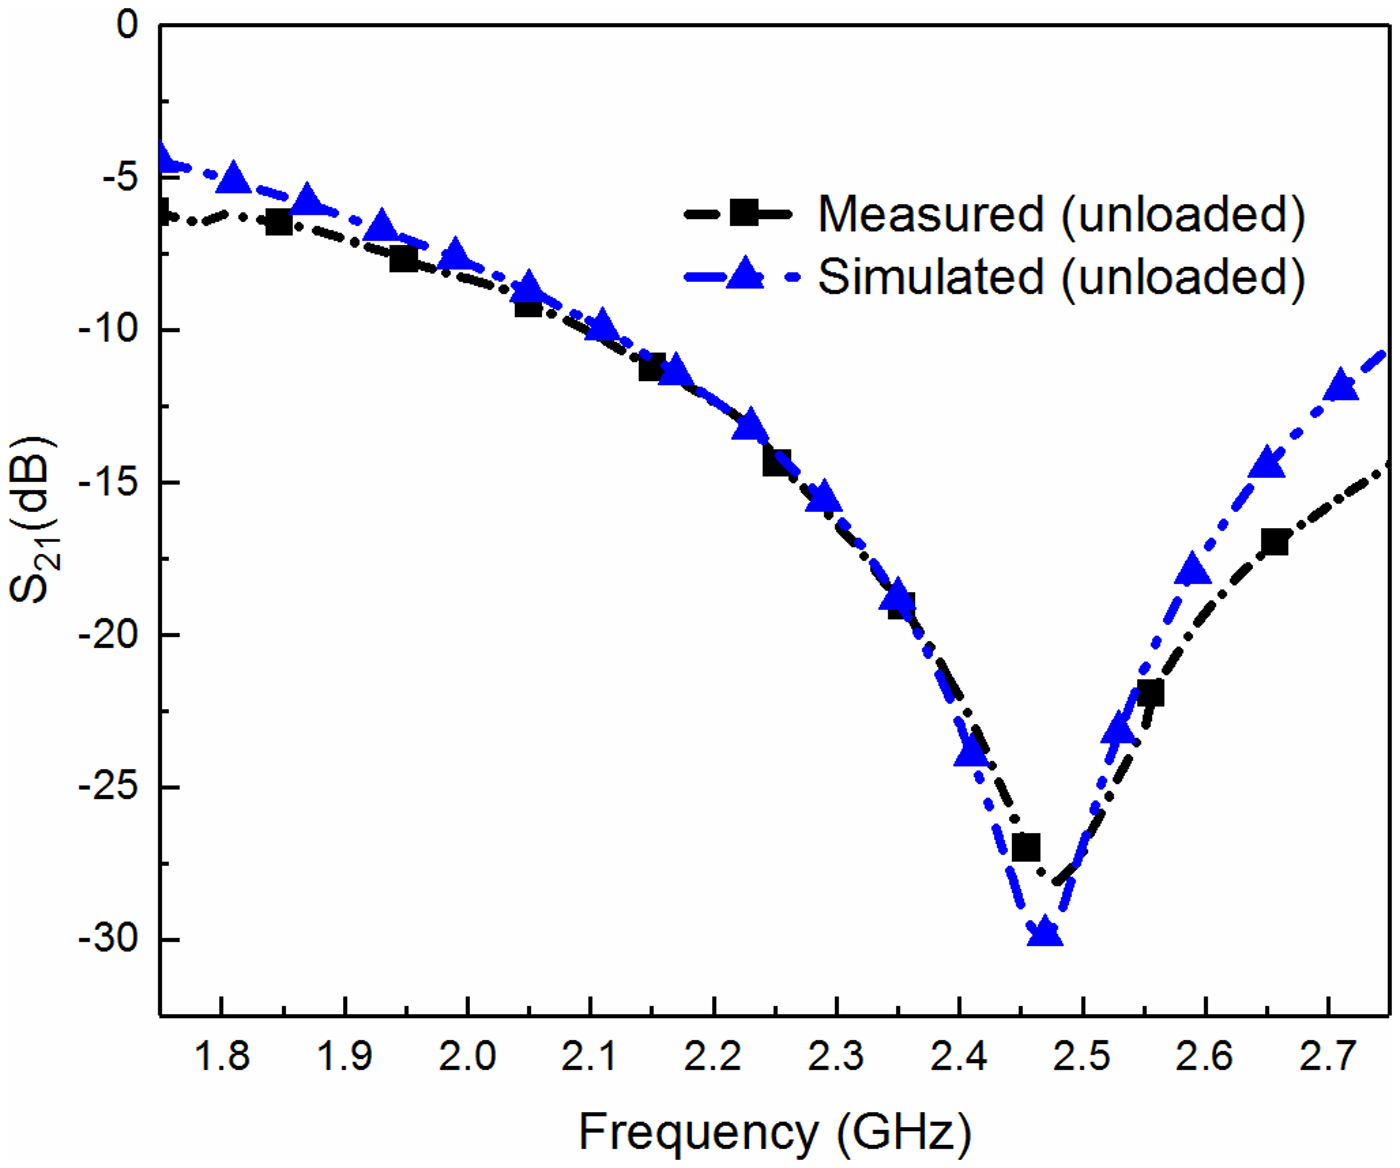
Additionally, each measurement is repeated six times, and the average value is recorded to reduce the repeatability error in the measurement. It is to be noted that all the measurements are performed at room temperature. The S-parameter of the unloaded biomedical sensor is measured and compared with its simulated counterpart as shown in Fig. 6. A close agreement between them validates the design of the fabricated prototype. A small difference between the measured and simulated response shown in this figure can be attributed to the fabrication tolerance. However, it is to be noted that the proposed adulteration detection technique solely depends on the measured parameters and hence small discrepancy between the simulated and the measured result will not significantly affect the measured results.
Measured and simulated responses of the unloaded sensor.
Experimental adulteration detection approach
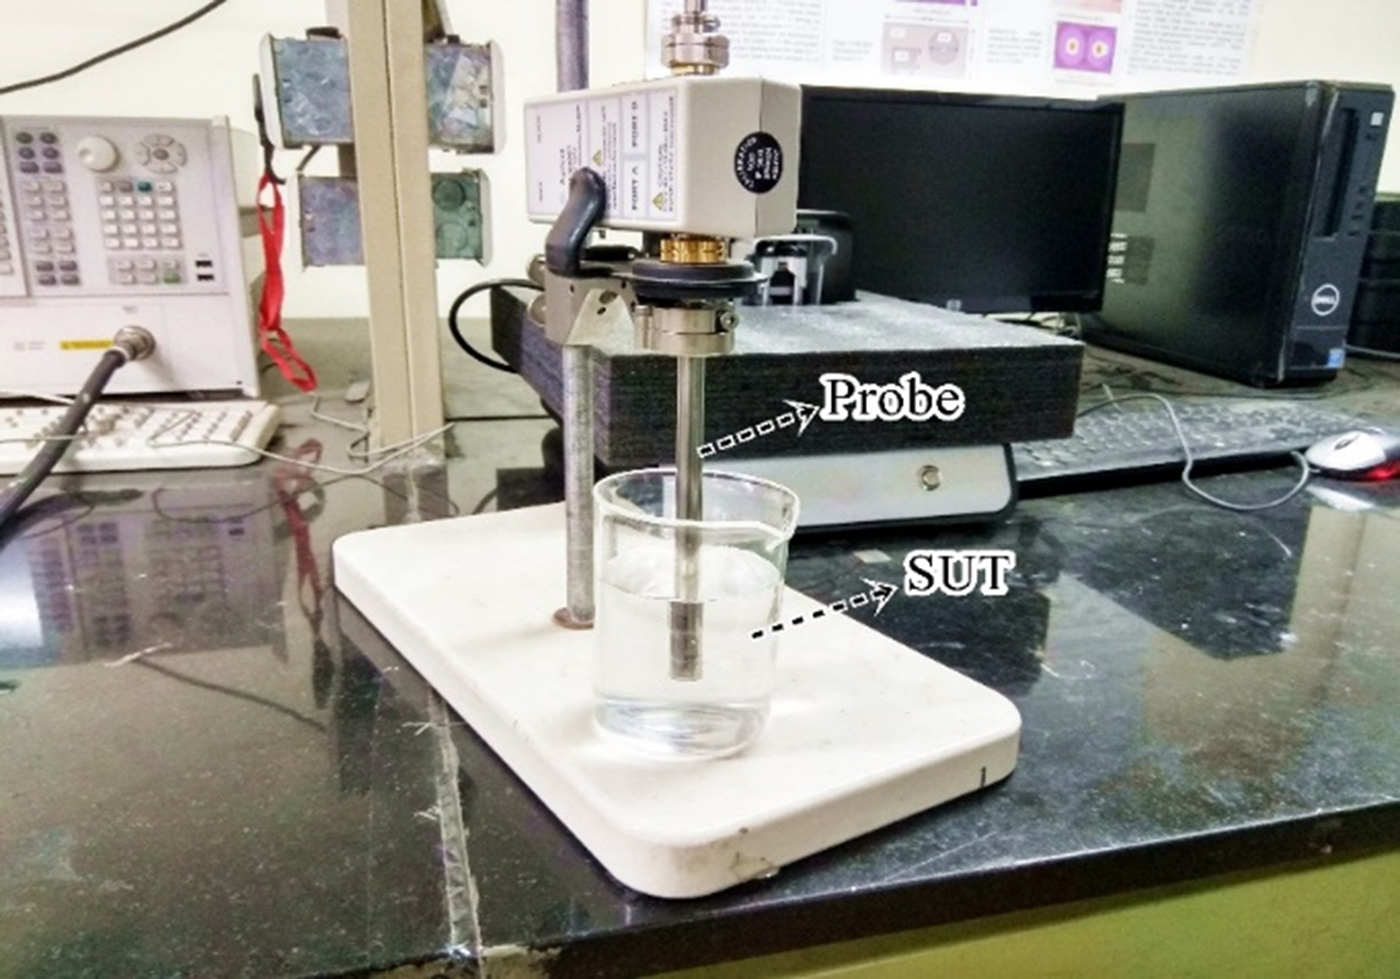
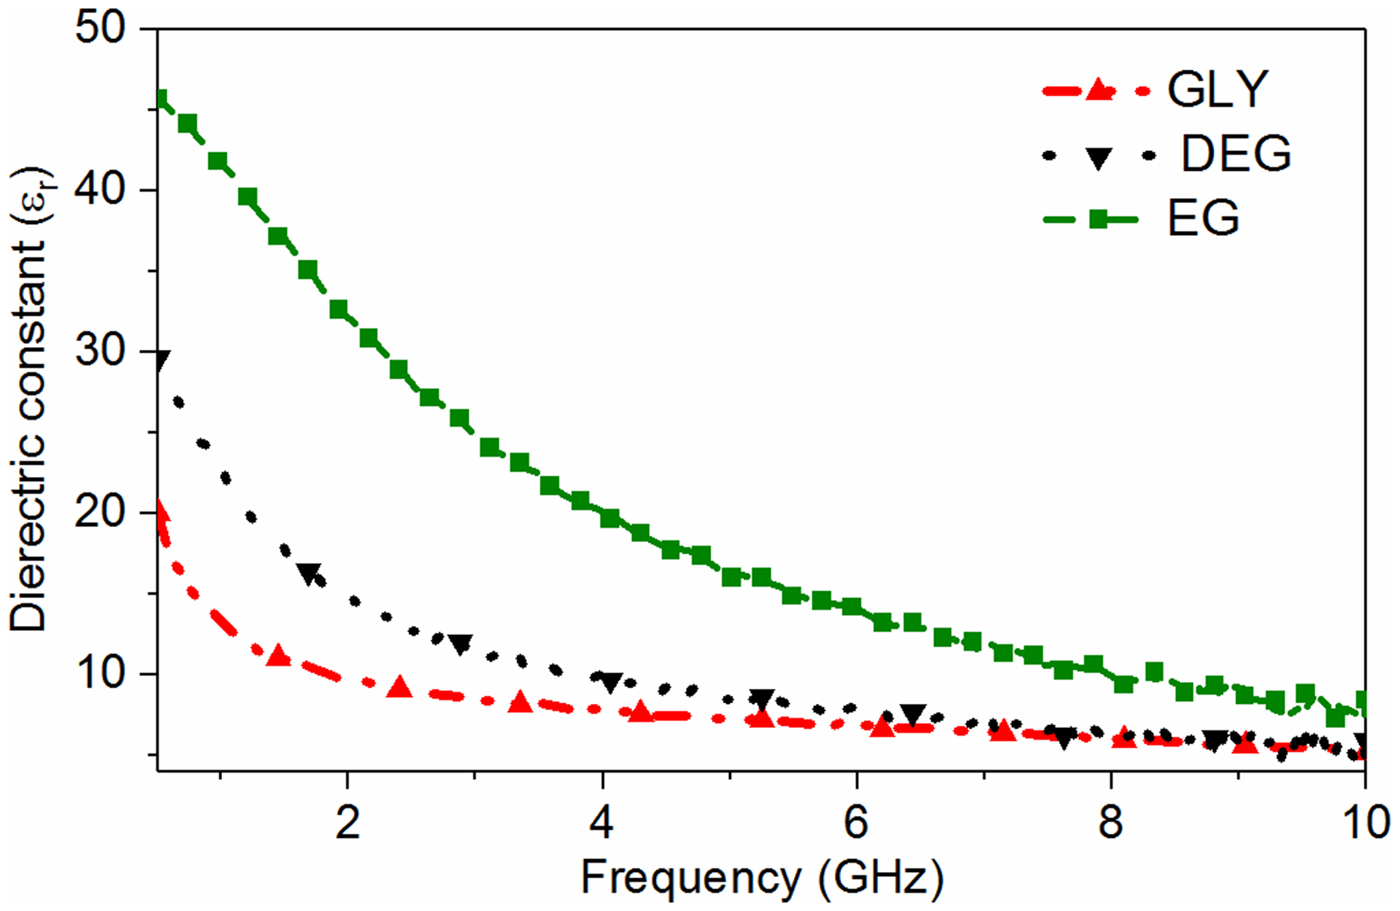
At first, the dielectric property of the tested biomedical chemicals is measured using the Agilent dielectric probe kit, 85070E (Fig. 7) to understand their dielectric behavior in the specified frequency range, 0.5–10 GHz [38]. A plot of the extracted dielectric constant of three different test specimens using the dielectric probe kit is plotted in Fig. 8. From this figure, it can be observed that the difference in dielectric constant between glycerol and DEG is getting decreased with increase in frequency, especially beyond 3 GHz. This basically means that it is very difficult to detect the tiny difference between the dielectric property of DEG and glycerol in this frequency range. On the other hand, the difference in the dielectric constant gets increased in the frequency range below 3 GHz. Hence, the sensor should be designed for lower-frequency range so that it can easily differentiate EG, DEG, and glycerol. However, the sensor size will increase with the decrease in the frequency of operation. Therefore, the realization of the compact biomedical sensor becomes quite complicated in the lower-frequency range. In summary, there is always a trade-off between the available dielectric contrast and size of the RF sensor. Hence, a proper selection of the operating frequency is critical to obtain the best of both regions. This is one of the main reasons to choose an ISM frequency of 2.45 GHz in this work. As a consequence, the realization of a compact sensor with a decent sensitivity of 280 MHz/Δε r is carried out in the noticeable permittivity contrast region. The sensitivity of the sensor can be defined as the relative change in the resonant frequency/S 21 magnitude than that of their unloaded value for unit change in the real permittivity.
Permittivity measurement setup using the dielectric probe kit (85070 E) method.
Measured dielectric constant of three typical liquid test specimens using the probe method.
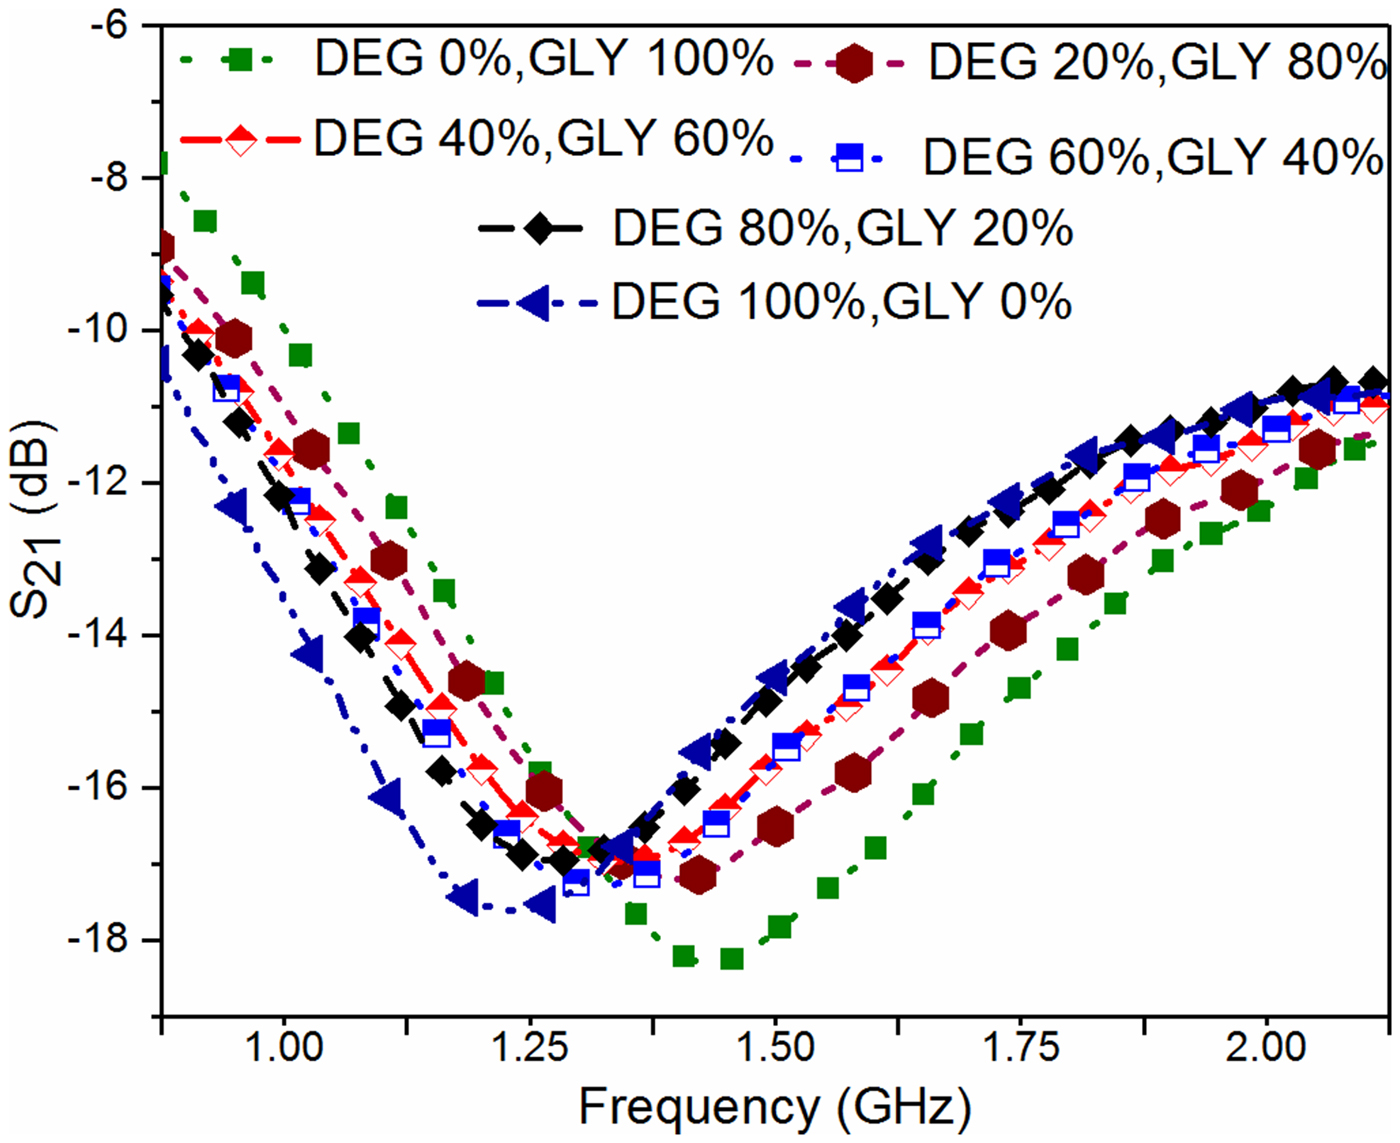
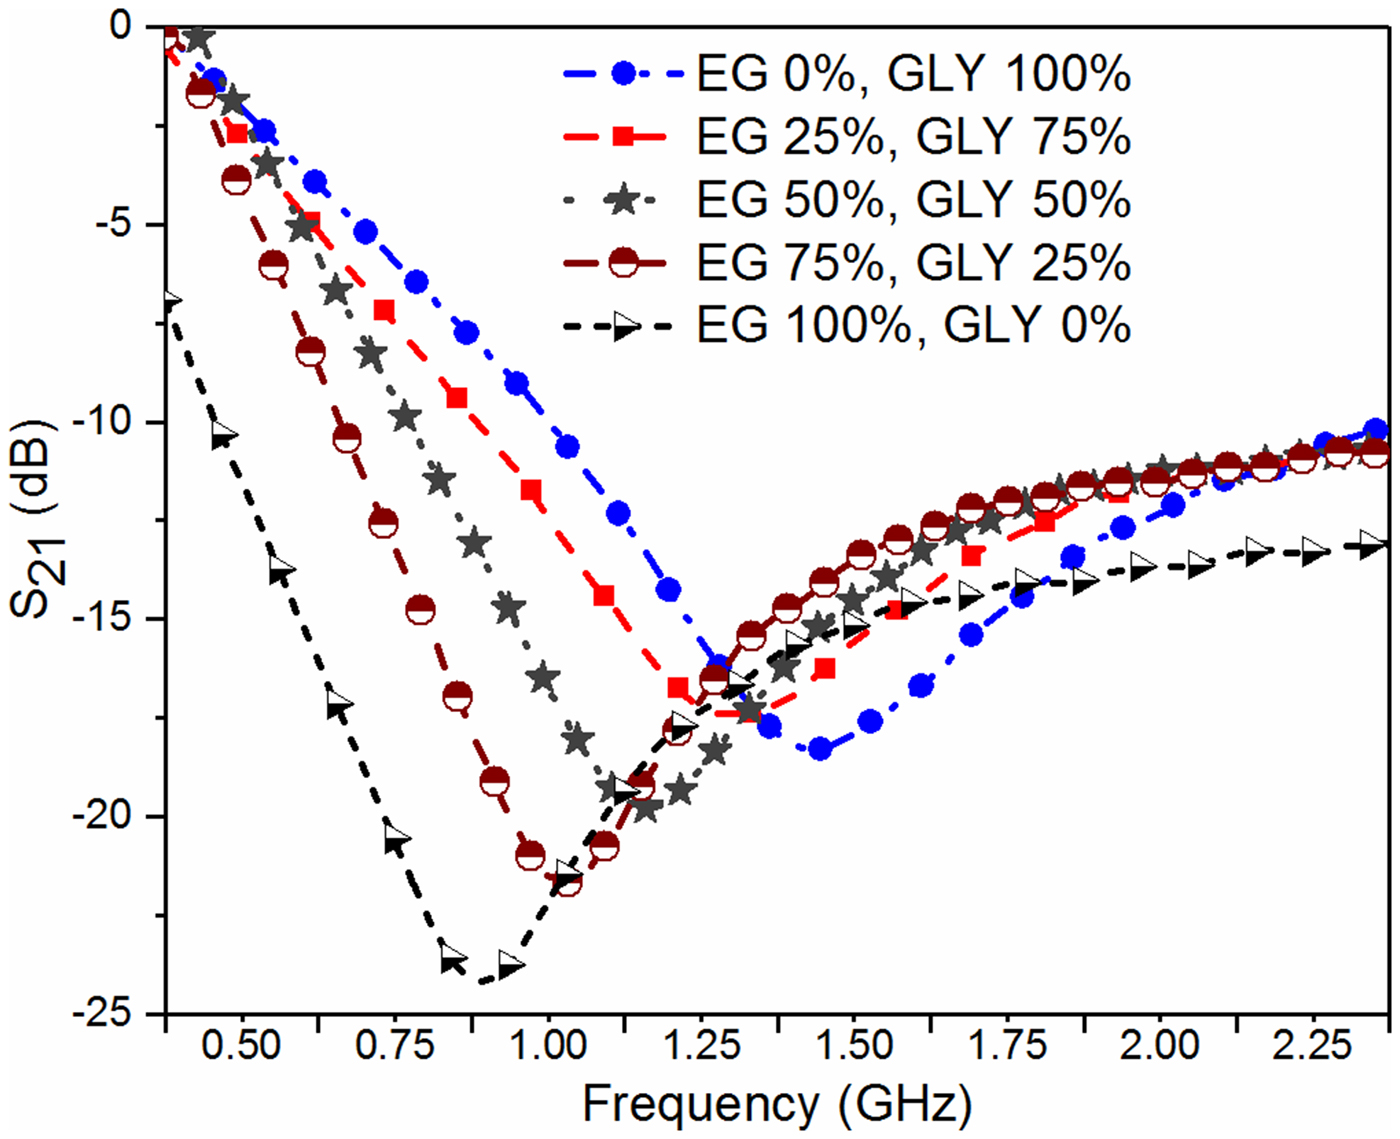
In the next step, the adulteration detection of the biomedical glycerol sample is carried out. The main aim of this work is to detect the presence of toxic adulterants (DEG and EG) in the biomedical grade glycerol samples, used in the medical industry. For this purpose, the glycerol solution of different volume proportions is prepared to mimic the realistic contamination scenario, i.e. deterioration of glycerol with common toxic adulterants. The pure glycerol (GLY) is considered here as the reference solution to record the reference value of the resonant frequency by measuring the corresponding S 21 parameter. After that, the S-parameters corresponding to glycerol with various volume proportions of adulterants are measured to record the resonant frequency as shown in Figs 9 and 10.
Plot of S 21 for various volume proportions of DEG inside the glycerol solution.
Plot of S 21 for various volume proportions of EG concentration inside the glycerol solution.
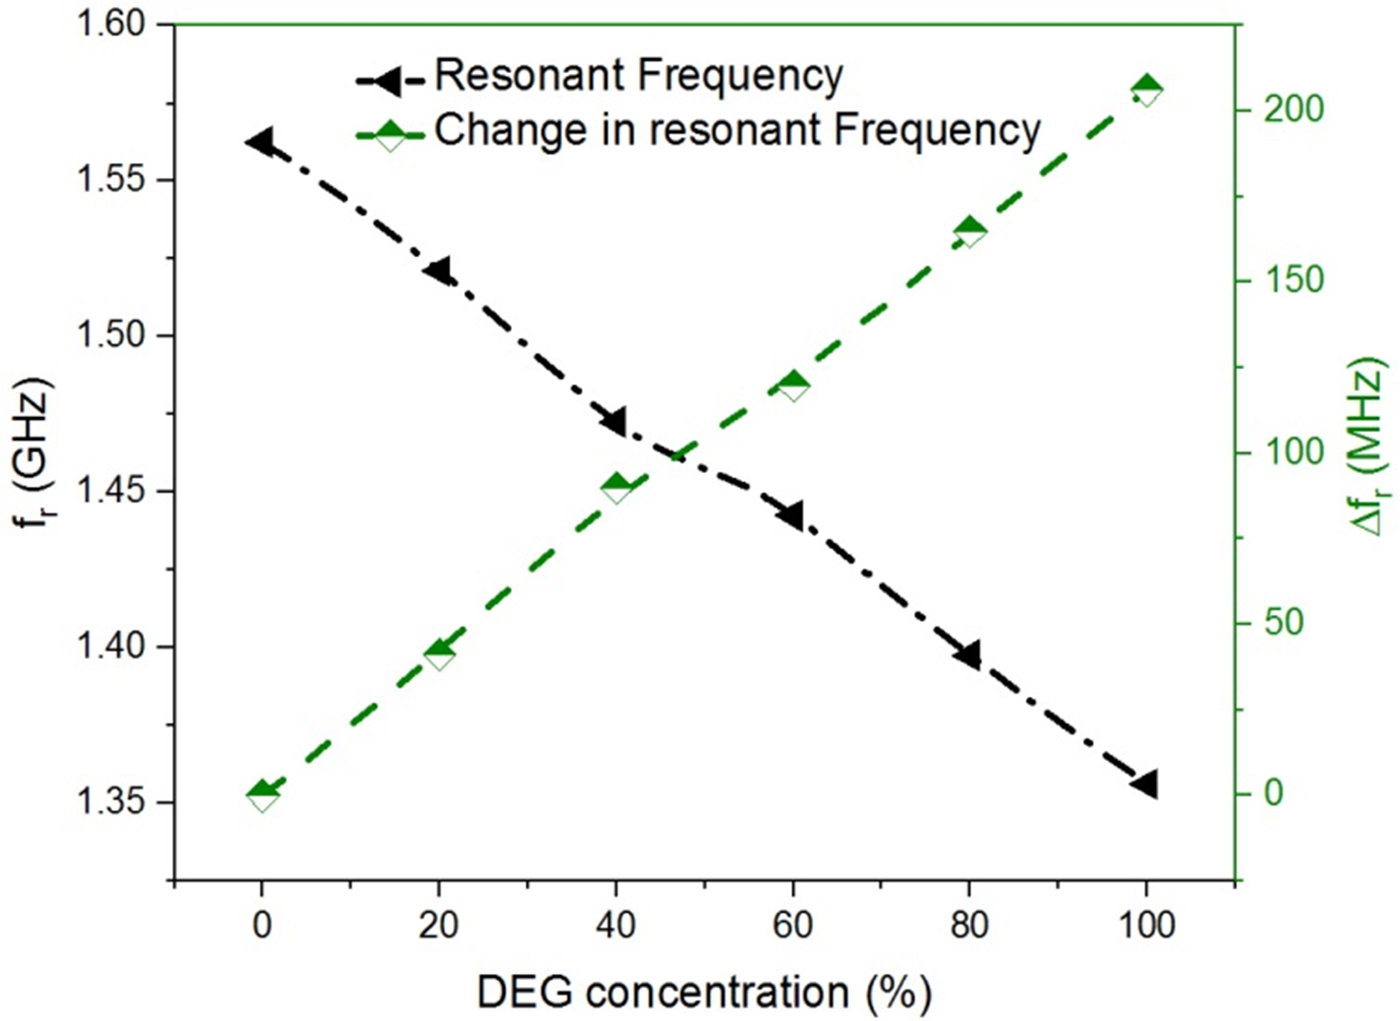
The effort is made here to maintain the nearly constant volume of the test solution for each subsequent measurement such that the error in the measurement due to uncertainty in the sample volume can be minimized. Figures 11 and 12 show the variation of measured resonant frequency/change in resonant frequency for the corresponding difference in the volume proportion of adulterant in pure glycerol. A graphical relationship between the measured resonant frequency/shift in the resonant frequency and percentage adulteration of DEG and EG is established to quantify the contamination level as shown in Figs 11 and 12.
Graphical relationship between the measured resonant frequency/shift in resonant frequency and DEG concentration (%).
Graphical relationship between the measured resonant frequency/shift in resonant frequency and EG concentration (%).
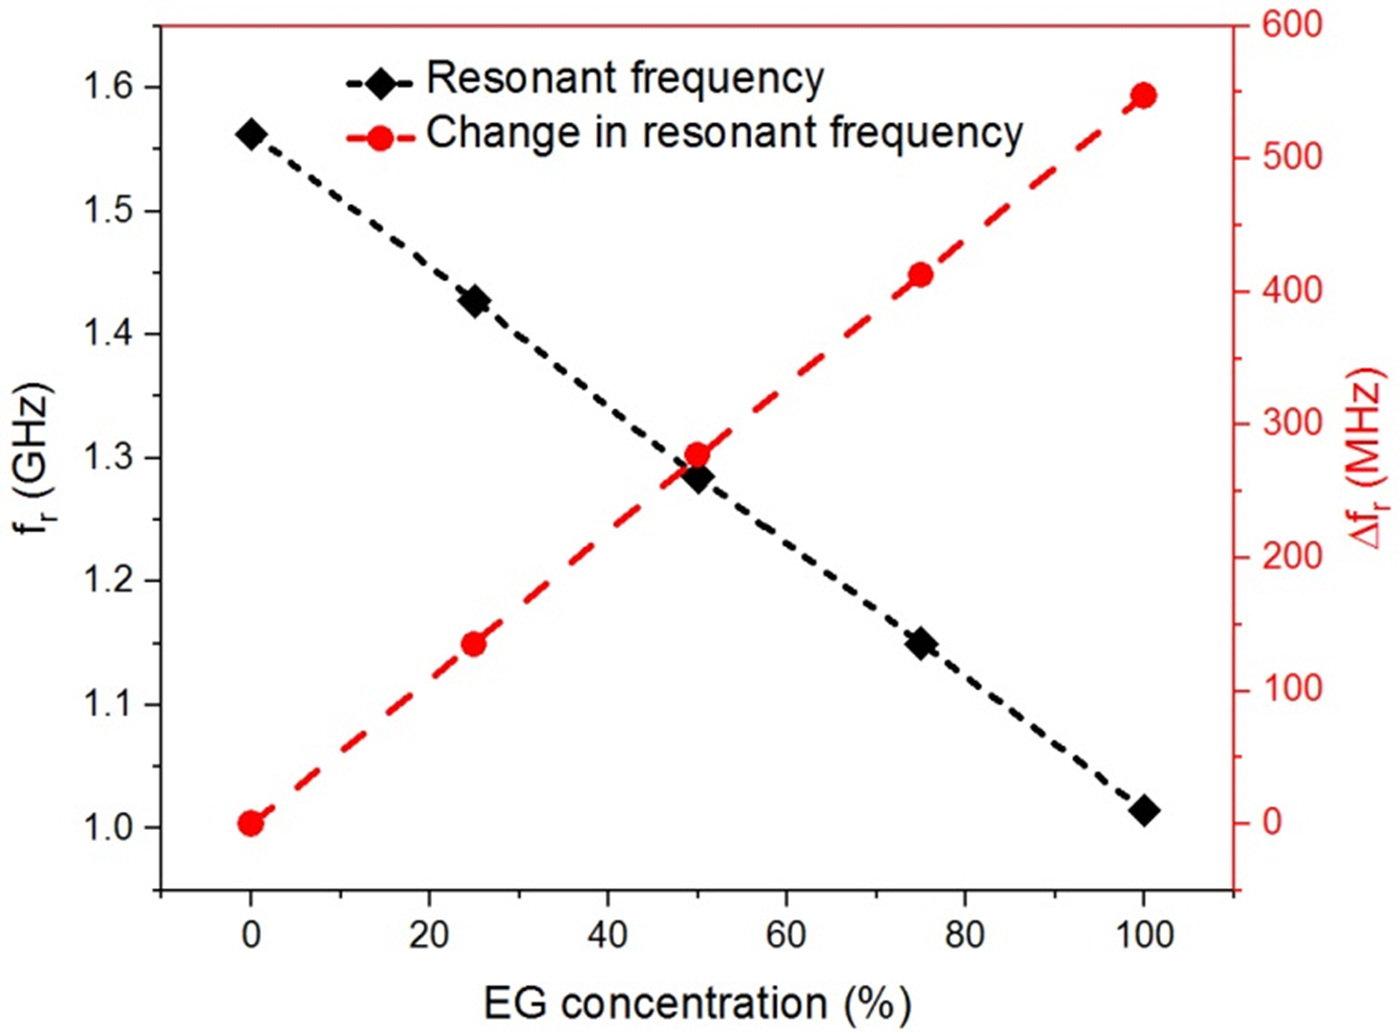
From these curves, one can quickly detect the level of adulteration in pure glycerol using the measured resonant frequency/change in resonant frequency. For example in the present case, a specified adulteration level corresponding to DEG and EG of 2 and 1% respectively that can be resolved without ambiguity with the proposed sensor prototype. The measurement uncertainty error in resonant frequency is limited to 2 MHz.
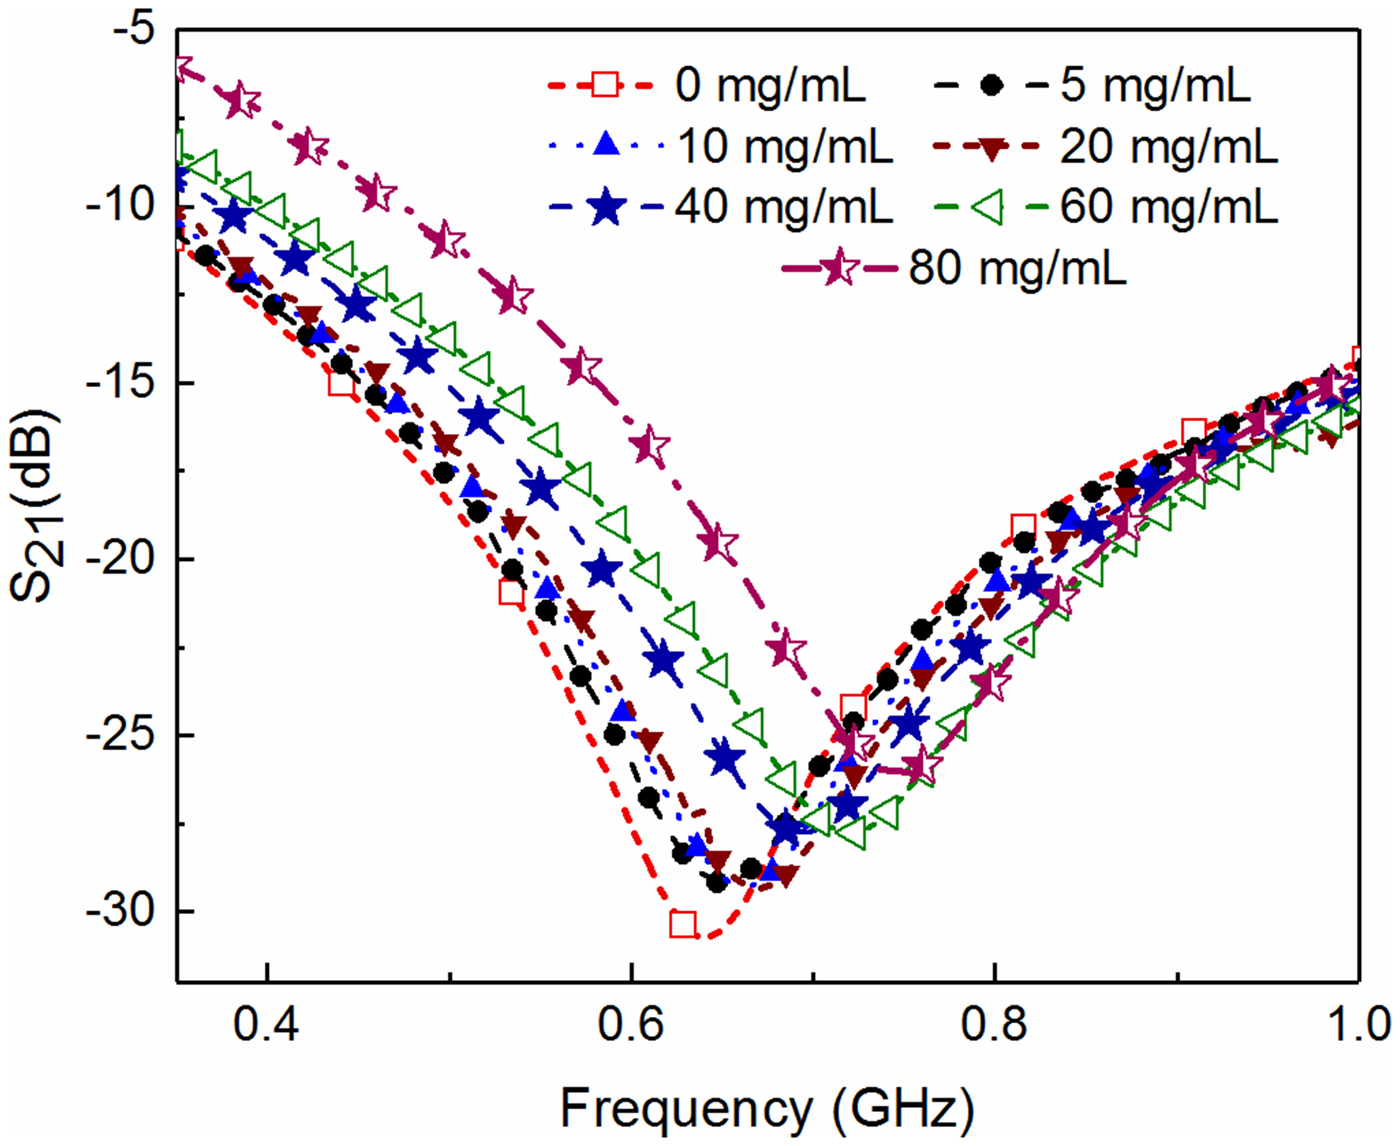
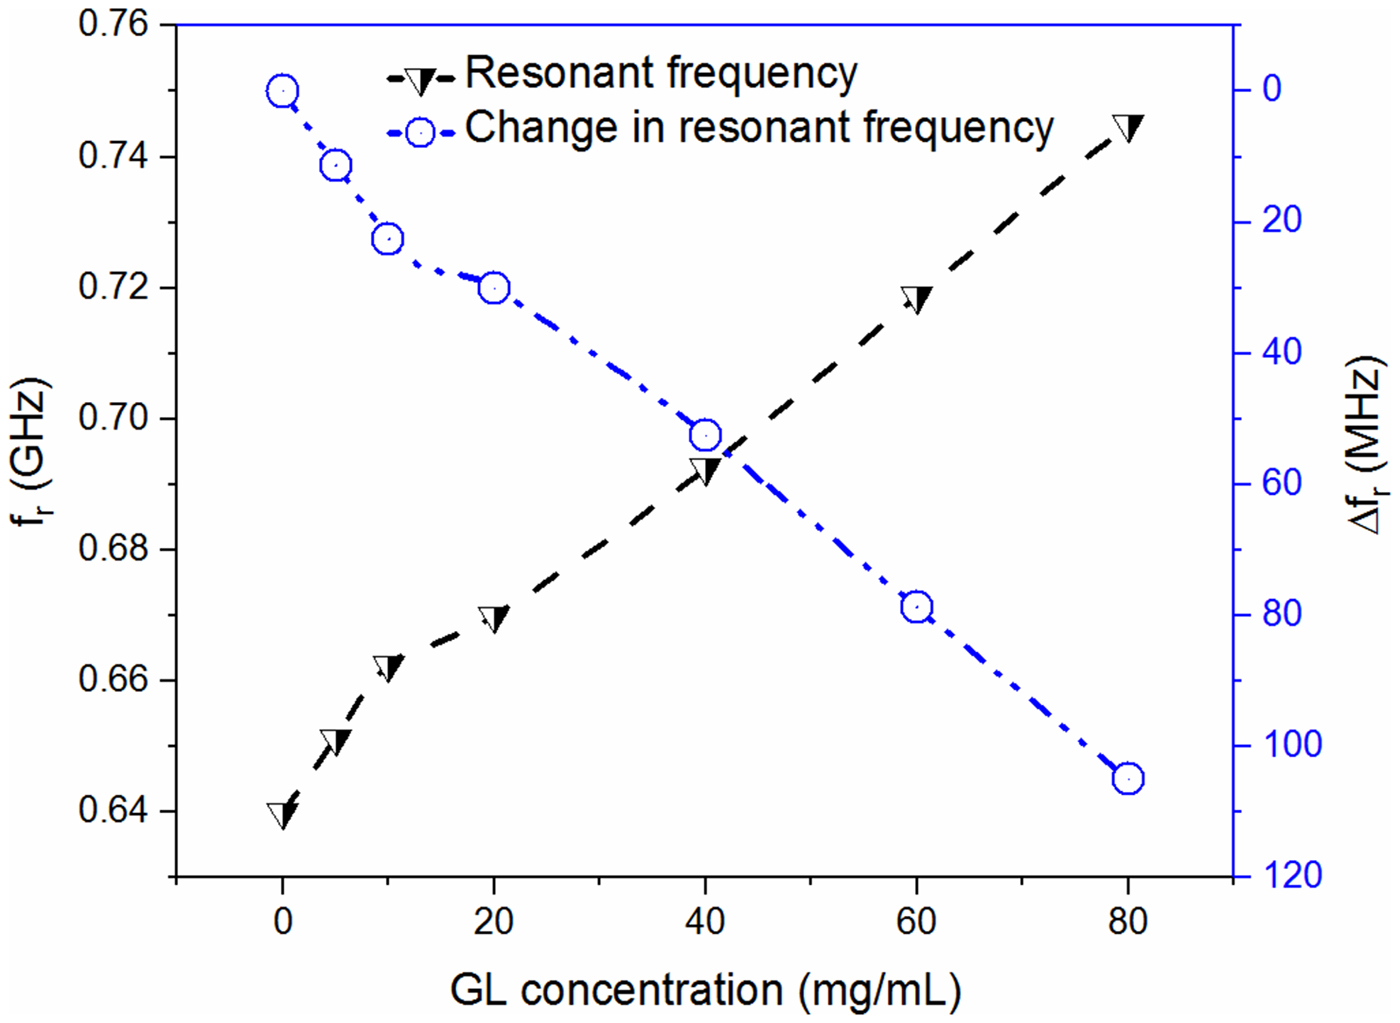
Finally, the concentration detection of glucose solution and adulteration detection of the biological sample glycerol is carried out. The glucose solution of different volume proportions is prepared to mimic the practical scenario (dissolved glucose concentration) of a diabetic condition and natural composition of various fruit juices and edible-energy drinks. The solution with 0% glucose concentration is considered as the reference liquid without any presence of the target specimen (glucose). The S-parameters corresponding to various volume proportions of glucose are then measured to record the resonant frequency as shown in Fig. 13. Specially designed liquid holder helps to maintain the nearly constant volume (~2 µl) of test solution for each subsequent measurement which avoids any error in the measurement that might be caused due to uncertainty in the measured sample volume. Finally, a graphical relationship between the measured resonant frequency/change in resonant frequency and percentage concentration of the glucose is developed, shown in Fig. 14. From this curve, it can be observed that any arbitrary percentage concentration of glucose inside the solution can be detected using the measured/change in resonant frequency. Here it is to be noted that maximum repeatability error corresponding to liquid testing is found to be lower than 750 kHz, however the resonant frequency corresponding to 2 mg/ml is ~4 MHz. This basically means that the specified concentration level 0.5 mg/ml can be identified using the proposed sensor with reasonable accuracy. Table 1 shows the comparative analysis of state-of-the-art glucose sensors with their respective parameters. The sensitivity (S (mg/ml)) of various sensors denotes the change in measured parameters i.e. resonant frequency (f r), phase, and magnitude of S 21 corresponding to change in glucose concentration (mg/ml−1). It is found that the performance of the proposed sensor is relatively better than the most of the earlier proposed RF sensors as summarized in Table 1. It basically means that the proposed sensor can quite conveniently be used for the detection of an arbitrary glucose level ranging from small (0 mg/ml) to large variation (80 mg/ml) including the normal blood glucose concentration range (72–99 mg/dl) as shown in Figs 13 and 14. Hence, it can be ascertained that the proposed sensor can in principle be employed to detect the normal blood sugar range (lower range of glucose concentration), which might be helpful in designing the futuristic wearable blood glucose sensor. Moreover, the proposed sensor can also accommodate the presence of glucose concentration in various consumable energy drinks and fruit juices where usually the higher range of glucose concentration remains present.
Plot of S 21 for various volume proportions of glucose concentration inside the liquid solution.
Graphical relationship between the measured resonant frequency/shift in resonant frequency and glucose concentration (mg/ml).
State of art techniques for detection of glucose concentration using microwave sensors.

#S (mg/ml) represents the sensitivity.
From this table, it can also be ascertained that the proposed sensor might provide the prominent solution to the biomedical industry to design and implement a biodegradable flexible RF sensor system unlike the conventional nonflexible RF sensors for glucose concentration detection. Therefore, the designed sensor might pave the path to develop wearable RF sensors to detect the blood glucose concentration of the diabetic patient for monitoring the hyperglycemia/hypoglycemia. At this moment, the in-vitro glucose concentration detection capability (Fig. 5) and conformability of the sensor prototype (Fig. 3), multi-layered detection capability (Fig. 4) are verified. The conformability of the fabricated sensor can be appreciated from Fig. 3, where the sensor is bent up to the certain angle ~45° to mimic the body part curvature.
The measurement is also carried out with finite bending of the sensor to pave the path for a design of in-vivo flexible/wearable sensor system. The sensor performance under a multi-layered model is studied to get the preliminary idea about the applicability of the designed sensor on the human body which can usually be considered as the multi-layered. The actual implementation of the in-vivo flexible sensor system is currently under investigation which mainly requires the actual human blood with different glucose concentrations and the sensor performance analysis over the targeted human body area in compliance with the medical industry ethical guidelines. As, in real scenario, a human body consists of several layers (protein-lipid-protein, muscles) with their specific dielectric signature in addition to the actual target under investigation (dissolved glucose in the blood) and hence a careful study is required to get insight into the biological effect of non-invasive RF interaction with direct human body contact.
Conclusion
A flexible, biodegradable, RF biosensor using the IDC has been designed and experimentally tested for non-invasive testing of small quantity of biological fluids. The proposed flexible sensor conforms to wearable electronics as it has been found using both numerical and experimental analyses that there is a negligible shift in the resonant frequency with change in the bending radius of the device. The fabricated RF sensor based on the optimized design has been tested for two different aspects of the biomedical industry such as monitoring the glucose concentration and detection of toxic adulterant in a biological glycerol sample. In the present case, the glucose concentration has been varied from 0 to 80 mg/ml to record the corresponding change in the resonant frequency for a typical volume of 2 µl of the solution under test. From the measured change in the resonant frequency of the fabricated prototype, it has been found that the sensitivity of the fabricated sensor is 2 MHz/(mg/ml). A graphical relationship has been developed to relate the measured resonant frequency/change in resonant frequency with the corresponding change in glucose concentration and change in adulterant concentration. These relationships basically help to find any arbitrary concentration of test solutions by using the measured resonant frequency or resonant frequency shift. The tested ranges of glucose concentration can accommodate the presence of glucose concentration in blood, and natural composition of various edible fruit juices and energy drinks. Adulteration of the glycerol with the toxic adulterants DEG and EG has been experimentally detected by measuring the corresponding shift in the resonant frequency. The specified glucose concentration level 0.5 mg/ml can unambiguously be identified using the proposed sensor with reasonable accuracy while specified adulteration level corresponding to DEG and EG of 2 and 1%, respectively that can be resolved without ambiguity with the proposed sensor. The proposed sensor can potentially be used in the biomedical industry for humanitarian applications to estimate the level of adulteration in biological samples, and to detect the dissolved glucose concentration in the human blood due to the some of its excellent properties such as bio-degradability, flexibility, and non-invasive testing capability. The development of the standalone RF bio-sensor for the in-vivo non-invasive monitoring of blood glucose is currently under investigation, which would basically take into consideration the direct RF interaction with different layers of human body including the skin, the fat, the blood vessel, etc.
Acknowledgement
This work is partially supported by the Department of Science and Technology (DST) under grant DST/EE/2016307. The authors thank Mr. Kapil Saraswat, Research Scholar Antenna lab, IIT Kanpur for providing flexible substrate and valuable discussion.
 N. K. Tiwari (S'15) is with the Department of Electrical Engineering, IIT Kanpur, Kanpur 208016, India. He is currently pursuing his Ph.D. degree at IIT Kanpur, Kanpur, India.
 S. P. Singh (S'13) is currently with IIT Kanpur, Kanpur, India. He is also with the International Institute of Information Technology Bhubaneswar, Bhubaneswar, India.
 D. Mondal was with IIT Kanpur. He is currently with the IIT Roorkee, Roorkee, Uttarakhand, India.
 M. Jaleel Akhtar (S'99–M'03–SM'09) received his Ph.D. degree in electrical engineering from the Otto-von-Guericke University of Magdeburg, Magdeburg, Germany, in 2003. He was a Scientist with the Central Electronics Engineering Research Institute, Pilani, India, from 1994 to 1997, where he was involved in the design and development of high-power microwave tubes. In 2009, he joined the Department of Electrical Engineering, IIT Kanpur, Kanpur, India, where he is currently a Professor. He has authored two books, two book chapters, and has authored or co-authored over 250 papers in various peer-reviewed international journals and conference proceedings.


