


To understand the psychological foundations of political differences in the general public, social scientists have examined relationships between personality traits—defined as stable tendencies to think, feel, and behave in particular ways—and political preferences, such as policy attitudes, political values, and partisan and ideological identities. This area of research has received a great deal of scholarly attention over the last two decades (for an overview, see Federico and Malka Reference Federico and Malka2018). Moreover, its key findings have been covered frequently in the news media, often to inform discussion of the nature and consequences of political polarization (e.g., McAdams Reference McAdams2016; Edsall Reference Edsall2020).
Studies in this area have mainly used cross-sectional designs in which personality traits and political preferences are measured within the same political survey. In almost all cases, this work has implicitly or explicitly assumed that associations between personality and political preferences reflect unidirectional causal influence of the former on the latter. However, recent work has raised questions about this assumption and has introduced the possibility that political preferences might influence personality, or at least self-perceptions thereof (Boston et al. Reference Boston, Homola, Sinclair, Torres and Tucker2018; Fatke Reference Fatke2017; Hatemi and Verhulst Reference Hatemi and Verhulst2015; Ludeke, Tagar, and DeYoung Reference Ludeke, Tagar and DeYoung2016; Luttig Reference Luttig2021).
If part of the well-documented associations between personality traits and political preferences reflect a causal influence of political preferences on self-reports of personality, this would have important implications. Theoretically, this would require scholars to reconsider the extent to which political differences are rooted in deep-seated personality traits. Empirically, this would mean that models specifying unidirectional influence of personality on political preferences—that is, almost all the analytic models in this research area—overestimate the magnitude of this causal influence. And normatively, an effect of political preferences on self-reported personality traits would suggest that political polarization may be exacerbated by political opponents adopting, or perceiving themselves as possessing, opposite personality attributes.
Based on these considerations, we report the results of five studies that seek to gauge the causal influence of political preferences on self-reported personality traits. This includes longitudinal studies from three different countries—two of which were preregistered—and two preregistered survey experiments. In the preregistered analyses of panel and experimental data, we find evidence that self-reports of personality are to some extent endogenous to political preferences. Although the estimated causal influence of political preferences on personality traits is small, these estimates are not much different in magnitude from those of the effect of personality traits on political preferences—the causal direction that is generally presumed to explain personality–politics associations. We discuss theoretical, methodological, and normative implications.
WHY MIGHT POLITICS INFLUENCE PERSONALITY?
The most common inference drawn from personality-politics research is that left versus right ideological differences are caused, in part, by a set of traits pertaining to a closed, rigid, and structure-seeking versus open, flexible, and ambiguity-tolerant experiential pattern (Federico and Malka Reference Federico and Malka2018; Johnston, Lavine, and Federico Reference Johnston, Lavine and Federico2017). Three frequently studied individual differences within this family of “closed versus open” traits are conscientiousness, openness to experience, and authoritarianism.
Openness and conscientiousness come from the Big Five taxonomy, which represents the structure of broad traits that efficiently summarize a wide range of personality differences. Right-wing political preferences are found to correlate positively with conscientiousness and negatively with openness to experience (Gerber et al. Reference Gerber, Huber, Doherty, Dowling and Ha2010; Sibley, Osborne, and Duckitt Reference Sibley, Osborne and Duckitt2012). This is said to be because conscientiousness reflects, in part, a need for order and structure, which is satisfied by right-leaning political policy. In contrast, openness to experience reflects an inclination toward variety-seeking, intellectual, and artistic styles that attract people to the political left. Meanwhile, dispositional authoritarianism—a widely studied trait reflecting variation in preference for obedience, conformity, and order—has tended to correlate positively with certain right-wing political preferences (Feldman and Stenner Reference Feldman and Stenner1997; Stenner Reference Stenner2005). This association between right versus left political preferences and traits such as conscientiousness, openness, and authoritarianism suggests that the primary dimension of political conflict is psychologically deep-seated and, therefore, difficult to mitigate through mutual understanding and compromise (Hibbing, Smith, and Alford Reference Hibbing, Smith and Alford2014).
A core assumption in the personality-politics literature is that personality traits are stable dispositions that shape how people respond across situations. Indeed, personality traits display high rank-order stability (Roberts and DelVecchio Reference Roberts and DelVecchio2000), have sizable heritable components (Vukasović and Bratko Reference Vukasović and Bratko2015), and predict a wide range of behavioral criteria and life outcomes (Soto Reference Soto2019). However, personality traits can change over a persons’ life time (Damian et al. Reference Damian, Spengler, Sutu and Roberts2019), and some interventions have succeeded in changing people’s levels of personality traits (Magidson et al. Reference Magidson, Roberts, Collado-Rodriguez and Lejuez2014; Stieger et al. Reference Stieger, Wepfer, Rüegger, Kowatsch, Roberts and Allemand2020). This raises the possibility that in addition to causing political preferences, personality traits might, in part, be a consequence of political preferences. After all, even demographically based identities—such as religiosity and sexual orientation—appear to be influenced in part by political preferences (Egan Reference Egan2020; Margolis Reference Margolis2018). This might be true for personality traits as well.
There are two broad mechanisms by which political preferences might causally influence people’s self-reported personality traits. The first has to do with right-wing and left-wing people’s tendency to surround themselves disproportionately with politically like-minded others (Boutyline and Willer Reference Boutyline and Willer2017; Huber and Malhotra Reference Huber and Malhotra2017). Given the powerful influence of group norms on behavior (Terry and Hogg Reference Terry and Hogg1996), people may come to adopt the behavioral and experiential tendencies of politically like-minded others, which would register in self-report measures of personality traits.
The second mechanism has to do with identity and motivated self-perception. Left- and right-wing people often become aware of the traits associated with stereotypes of their ideological groups (Ahler and Sood Reference Ahler and Sood2018; Rothschild et al. Reference Rothschild, Howat, Shafranek and Busby2019). In political contexts, such as political surveys or political discussions, people might be motivated to represent themselves as similar to stereotypical others in their ideological group (Ludeke, Tagar, and DeYoung Reference Ludeke, Tagar and DeYoung2016; Ludeke, Weisberg, and DeYoung Reference Ludeke, Weisberg and DeYoung2013; Turner Reference Turner1985). Moreover, in the context of a political survey, they might assign greater weight to memories of acting and experiencing in an ideologically “consistent” way when responding to personality trait items (Zaller and Feldman Reference Zaller and Feldman1992).
A few longitudinal studies to date have examined whether specific psychological attributes assumed to cause political preferences are, at least to some extent, caused by political preferences. Analyses of panel data from Australia and the United States (1–3.5 year intervals) have provided evidence consistent with political ideology exerting a causal influence on “binding moral foundations,” reflecting values of group loyalty, respect for authority, and purity/sanctity (Hatemi, Crabtree, and Smith Reference Hatemi, Crabtree and Smith2019; Smith et al. Reference Smith, Alford, Hibbing, Martin and Hatemi2017). And analyses of panel data from New Zealand (1-year interval) and Belgium (6-year interval) were consistent with egalitarian political attitudes exerting a positive causal influence on empathy (Sidanius et al. Reference Sidanius, Kteily, Sheehy-Skeffington, Ho, Sibley and Duriez2013). These studies show the potential of political preferences to influence psychological attributes. However, because of the types of psychological constructs they measure, these studies provide limited information about the dominant emphasis in personality-politics research—the relationship between the broad open versus closed family of traits and left versus right political preferences.
To the best of our knowledge, there are four longitudinal studies that more directly address this matter. First, in a six-wave American panel spanning 22 months, increased approval of President Obama and decline in approval of a Republican-controlled Congress predicted increases in self-reported openness to experience (Boston et al. Reference Boston, Homola, Sinclair, Torres and Tucker2018). Second, Luttig (Reference Luttig2021) found reciprocal relationships between authoritarianism and support for the Republican party. Third, using Australian panel data spanning 10 years, no lagged effect of political ideology on openness to experience was found (Hatemi and Verhulst Reference Hatemi and Verhulst2015). Fourth, using panel data from New Zealand spanning nine years, no effects of political ideology on openness to experience were found (Osborne and Sibley Reference Osborne and Sibley2020).Footnote 1
Though informative, these studies possess methodological features that limit the conclusions one may draw from their findings. The first and second studies (Boston et al. Reference Boston, Homola, Sinclair, Torres and Tucker2018; Luttig Reference Luttig2021) focused exclusively on presidential and congressional approval and did not directly assess political policy preferences. The third study (Hatemi and Verhulst Reference Hatemi and Verhulst2015) used different measures of openness and political preferences across the two measurement occasions, precluding direct comparisons of people’s personality traits and political preferences across the waves. The third (Hatemi and Verhulst Reference Hatemi and Verhulst2015) and fourth (Osborne and Sibley Reference Osborne and Sibley2020) studies focused only on openness to experience and did not address other traits relevant to the open versus closed family of indicators. And most importantly, while panel studies offer Granger causal evidence, internal validity threats still loom because theorized causal variables are not exogenously manipulated.
THE PRESENT RESEARCH
Prior work leaves unclear the matter of whether political preferences in part influence self-reports of personality traits. We examine this possibility with analyses of panel datasets from three different countries (with design and analysis plan preregistered in two of these) as well as two survey experiments from the United States (with design, analysis plan, and predictions preregistered in both). The Online Appendix on the APSR website provides item wording and results belonging to the main tests of the hypotheses. The Supplementary Information contains additional information and robustness checks and is placed in the American Political Science Review Dataverse (Bakker, Lelkes, and Malka Reference Bakker, Lelkes and Malka2021).
First, we used cross-lagged panel models (CLPMs) to examine the causal direction in population-based longitudinal panel studies from the Netherlands, Germany, and the United States. Each panel spans a long time interval and includes validated measures of personality traits from the open versus closed family and measures of political preferences.
CLPMs, at best, offer Granger causal evidence (Rogosa Reference Rogosa1980; Vaisey and Miles Reference Vaisey and Miles2017). To overcome this issue, we conducted two well-powered two-wave between-subjects survey experiments, with preregistered hypotheses and analysis plans (Big Five: https://osf.io/kqexp/; Authoritarianism: https://osf.io/7bgrm/). Though experimental manipulation of political preferences is not feasible, the potential causal influence of political preferences can be indirectly addressed through an experimental procedure that makes political preferences salient for some but not other respondents. This corresponds with the approach taken by political scientists and psychologists of priming religiosity to gauge the causal influence of religious sentiment, a personal attribute that is not directly manipulable (Ben-Nun Bloom and Arikan Reference Ben-Nun Bloom and Arikan2013; Margolis Reference Margolis2018). If exogenously manipulated political preference salience causes people to report personality traits that are more consistent with previously assessed political preferences, this would suggest that having political preferences in mind causes one to represent oneself as having a more politically congruent personality. We, therefore, tested the preregistered prediction that those primed with politics, compared with those in a control condition, would subsequently report levels of conscientiousness and openness to experience (Big Five experiment) or authoritarianism (Authoritarianism experiment) that are more consistent with the political preferences that they had reported in an earlier assessment.
With these two distinct approaches to diagnosing causal influence, our study is the first to combine large population-based panel data from multiple countries with experimental data to gauge the potential effects of political preferences on self-reported personality traits.
TESTS USING CROSS-LAGGED PANEL MODELS
We conducted tests of the hypothesis that increases in right-wing (conservative) political preferences cause a more “closed” personality—that is, high conscientiousness, low openness, and high authoritarianism—in the Netherlands (LISS panel), Germany (GESIS panel), and the United States (GSS panel). These panels contain measures of personality and political preferences at three occasions over long periods (Netherlands = 11 years; Germany = 5 years; US = 4 years). We preregistered hypotheses, methods, and analysis strategy before gaining access to the data (Van den Akker et al. Reference Van den Akker, Weston, Campbell, Chopik, Damian, Davis-Kean and Hall2019) for the German GESIS panel (here: https://osf.io/2bx8c/) and the American GSS panel (here: https://osf.io/h67p5/) but not for the Dutch LISS panel. Table 1 provides an overview of the three panel studies. The panel studies adhere to APSA’s Principles and Guidance for Human Subject Research (see Online Appendix [OA] 7.1).
TABLE 1. Overview of the Design Characteristics of the Panel Studies in the Netherlands, Germany and the United States

Academic norms for analyzing the reciprocal relationship between two variables using longitudinal data vary considerably between disciplines. Political scientists have typically relied on the traditional CLPM (Finkel Reference Finkel1995); see for instance Goren (Reference Goren2005), Lelkes (Reference Lelkes2018), Luttig (Reference Luttig2021), or Margolis (Reference Margolis2018). In this approach, current values of x and y are simultaneously regressed on lagged values of x and y. The lagged dependent variable is included in each of these models to guard against spurious correlations, which can arise due to differing levels of stability in the outcome and predictor variable (Rogosa Reference Rogosa1980).
In Figure 1 we plot the cross-lagged panel model that we used. Positive and statistically significant effects of personality on political preferences from waves 1–2 and waves 2–3 (path T [traditional] in Figure 1) would support the conventional view of personality influencing political preferences. We hypothesized, however, that there would also be significant positive effects of political preference on personality from waves 1–2 and waves 2–3 (path H [hypothesized] in Figure 1).

FIGURE 1. Conceptual Representation of Cross-Lagged Panel Model
Note: T is the path of the traditional personality-politics literature where personality is causing ideology. H is the hypothesized relationship where politics is causing personality.
The Dutch and German samples included measures of conscientiousness and openness to experience, whereas the American sample included measures of authoritarianism. In the Dutch and German samples, we (a) treat each personality measure (openness and conscientiousness) as an indicator of a closed personality, (b) concatenate the measures, (c) include a dummy variable to indicate whether a particular set of observations comes from openness or conscientiousness, and (d) cluster on respondent. This approach, which was preregistered for the German data, maximizes power, and simplifies the presentation of results. Note that throughout the panel studies we used the one-sided p-value of 0.05 as the value for statistical significance, which was preregistered for the German and US panels.
Though the use of CLPMs is quite common and we preregistered the plan to use them, it is important to note that this procedure has limitations. In particular, the traditional CLPM does not distinguish within-person and between-person variance and is ultimately susceptible to omitted variable bias. However, alternatives to the CLPM, most notably the random intercept CLPM (RI-CLPM; Hamaker, Kuiper, and Grasman Reference Hamaker, Kuiper and Grasman2015), also come with biases (Allison, Williams, and Moral-Benito Reference Allison, Williams and Moral-Benito2017; Leszczensky and Wolbring Reference Leszczensky and Wolbring2019; Nickell Reference Nickell1981). In OA 4, we describe these biases and illustrate with our own simulations and analyses how they would be expected to seriously distort conclusions if applied to the present panel data.
Given these limitations and the fact that we preregistered use of the CLPM analyses, we presently report results using CLPM in the main text and results using RI-CLPM analyses in the Online Appendix (the Netherlands, see OA 1.4; Germany, see OA 2.3; the US, see OA 3.4). Most importantly, however, we supplement the panel data analyses with analyses of two preregistered survey experiments that attempt to diagnose causal influence by exogenously manipulating political preference salience.
Nonpreregistered Test in the Netherlands of the Big 5 and Political Preferences
We used data from the Dutch LISS (Longitudinal Internet Studies for the Social Sciences) panel in the Netherlands (Scherpenzeel Reference Scherpenzeel, Das, Ester and Kaczmirek2018). The LISS panel is a representative sample of Dutch individuals who participate in monthly Internet surveys. We used measures of the Big Five personality traits administered in May 2008, May 2013, and May 2019 and measures of political preferences administered during December 2007–January 2008, December 2012, and December 2018–March 2019. Sample sizes for each wave-measure combination appear in Supplementary Information (SI) 1.3.
Closed personality traits were measured with 10-item conscientiousness and openness scales drawn from the International Personality Item Pool (Goldberg Reference Goldberg, Mervielde, Deary, Fruyt and Ostendorf1999). The item wording for the trait measures is provided in Online Appendix 1.1, and the psychometric properties, Cronbach’s α, and average interitem correlation are provided in Supplementary Information 1.3.
As for political preferences, we used measures of left-right ideological self-placement and attitudes toward euthanasia, reducing income gaps, European integration, and immigration. See OA 1.1 for question wording. The correlation coefficients between the personality traits and policy preferences are provided in SI 1.3.
Results
We present the unconstrained cross-lagged regression coefficients.Footnote 2 The RMSEA for all models was 0.07, the CFI was 0.98, and the SRMR was 0.03, which is generally considered a good model fit (Byrne Reference Byrne1994;Hu and Bentler Reference Hu and Bentler1999; MacCallum, Browne, and Sugawara Reference MacCallum, Browne and Sugawara1996; see SI 1.4). We plot the standardized coefficients for personality on political preferences in the left panel of Figure 2 and those for political preferences on personality in the right panel of Figure 2.
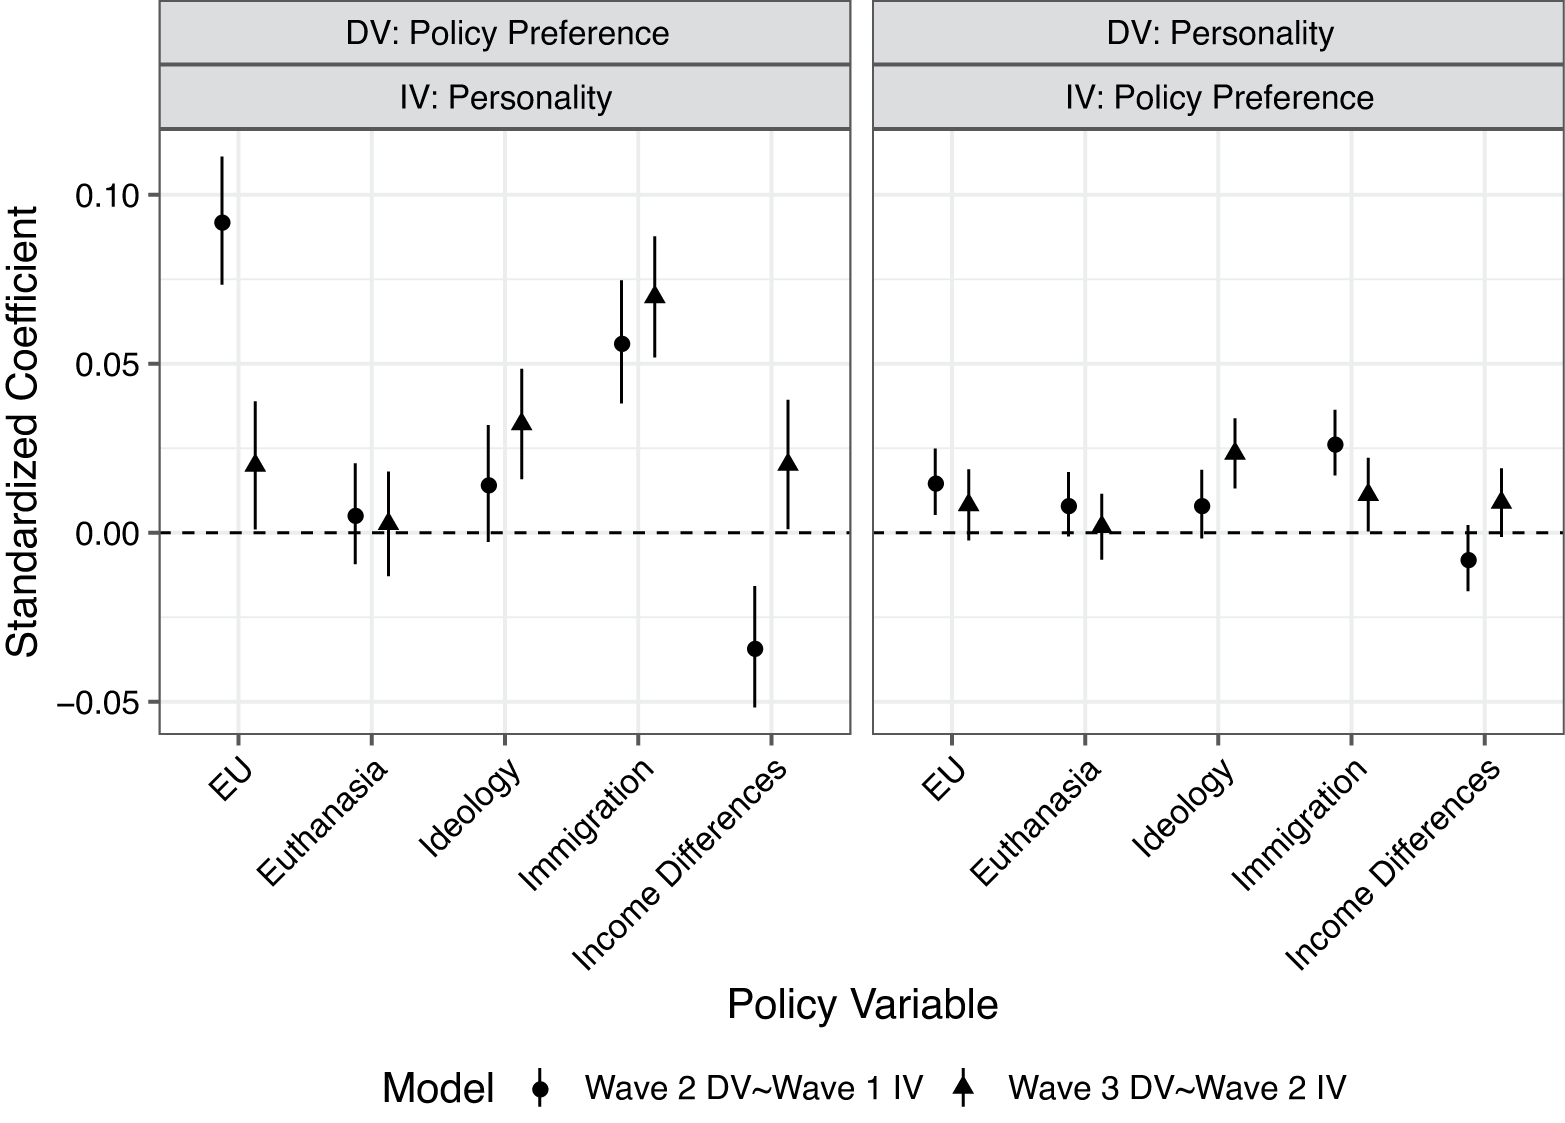
FIGURE 2. Standardized Regression Coefficients from Preregistered Cross-Lagged Panel Models in the Netherlands
Note: Dots and triangles are point estimates, error bars are 90% confidence intervals. The left panel presents the path from lagged personality on political preference in a subsequent wave—see path T in Figure 1. The right panel presents the path from lagged political preference on personality in a subsequent wave, path H in Figure 1. The complete output of the cross-lagged models, including model fit, can be found in the Online Appendix 1.4.
Consistent with the key assumption of personality-politics research, we found lagged effects of closed personality on a number of right-wing political preferences (left panel, Figure 2). For instance, lagged closed personality scores were positively associated with right-wing immigration attitudes from waves 1–2 (β = 0.06, SE = 0.01, p < 0.001) and waves 2–3 (β = 0.07, SE = 0.01, p < 0.001). Similar patterns were found for personality effects on left-right ideological self-placement, EU attitude, and income differences attitude (waves 2–3) but not for euthanasia. The one-tailed p-values from these models were smaller than 0.05 for 5 of 10 coefficients.
In line with our key hypothesis, however, lagged levels of political preferences predicted subsequent levels of closed personality in half the tests (right panel, Figure 2). Lagged immigration attitude was significantly positively associated with later personality scores from waves 1–2 (β = 0.03, SE = 0.01, p < 0.001) and waves 2–3 (β = 0.01, SE = 0.01, one-tailed p = 0.04). Lagged EU attitudes predicted increase in closed personality from waves 1–2 (β = 0.02, se = 0.01, one-tailed p = 0.01) but not from waves 2–3 (β = 0.01, se = 0.01, one-tailed p = 0.09). Lagged euthanasia attitude had a positive effect on more closed personality, but the effects were not statistically significant from waves 1–2 (β = 0.01, SE = 0.01, one-tailed p = 0.07) or waves 2–3 (β = 0.00, SE = 0.01, one-tailed p = 0.39). Lagged ideological self-placement had a positive effect on closed personality, but this effect was only statistically significant from waves 2–3 (β = 0.02, SE = 0.01, p < 0.001) but not from waves 1–2 (β = 0.01, SE = 0.01, one-sided p = 0.08). The coefficients for the income difference models hovered around zero and were not significant.
We also conducted several robustness checks. Results were similar when we analyzed conscientiousness and openness (reverse scored) separately (SI 1.7). We also did not find consistent evidence for effects of political preferences on neuroticism, extraversion, or agreeableness (SI 1.8). Finally, the inclusion of control variables (gender, age, education, and income) did not change results (SI 1.9).
Thus, the Dutch panel results were consistent with political preferences sometimes exerting a causal influence on self-reported personality traits. However, these analyses were not preregistered and might therefore be regarded as exploratory (Nosek et al. Reference Nosek, Ebersole, DeHaven and Mellor2018; Simmons, Nelson, and Simonsohn Reference Simmons, Nelson and Simonsohn2011). We next report preregistered tests using the German GESIS panel.
Preregistered Test Using the German GESIS Panel
The GESIS panel is a probability-based mixed-mode (web/mail) panel whose sample is drawn from the German-speaking population of individuals aged 18 to 70 (at the time of recruitment) who permanently reside in Germany (Bosnjak et al. Reference Bosnjak, Dannwolf, Enderle, Schaurer, Struminskaya, Tanner and Weyandt2018). Starting in 2014, respondents completed a 15-minute survey every two months.
In the German panel, we used the two-item scales for conscientiousness and openness from the Ten Item Personality Inventory (Gosling, Rentfrow, and Swann Reference Gosling, Rentfrow and Swann2003) administered in 2015, 2017, and 2019 (see OA 2.1 for question wording). Although short personality trait measures are generally of lower quality than longer ones, this is mainly a problem for measures of neuroticism, agreeableness, and extraversion, with short measures of openness and conscientiousness often performing as well as longer measures (Bakker and Lelkes Reference Bakker and Lelkes2018). As for political preferences, we used items assessing left versus right ideological self-placement and attitude toward EU integration (with opposition regarded as the right-wing position). Question wording can be found in OA 2.1. Descriptive statistics and psychometric properties for all measures can be found in SI 2.3–2.5.
Deviations from Preregistration
We preregistered to apply GESIS’s sample weights in our analyses. However, the lavaan R-package (Rosseel Reference Rosseel2012) cannot handle sample weights in combination with the clustering of observations. Because it is necessary to cluster data at the individual level when running multilevel models with multiple observations per individual, we did not apply weights in our analyses.
We preregistered that our analyses for left-right ideological self-placement and personality would be sufficiently powered (0.8) with 2,571 respondents. Yet, the effective sample size in our model for left-right ideology and personality was 2,202. A post hoc sensitivity analysis showed that with a power of 0.8 and alpha level of 0.1, we could reliably detect an effect equal to a 0.02 increase in F-squared. The difference between the effects that we could reliably detect with our sample size and the preregistered sample is negligible (i.e., 0.002).
We also preregistered that our analyses for EU attitudes and personality would be sufficiently powered (0.8) with 3,093 respondents. Yet, the effective sample size in our model for EU attitudes and personality was 1,905. A sensitivity analysis showed that with a power of 0.8 and alpha level of 0.1, we could reliably detect an effect equal to a 0.03 increase in F-squared. The difference between the effects that we could reliably detect with our sample size and the preregistered sample size is negligible (i.e., 0.006).
Results
We present in Figure 3 the unconstrained standardized regression coefficients for the effect of left versus right self-placement, as the preregistered chi-square goodness-of-fit test indicated that the model fit of the unconstrained model was significantly better than that of the constrained model, χ2(9) = 5366.7, p < 0.001. We did not perform this test for EU attitude because this was only measured at two points. The model fit for the left versus right model was good according to two measures (CFI = 0.97; SRMR = 0.03) and “acceptable” according to one measure (RMSEA = 0.10; see OA 2.2; Byrne Reference Byrne1994; Hu and Bentler Reference Hu and Bentler1999; MacCallum, Browne, and Sugawara Reference MacCallum, Browne and Sugawara1996).
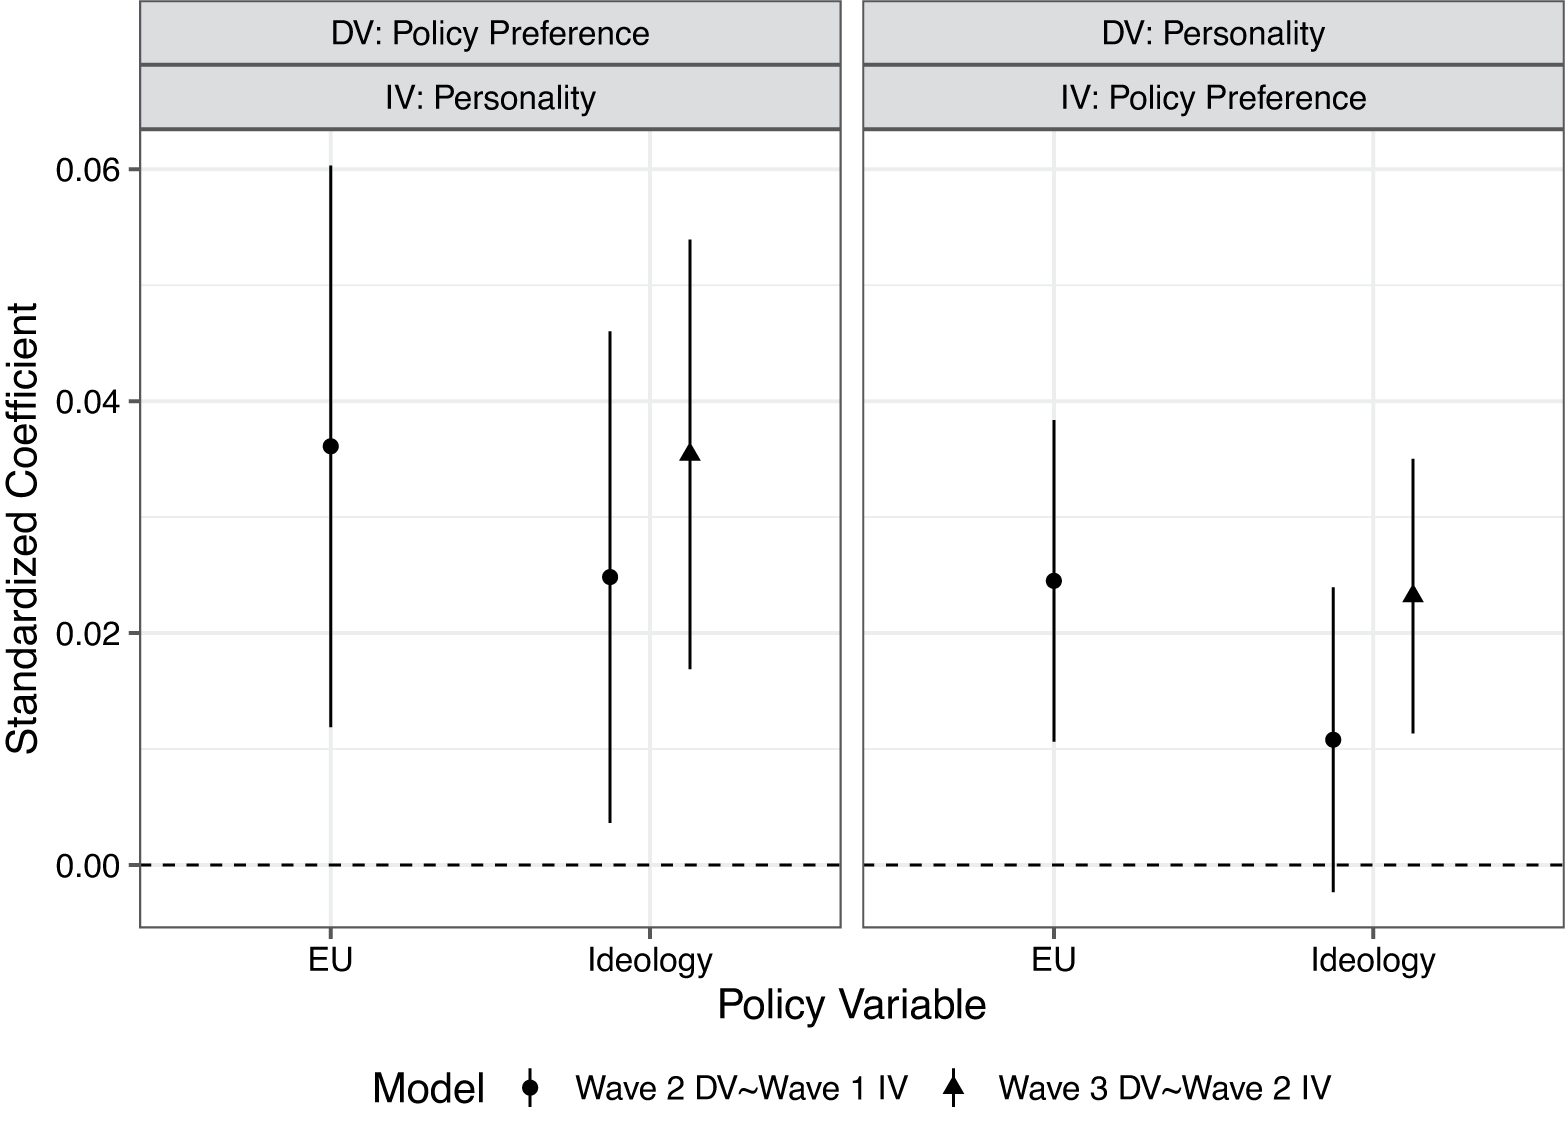
FIGURE 3. Standardized Regression Coefficients from Preregistered Cross-Lagged Panel Models in Germany
Note: Dots are point estimates, error bars are preregistered 90% confidence intervals. The left-hand panel presents the path from lagged personality on ideology in a subsequent wave—see path T in Figure 1. The right-hand panel presents the path from lagged ideology on personality in a subsequent wave, path H in Figure 1. The complete output of the cross-lagged models can be found in the Online Appendix 2.2.
Consistent with the conventional assumption in personality-politics research, we found lagged effects of closed personality on right-wing policy preferences (left panel, Figure 3). Lagged closed personality predicted more conservative ideological self-placement from waves 1–2 (β = 0.02, SE = 0.01, one-sided p = 0.02) and waves 2–3 (β = 0.04, SE = 0.01, one-sided p < 0.001), as well as more conservative EU attitudes between the two assessments (β = 0.04, SE = 0.01, one-sided p < 0.001).
Next, we tested our preregistered hypothesis that lagged levels of political preferences predict current levels of closed personality (right panel, Figure 3). Indeed they did. Lagged conservative self-placement was positively associated with a closed personality from waves 1–2 (β = 0.01, SE = 0.01, one-sided p = 0.07) and waves 2–3 (β = 0.02, SE = 0.01, one-sided p < 0.001) but only significantly so at our preregistered threshold in the latter case. Meanwhile, lagged EU attitude was significantly associated with closed personality between the assessments (β = 0.02, SE = 0.01, one-sided p < 0.001).
The results reported here do not change when we analyze conscientiousness and openness (reverse scored) separately (SI 2.8). As in the Netherlands, we find no evidence for political preferences causally influencing neuroticism and extraversion but suggestive evidence that becoming more right-wing decreases agreeableness (SI 2.9). The inclusion of control variables (gender, age, education, and income) does not change the results (SI 2.10).
In sum, the preregistered tests in Germany align with the Dutch LISS panel findings, suggesting that political preference exerts some causal influence on personality. Next, we turn to a preregistered test of our hypothesis with another trait that falls within the open versus closed domain: authoritarianism (Johnston, Lavine, and Federico Reference Johnston, Lavine and Federico2017).
Preregistered Test Using the GSS Panels in the US
We used GSS panels from the United States to test the hypothesis that political preferences exert causal influence on authoritarianism. We combined data from three of these panels—2006–2008–2010, 2008–2010–2012 and 2010–2012–2014—into one dataset. In each panel, data were collected in the spring and summer of each year. Data come from mixed-mode surveys in which respondents were either interviewed face-to-face or by phone.
Following Stenner (Reference Stenner2005), we used a two-item measure of authoritarianism in which respondents ranked values in terms of importance for child rearing. The measure was computed in each GSS wave by averaging the ranking of “obedience” and the reverse-scored ranking of “thinking for oneself.”
For political preferences, we used measures of ideological self-placement; party identification; and attitudes toward abortion, LGBT rights, and social welfare. All political preference measures were coded so that a high score indicates a more right-wing (conservative) position. The Online Appendix provides the item wording for the authoritarianism and political preference measures (OA 3.1) and the Supplementary Information on Dataverse the descriptive statistics (SI 3.2), and psychometric properties (SI 3.3) of the measures. SI 3.4 provides the correlations between the personality and political preference variables.
We ran CLPMs with authoritarianism as the indicator of a closed personality. We also added a categorical variable representing which of the three GSS panels the data came from. While the RMSEA for these models was slightly above the cutoff criteria for acceptable fit (RMSEA were roughly 0.15), CFI (>0.90) and SRMR (<0.05) indicated an acceptable fit (Byrne Reference Byrne1994; Hu and Bentler Reference Hu and Bentler1999; MacCallum, Browne, and Sugawara Reference MacCallum, Browne and Sugawara1996; see OA 3.2).Footnote 3
Deviations from Preregistration
Our preregistration plan specified that we would also include a measure of anti-immigrant attitude, but we could not do so because this variable was not included in the actual GSS datasets.
Additionally, we preregistered that our analyses would be sufficiently powered (0.8) to detect a very small effect size (increase in F-squared of 0.02) with 2,572 respondents (α = 0.1, and assuming a modestly strong correlation [r = 0.6] between the waves). However, due to missing data the effective sample sizes for models with each political preference measure—abortion (N = 781), LGBT (N = 963), conservatism (N = 1,997), partisanship (N = 2,107), and welfare (N = 2,121)—were smaller than the preregistered sample size. Post hoc sensitivity analyses (Perugini, Gallucci, and Costantini Reference Perugini, Gallucci and Costantini2018) showed that with the achieved sample size, a power of 0.8 and alpha level of 0.1, we could reliably detect very small effect sizes that range from a 0.089 increase in F-squared (abortion) to a 0.054 increase in F-squared (welfare).
Results
We present in Figure 4 the unconstrained standardized regression coefficients from the CLPMs as the preregistered chi-square goodness-of-fit test indicated that the fit of the unconstrained models was significantly better than that of the constrained models (see OA 3.3). As before, lagged levels of closed personality (authoritarianism) predicted right-wing policy preferences (left panel, Figure 4). Lagged closed personality predicted conservative abortion attitude from waves 1–2 (β = 0.08, SE = 0.02, one-sided p < 0.001) and waves 2–3 (β = 0.13, SE= 0.02, one-sided p < 0.001). Similar statistically significant patterns were found for ideological self-placement and LGBT attitudes. There were, however, no statistically significant effects of lagged authoritarianism on party identification or social welfare attitude (left panel, Figure 4).
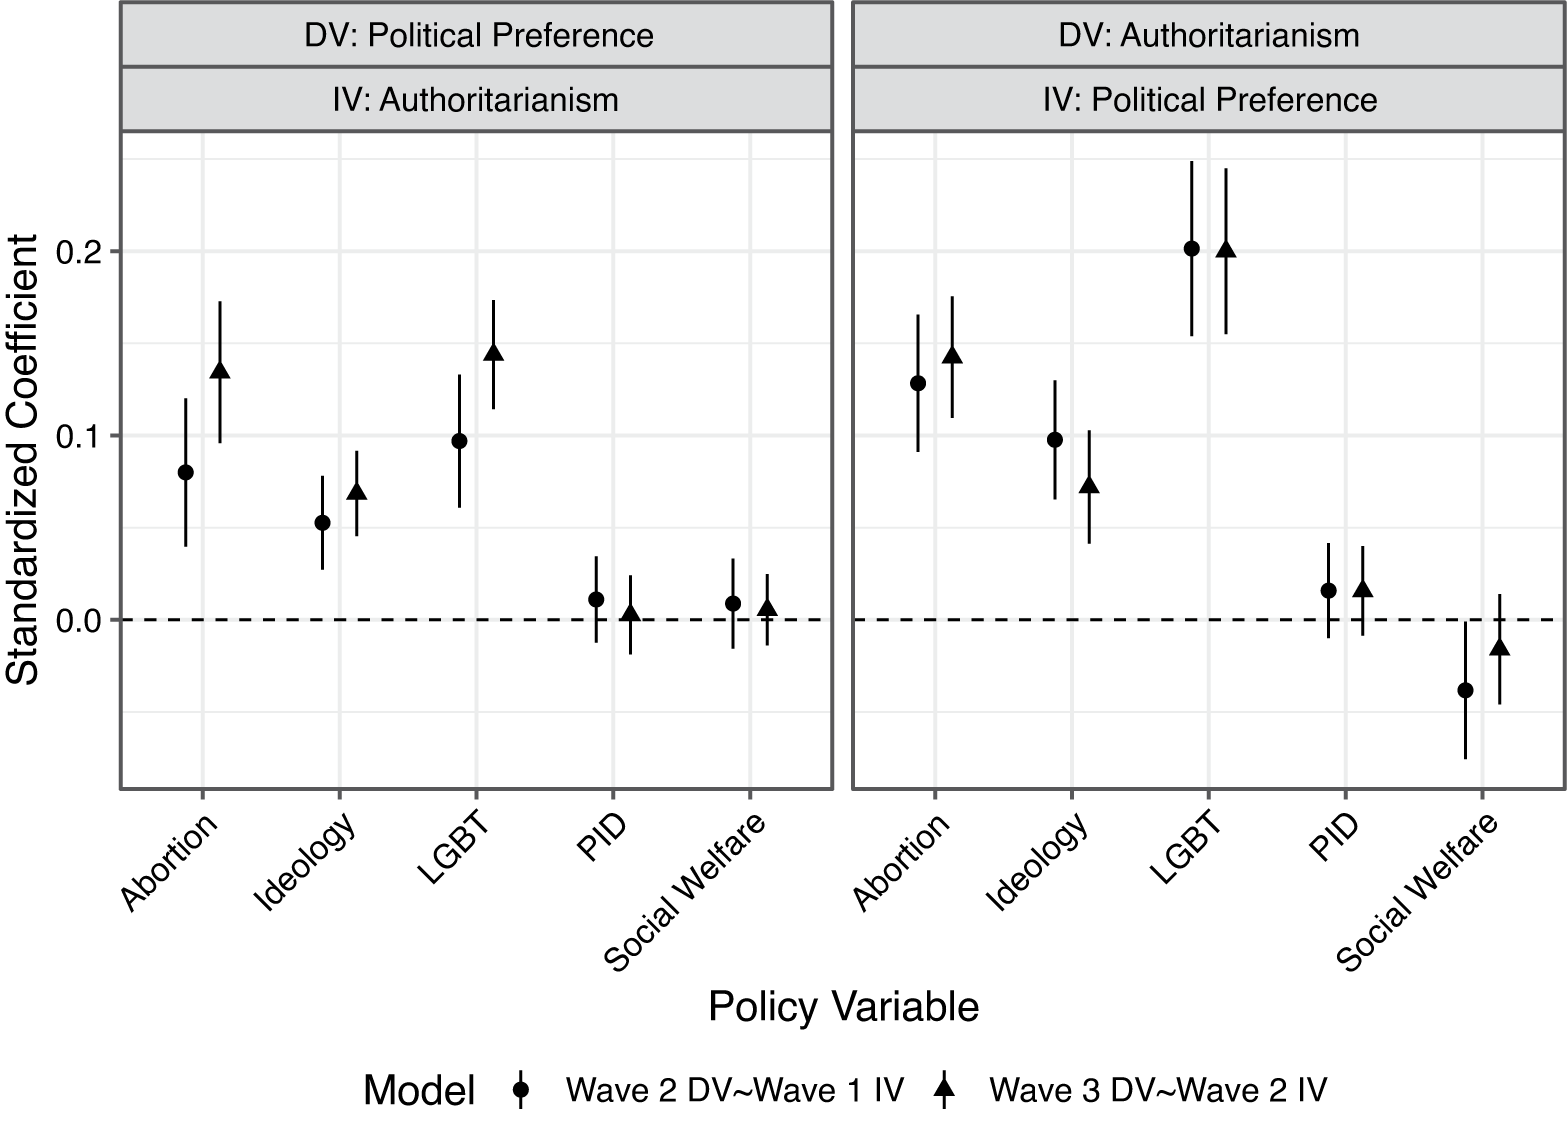
FIGURE 4. Standardized Regression Coefficients from Preregistered Cross-Lagged Panel Models in the United States
Note: Dots are point estimates, error bars are preregistered 90% confidence intervals. The left panel presents the path from lagged personality on political preference in a subsequent wave—see path T in Figure 1. The right panel presents the path from lagged political preference on personality in a subsequent wave, path H in Figure 1. The complete output of the cross-lagged models can be found in Online Appendix 3.2.
The right panel of Figure 4 presents the tests of our preregistered hypothesis that increases in right-wing political preferences are associated with subsequent increases in authoritarianism. Lagged conservative abortion attitude significantly predicted higher authoritarianism from waves 1–2 (β = 0.13, SE = 0.02, one-sided p < 0.001) and waves 2–3 (β = 0.14, SE = 0.02, one-sided p < 0.001), lagged right vs. left self-placement did so both from waves 1–2 (β = 0.10, SE = 0.02, one- sided p < 0.001) and waves 2–3 (β = 0.07, SE = 0.02, one-sided p < 0.001), and lagged LGBT rights did so from waves 1–2 (β = 0.20; SE = 0.02; one-sided p < 0.001) and waves 2–3 (β = 0.20; SE = 0.02; one-sided p < 0.001). In contrast, both lagged party identification and left-wing social welfare attitudes did not predict a more authoritarian personality in later waves. Analyzing each of the three panels separately does not change the substantive conclusions we draw based upon the preregistered pooled analyses (see SI 3.8). The inclusion of control variables (gender, age, education, and income) also does not change the results substantively (SI 3.9).
Thus, as in the German and Dutch panels, evidence was consistent with some causal influence of political preferences on personality traits.
EXPERIMENTAL EVIDENCE
The results from the three cross-lagged panel data sets were consistent with political preferences exerting some causal influence on self-reported personality traits. However, analyses of this sort are limited in their capacity to ascertain causality (Rogosa Reference Rogosa1980; Vaisey and Miles Reference Vaisey and Miles2017). Therefore, we supplemented our panel tests with a pair of preregistered experiments (Big Five: https://osf.io/kqexp/; Authoritarianism: https://osf.io/7bgrm/). Each experiment consisted of an initial wave in which political preferences were assessed and a second wave (at least one week later) in which respondents were randomly assigned to be primed with politics or a nonpolitical domain (placebo control condition) before completing measures of personality—the Big Five personality traits in the first experiment (Soto and John Reference Soto and John2017) and authoritarianism in the second (Feldman and Stenner Reference Feldman and Stenner1997). We hypothesized that making political preferences salient would cause people to report levels of personality traits that were more aligned with their previously assessed political preferences. Table 2 provides an overview of the two experiments. The experiments adhere to APSA’s Principles and Guidance for Human Subject Research, see OA 7.2.
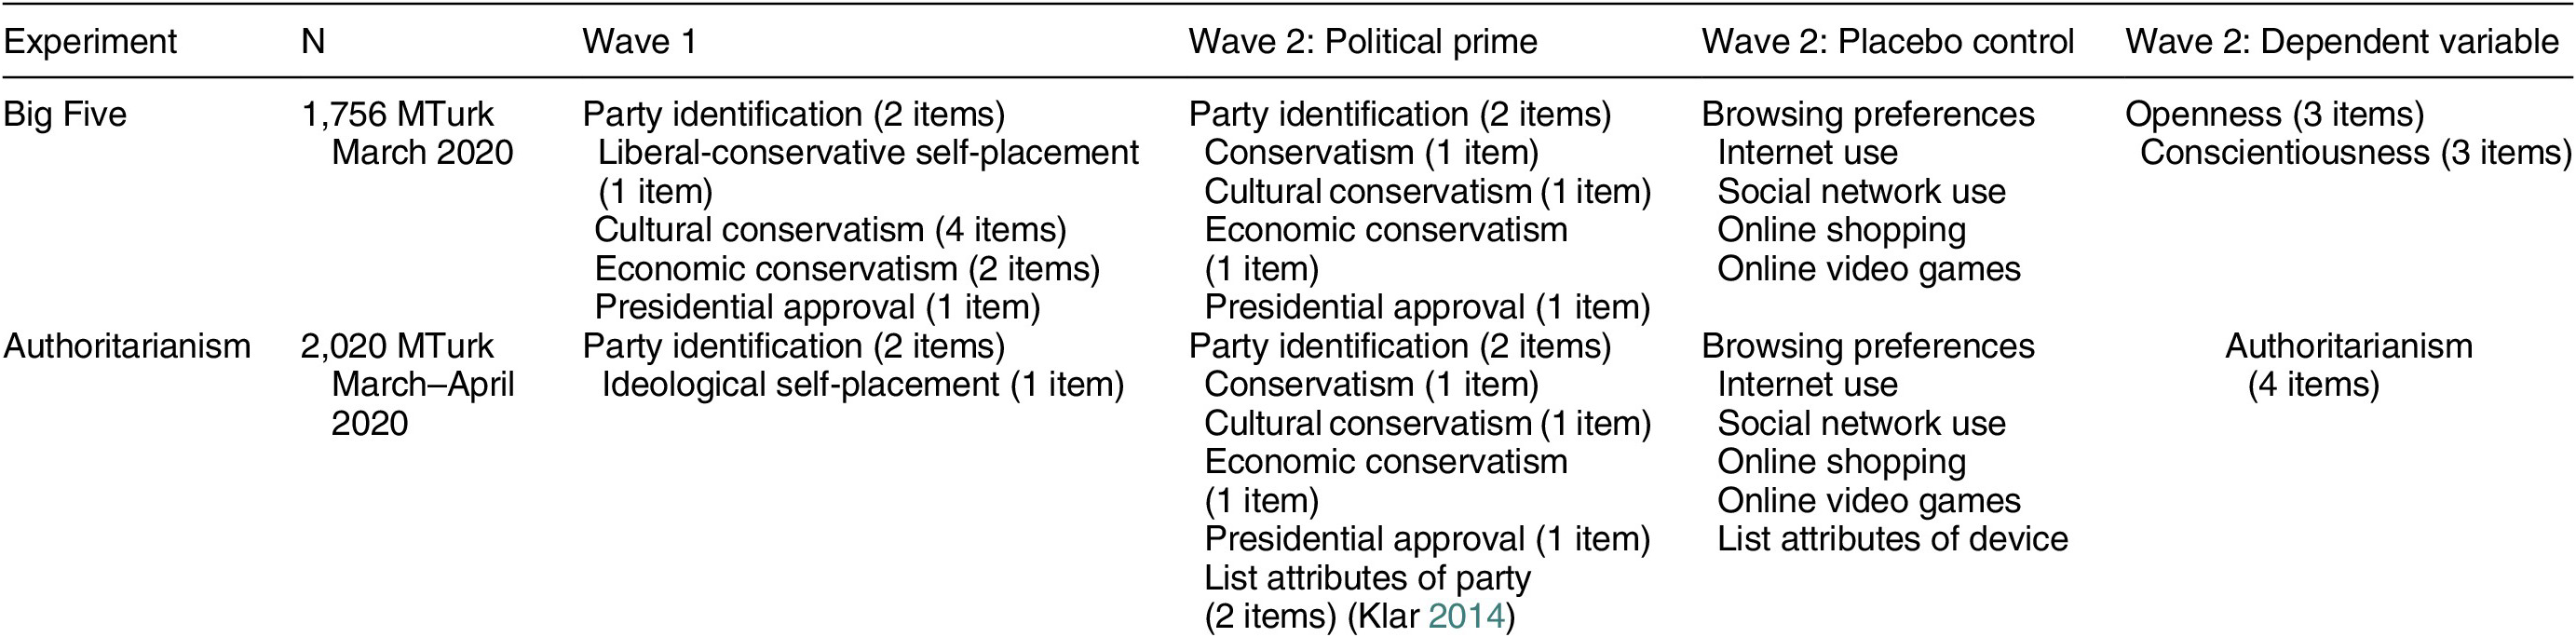
TABLE 2. Overview of the Design Characteristics of the Big Five Experiment and the Authoritarianism Experiment
Data
We used Cloud Research’s platform for Mechanical Turk (MTurk) to recruit participants. We ensured that the workers had a high approval rating (95% or greater), that multiple workers were not coming from the same IP address, and that IP addresses that CloudResearch has identified as problematic were blocked. MTurk has performed well as a platform for recruiting research participants for survey-based experiments (Mullinix et al. Reference Mullinix, Leeper, Druckman and Freese2015) with heterogeneous treatment effects (Coppock, Leeper, and Mullinix Reference Coppock, Leeper and Mullinix2018) and for studies of personality and political preferences (Clifford, Jewell, and Waggoner Reference Clifford, Jewell and Waggoner2015).
In the Big Five experiment, the wave 1 survey was fielded on March 20 and 21, 2020, with a total of 2,193 respondents completing the survey. In wave 1, respondents were told that they would be reinvited to participate in a second wave conditional upon the quality of their responses. We fielded wave 2 of the survey roughly one week later, between March 29 and April 1, with 1,756 (80%) of the original respondents. This sample size was in line with our preregistered power analysis.
For the first wave of the Authoritarianism experiment, eligible participants either participated in the first wave of the Big Five experiment (N = 2,055) or a different study conducted by one of the present authors (N = 3,078) on March 9, 2020. We relied on the same power analysis as in the Big Five experiment and attempted to collect 2,000 responses from May 14 to May 20, 2020. We invited all wave 1 respondents and closed recruitment once we crossed the threshold. Since multiple respondents completed the survey simultaneously, our final N was 2,020.Footnote 4
Measures and Procedure
In wave 1 for the Big Five Experiment, respondents completed political preference measures: party identification, liberal-conservative self-placement, cultural conservatism, economic conservatism, and presidential approval (see OA 5.1 for item wording and OA 5.2 for coding). We created a general right versus left ideology composite to test our preregistered hypotheses, consisting of the measures of partisanship, presidential approval, liberal-conservative self-placement, and social and economic policy preferences. We scaled this variable to range from 0 to 1, with higher scores meaning a more conservative position. The cultural conservatism scale was created by averaging the four cultural conservatism items from wave 1 and recoding to range from 0 to 1 with higher scores meaning more conservative. In the same way, we computed an economic conservatism variable using the two economic attitude items and a symbolic political preference variable using party identification, presidential approval, and liberal-conservative self-placement.
In wave 1 of the Authoritarianism experiment, respondents completed measures of party identification and ideological self-placement, which were also combined into a symbolic political preference measure that ranged from 0 to 1 and with higher scores meaning more conservative (see OA 6.1 for item wording and coding). In the Supplementary Information file on the APSR Dataverse, we present descriptive statistics and psychometric properties of the ideology dimensions in the Big Five experiment (SI 5.3 and 5.4) and Authoritarianism experiment (SI 6.3).
In wave 2 of each experiment, respondents were randomly assigned to the political prime or placebo control prime condition. In the political prime condition, respondents were told that the survey was about politics and were then administered political preference questions: partisanship, ideological self-placement, cultural conservatism, economic conservatism, presidential approval, and, in the authoritarianism experiment, an open-ended question about what they like about their own party and dislike about the other party (Klar Reference Klar2014). In the placebo control condition, respondents were told that the survey was about internet browsing preferences and were then administered questions about their internet browsing preferences: preference for browsing the internet on different kinds of devices and the strength of this preference, hours per day spent on the internet, hours per day spent on social media, frequency of online shopping and online gaming, and, in the authoritarianism experiment, an open-ended question about what they like about their preferred internet browsing device and what they dislike about other ones. In each experiment, the number and format of manipulation items were equivalent across both conditions (See the Online Appendix for exact item wording in Big Five experiment (OA 5.1) and Authoritarianism experiment (OA 6.1). We provide randomization checks for the Big Five and Authoritarianism experiments in the Supplementary Information (SI 5.5, SI 6.6) and outcome neutral quality checks for the Big Five Experiment in the Supplementary Information (SI 5.6).
Immediately following the manipulation in the Big Five experiment, respondents completed the 15-item BFI-2-XS, a valid and reliable short Big Five inventory with three items per trait (Soto and John Reference Soto and John2017). Item wording can be found on the Online Appendix (OA 5.1), while descriptive statistics (SI 5.3), and psychometric properties (SI 5.4) are provided in the Supplementary Information at the Dataverse. Immediately following the manipulation in the authoritarianism experiment, respondents completed a four-item authoritarianism measure with each item presenting a pair of traits and asking respondents to consider which of these they believed was more important to instill in children (Feldman and Stenner Reference Feldman and Stenner1997). Based on recent evidence (Bakker et al. Reference Bakker, Schumacher, Gothreau and Arceneaux2020), we instructed respondents to rate preference for one or the other trait on a five-point bipolar scale instead of having them make dichotomous choices. Items were scaled so that a high score meant the more authoritarian option and averaged. See OA 6.2 for the item wording.
Analytical Strategy
In the Big Five experiment, we treated openness (reverse-scored) and conscientiousness as two measures of a “closed-personality” in a multilevel model with a random intercept for each person to account for the nested structure of the data. This approach, which was preregistered, maximizes power and simplifies the presentation of results. In essence, it treats openness and conscientiousness as a repeated measure of a “closed-personality.” In both experiments, our primary analysis regressed closed-personality traits (measured in wave 2) on wave 1 political preferences (high = conservative); a dummy variable capturing whether participants were in the politics prime (1) or placebo control (0) condition; the interaction between political preference and the treatment dummy; and the covariates gender, age, education, race, and a dummy variable indicating whether the personality variable for that observation measured openness or conscientiousness.
If the correlation between political preferences measured in wave 1 and personality measured in wave 2 is stronger in the politics salient condition than the placebo control condition, this would indicate that people altered their self-reported personality to match their political preferences when primed with politics. Therefore, the interaction effect is the parameter of interest. As we proposed a directional prediction of a positive interaction effect, we preregistered one-sided hypothesis tests with a p-value of 0.05.
Deviations from the Preregistration
We deviated from the preregistration in a few ways in the Big Five experiment. First of all, due to budget constraints, we omitted the “terrorism” and “deporting undocumented immigrants” items belonging to the cultural conservatism scale and the “spending on health and education” items belonging to the economic conservatism scale. Second, we preregistered that we would only invite those who passed an attention check to complete the second wave survey. In the Big Five Experiment, we inadvertently invited those who did and did not pass the attention check. Thus, our sample consists of people who passed (N = 1,543; 88%) and those who did not (N = 213; 12%) pass the attention check. Following our preanalysis plan, we present the results including only those respondents who passed the attention check. Rerunning the models including those who failed the attention check did not substantially change the findings (see SI 5.11).
In the Authoritarianism experiment there were no deviations from the preregistration.
Results
We start with the results from the Big Five experiment. The average marginal effects of wave 1 global right-wing (conservative) political preferences on wave 2 personality in the politics prime and the placebo-control (internet) condition appear in the top-left panel of Figure 5. Consistent with prior findings, there is a positive association between conservative policy preferences and a “closed” personality. The effect of political preferences on personality is stronger in the politics condition than in the internet condition, although the interaction effect was not statistically significant at our preregistered threshold (β = 0.04, SE = 0.03, one-sided p = 0.08, see top left panel of Figure 5).

FIGURE 5. Average Marginal Effect of Wave 1 Political Preferences on Wave 2 Personality in the Politics and Internet Conditions
Note: Dots are point estimates, error bars are 90% confidence intervals. Full regression output is provided in Online Appendix 5.3.
Next we tested the political preference subscales, starting with symbolic ideology (see top-right column of Figure 5). Here, we find that the association between ideology and personality was significantly stronger in the political prime condition than the placebo control condition (β = 0.04, SE = 0.02, one-sided p = 0.03). Decomposing symbolic ideology into party identity (row 2, left-hand panel, of Figure 5; β = 0.04, SE = 0.02, one-sided p = 0.03), ideology (row 2, right-hand panel, of Figure 5; β = 0.04, SE = 0.02, one-sided p = 0.04) and Trump approval (row 3, left-hand panel, of Figure 5; β = 0.03, SE = 0.02, one-sided p = 0.04) we find comparable evidence across the three components.
Our preregistered test for cultural ideology shows no statistically significant difference in the strength of the association between cultural conservatism and personality across the conditions (β = 0.02, SE = 0.03, one-sided p = 0.27)—see the right-hand panel on the third row of Figure 5. Turning to our preregistered test for economic conservatism, we find that the association between this and personality is stronger in the political prime condition than the placebo control condition. However, the interaction was not statistically significant at our preregistered threshold (β = 0.04, SE = 0.03, one-sided p = 0.08, see bottom row of Figure 5).
We conducted two additional tests that were not preregistered. First, we tested whether the prime’s effect was nonlinear (Hainmueller, Mummolo, and Xu Reference Hainmueller, Mummolo and Xu2019). As reported in the Supplementary Information file (see Dataverse), the prime had symmetric effects on each key variable’s upper and lower tertiles (see SI 5.8). Second, we analyzed openness and conscientiousness separately and found that the interaction effects were in the expected direction for both, but that effect sizes and p-values differed across the tests (see SI 5.9). We did preregister to also explore the effects of the politics prime on the other Big Five traits. We did not find much evidence that priming politics causes stronger links between previously assessed political preferences and levels of neuroticism or extraversion (see SI 5.10). But, consistent with evidence from the CLPM-models using the German panel, we find that priming politics makes right-wing people report lower levels of agreeableness.
Turning to the authoritarianism experiment, we found that the association between the pretreatment right-wing political preference measures and authoritarianism were stronger in the political prime condition than in the placebo control condition (Figure 6). However, this difference was only statistically significant at our preregistered threshold for ideological self-placement (β = 0.06, SE = 0.03, one-sided p = 0.02).
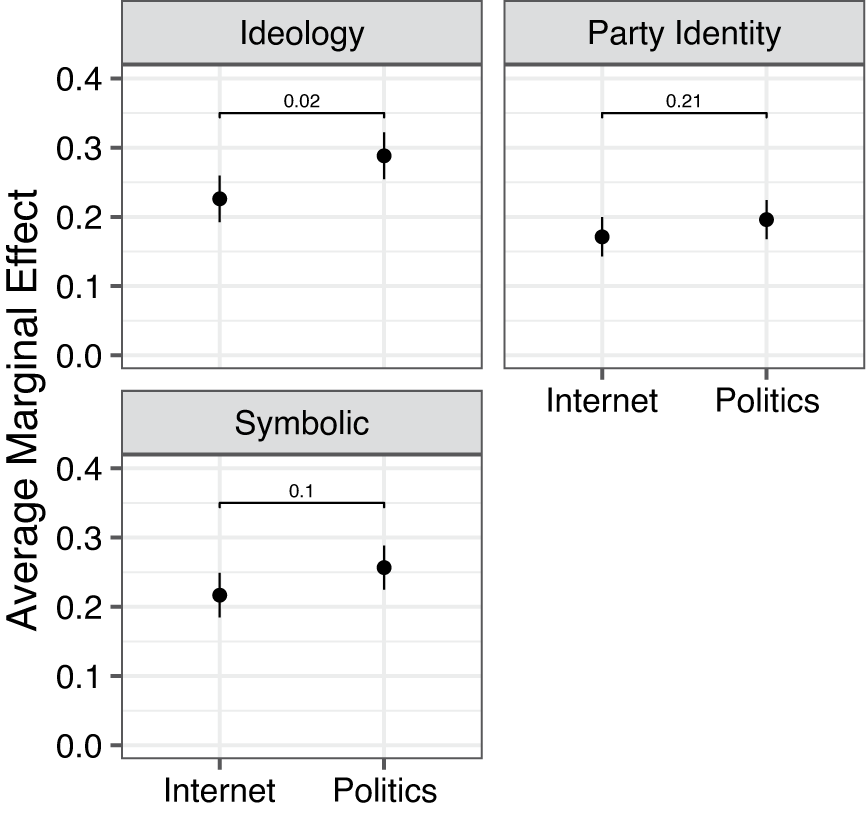
FIGURE 6. Average Marginal Effect of Wave 1 Political Preferences on Wave 2 Authoritarianism in the Politics and Internet Conditions
Note: Dots are point estimates, error bars are 90% confidence intervals. Full regression output is provided in the Online Appendix 6.3.
In exploratory analyses, we found—unlike in the Big Five experiment—the pattern is nonlinear. Figure 6 plots the average marginal effect of the political prime by levels of ideological self-placement (upper panel of Figure 7), party identity (middle panel of Figure 7), and symbolic political preference composite score (bottom panel of Figure 7).Footnote 5 Across tests, we see that the politics prime induced liberals and Democrats to report less authoritarian attitudes (Ideology: AME = −0.03, SE = 0.02, one-sided p = 0.002; Party Identity: AME = −0.03, SE = 0.01, one-sided p = 0.01; Symbolic Identity: AME = -0.02, SE = 0.01,one-sided p = 0.05). However, the prime did not affect conservatives/Republicans or, except for symbolic political preference, moderates.
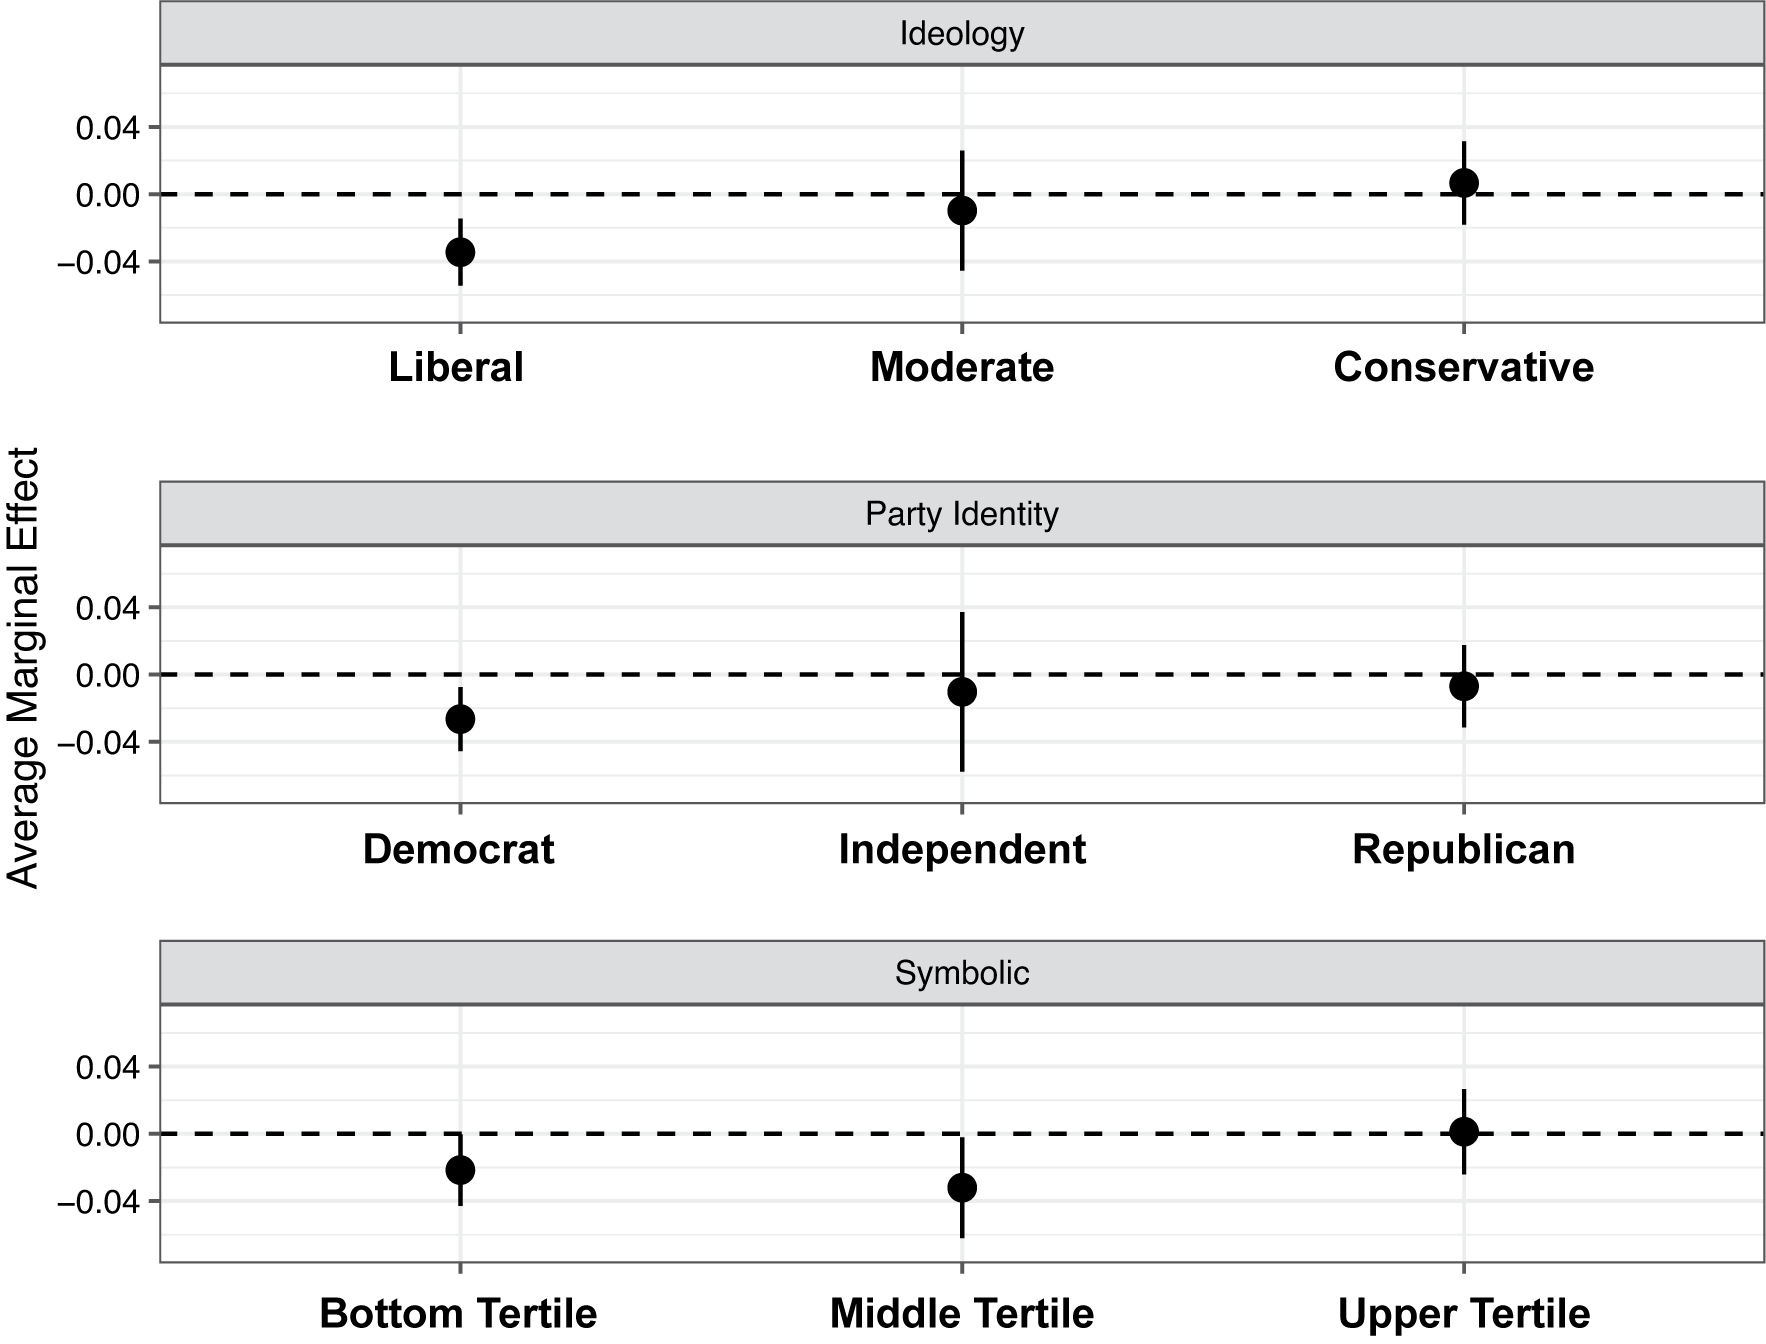
FIGURE 7. Effect of Politics versus Internet within Categories of Attitude Variables
Note: Dots are point estimates, error bars are 90% confidence intervals. Full regression output is provided in the Online Appendix 6.3.
Individual Data Meta-Analysis of the Experiments
Finally, we conducted an individual data meta-analysis, which we did not preregister, pooling data from the two experiments to improve statistical power. We ran a multilevel model in which closed personality was regressed on political preference indicators, treatment, and the interactions between the two. We clustered standard errors at the individual level and included fixed effects for the ideological dimensions and the study (Big Five or Authoritarianism). The results show that the association between ideology and personality was significantly stronger in the political prime condition than the placebo control condition (β = 0.03, SE = 0.02, one-sided p = 0.02). Full regression output can be found in OA 8.
CONCLUSION
A great deal of research has addressed relationships between personality traits and political preferences (for an overview, see Federico and Malka Reference Federico and Malka2018). Almost all of this work has involved cross-sectional data with self-report measures of personality taken in the context of a political survey. Though this work varies a great deal in terms of the personality attributes assessed and the theoretical frameworks guiding hypothesis tests, a key conclusion of much of this work is that political differences between the right and the left are caused, to an important degree, by a family of personality differences related to an open versus closed orientation to behavior and experience. This, in turn, suggests that political polarization is difficult to mitigate through mutual understanding and compromise (Hibbing, Smith, and Alford Reference Hibbing, Smith and Alford2014).
We theorized that the commonly observed cross-sectional relationships between personality traits and political preferences, in part, reflect the causal influence of political preferences on self-reports of personality. This may arise from people on the left and right adopting the behavioral and experiential patterns of politically similar others. It may also result from such people being motivated to view themselves as holding personality traits that are considered consistent with their political outlook, especially when politics is salient. Either way, the implications of this possibility are considerable. For one thing, this would mean that models depicting the one-way causal influence of personality traits on political preferences from cross-sectional data will be likely to overestimate this causal influence. For another, this would mean that political polarization may be exacerbated through a process whereby citizens are motivated to experience the world and act in ways that are characteristic of their political outlook, or at least perceive themselves to be doing so.
We examined this possibility using three large and long-spanning panel studies from three different countries (two of which were preregistered) and two survey experiments employing a novel two-wave design (both preregistered). In each study, we found some evidence consistent with political preferences exerting causal influence on self-reported personality traits. Lagged effects of political preference on self-reported personality traits were observed in all three-panel studies, and making politics salient through the survey context resulted in self-reports of personality traits that were in some cases more aligned with preexisting political preferences.
We must be clear that any causal claims derived from longitudinal survey data are on shaky ground. The traditional CLPM is more susceptible to omitted variable bias than RI-CLPM and other dynamic fixed-effects models, which control for time-invariant confounders. However, RI-CLPM and analogs are only appropriate if the lag structure is correctly specified (Vaisey and Miles Reference Vaisey and Miles2017). Most social science surveys, which include only a few waves and are generally spaced years apart, are likely inappropriate for RI-CLPM.
Whereas the CLPM results suggest small mutual causal influences between personality traits and political preferences, the results from the RI-CLPM models in the Netherlands (see OA 1.4), Germany (see OA 2.3), and the US (see OA 3.4) suggest no causal influence in either direction. Again, we are skeptical of the latter results because of the high likelihood of a contemporaneous relationship between politics and personality (see Online Appendix 4 for a discussion) and the estimates’ resulting downward bias. However, if the results from the RI-CLPM models are correct, this would be consistent with claims that a latent genetic factor that is itself distinct from both personality traits and political preferences drives variation on both (Hatemi and Verhulst Reference Hatemi and Verhulst2015; Verhulst, Eaves, and Hatemi Reference Verhulst, Eaves and Hatemi2012).
If, on the other hand, our conclusion about the causal influence of political preferences on self-reported personality traits is correct, it is essential to note that our evidence suggests that this effect is relatively small. This is consistent with the generally small effects observed in political science (Claassen Reference Claassen2020; Kalla and Broockman Reference Kalla and Broockman2020; Shepherd and You Reference Shepherd and You2020) and social science research more generally (Camerer et al. Reference Camerer, Dreber, Holzmeister, Ho, Huber, Johannesson and Kirchler2018).
Overall, the small effect sizes reported in this paper should be evaluated in the context of two considerations. First, even a small amount of endogeneity could severely bias the estimates of the effects of personality on political preference in the types of models routinely tested in this area. Consider a standard model regressing EU attitude on a closed personality trait. Using wave-3 EU attitudes and wave-2 personality from the Dutch LISS data would give a standardized regression coefficient of 0.05 (SE = 0.01, p < 0.001). This relationship’s estimates from the cross-lagged model were half the size (β = 0.02, SE = 0.12, p = 0.09). Second, this study involved large sample sizes sufficiently powered to detect the effect sizes of interest and, in all but one case, preregistered analysis plans. It is well known that these attributes of studies are associated with finding smaller effect sizes (Camerer et al. Reference Camerer, Dreber, Holzmeister, Ho, Huber, Johannesson and Kirchler2018; Schäfer and Schwarz Reference Schäfer and Schwarz2019) because, for instance, selective reporting of statistically significant findings from small-N studies leads to an overestimation of effect sizes (Simmons, Nelson, and Simonsohn Reference Simmons, Nelson and Simonsohn2011).
To be sure, several of the present experimental findings were not statistically significant at the preregistered threshold for statistical significance. The experiments were sufficiently powered, and the treatments were based upon work by others (Klar Reference Klar2014; Lavine, Johnston, and Steenbergen Reference Lavine, Johnston and Steenbergen2012). That being said, the primes were quite subtle. Indeed, making politics salient simply involved stating that the experiment was about politics and administering political preference questions—what amounts to “business as usual” in this line of work. While the results indicate that administering personality measures in the context of a political survey might overestimate influences of personality on political preference, the subtlety of the prime might understate the extent to which political salience can lead political opponents to diverge in terms of personality or self-perceptions thereof. In addition to this, it is important to keep in mind that the null findings for partisanship in the authoritarianism experiment align with the finding that authoritarianism is not causing partisanship in the GSS study and with recent work that questions the direct link between authoritarianism and partisanship (Wronski et al. Reference Wronski, Bankert, Amira, Johnson and Levitan2018).
One potential explanation of the present findings is that the context of a political survey can bias self-reports of personality traits away from people’s actual levels of the traits (Ludeke, Tagar, and DeYoung Reference Ludeke, Tagar and DeYoung2016). This would have considerable methodological implications for survey research on personality and political attitudes. However, as important as this methodological issue is, the implications of such a conclusion would extend beyond survey measurement. Specifically, self-perceptions are psychologically important: Being motivated to view oneself in a particular way as a result of one’s context and surroundings can influence one’s behavior and judgments in a way that has real social consequences. Imagine a person who identifies as politically conservative. Spurred by the political context, they might view themself as more conventional and averse to novel experiences than they actually are. Suppose this motivated self-perception is tied to their sense of self as a political conservative. In that case, they might see the divide against liberals as reflecting a deep-seated personality attribute, surround themself with others who see themselves as closed to new experiences, and perhaps select themself into contexts that actually promote this trait. A significant threat associated with (American) polarization is that it leads people to construe various political and nonpolitical differences in terms of an overarching dimension of societal conflict (McCoy, Rahman, and Somer Reference McCoy, Rahman and Somer2018). If personality trait perceptions, like perceptions of religiosity (Margolis Reference Margolis2018) and even demographic attributes (Egan Reference Egan2020), are influenced by political leaning, this would likely aggravate the tendency of partisans to view the opposition as threatening to one’s way of life.
One might wonder whether our conclusions are limited to the countries we studied or the specific samples we use. However, the personality-politics link is relatively consistent across Western countries and samples (Clifford, Jewell, and Waggoner Reference Clifford, Jewell and Waggoner2015; Malka et al. Reference Malka, Soto, Inzlicht and Lelkes2014; Sibley, Osborne, and Duckitt Reference Sibley, Osborne and Duckitt2012), and the patterns we report here are similar to those identified in the literature. Nevertheless, we will only know if the present results generalize beyond these samples and contexts if others attempt replication, as we hope they will.
It is also important to acknowledge that we used relatively brief personality scales involving two (GESIS panel and GSS panel) or three (Big Five experiment) items per trait in some of our studies. This is typical of personality assessment in survey research, which often employs short personality measures for cost reasons. However, Bakker and Lelkes (Reference Bakker and Lelkes2018) showed that highly abbreviated personality measures often lead to underestimating the association between personality and political measures. Therefore, our estimates could be considered conservative estimates of the effects of political preferences on personality and vice versa. That said, longer personality trait measures would be desirable in future work. Future work could also disentangle whether political preferences more strongly influence some of the lower subdomains of personality (such as facets and aspects) compared with others (Xu, Soto, and Plaks Reference Xu, Soto and Plaks2020).
In addition, we did not preregister expectations about the extent to which some policy preferences would have stronger effects on personality compared with others. There is considerable heterogeneity in this association across different political domains in the personality and policy preferences literature. In particular, the association between personality and right versus left ideological self-placement (Sibley, Osborne, and Duckitt Reference Sibley, Osborne and Duckitt2012) and the association between personality and stances on cultural issues are better established than those involving economic issues (Bakker Reference Bakker2017; Johnston, Lavine, and Federico Reference Johnston, Lavine and Federico2017; Malka et al. Reference Malka, Soto, Inzlicht and Lelkes2014). Across our studies, we find suggestive evidence that economic issues such as welfare spending (GSS panel in the US) and reducing income differences (LISS panel in NL) have a weaker—and often not statistically significant—effect on personality compared with right versus left ideological self-placement and cultural issues. However, these results were not predicted in advance. Independent preregistered replications will have to confirm whether it is indeed the case that some political preferences have a stronger effect on personality compared with others.
Next, it is important to consider that the effects of political preferences on personality could be conditional on other individual characteristics. One might wonder whether the effects of political preferences on personality are stronger for who are older (Aidt and Rauh Reference Aidt and Rauh2018) or those with higher levels of political sophistication (Johnston, Lavine, and Federico Reference Johnston, Lavine and Federico2017; Malka et al. Reference Malka, Soto, Inzlicht and Lelkes2014). We find no evidence that the effects in our studies are conditional on age (SI 9.1) or on education—as a proxy for sophistication—(SI 9.2). These tests were, however, not preregistered and lacked statistical power. It would be a logical next step in this research agenda to rigorously test preregistered predictions about heterogeneity in effects across subgroups using adequately powered studies.
Finally, this research did not address how context might condition the effect of politics on personality. Fatke (Reference Fatke2017, 896) for instance, suggests that “people do not only calibrate their political attitudes in accordance with their personality traits, but they also adjust their traits to their core attitudes to adapt adequately to the demands of their current or anticipated social environment.” Unfortunately, the present panel data do not allow us to isolate the effects of potential contextual moderators. In addition to varying in the country, the three panels we use also vary substantially in terms of the measurement of personality and political preferences, duration, sampling schemes, and mode. It is advantageous to test hypotheses with multiple datasets that vary in methods. However, a drawback is that with this small sample size of three-panel datasets and the presence of many methodological differences among them, it is impossible to discern in any systematic way whether variation in effect sizes are attributable to country or one of the many other sources of variability in the panels. Future work might attempt to delineate which types of contexts would render it adaptive to adjust personality traits to match one’s political orientation. Perhaps, for example, relatively polarized contexts characterized by highly salient stereotypes of political groups do this.
While associations between personality traits and political preferences have been assumed to reflect the former’s causal influence on the latter exclusively, the present findings suggest that reciprocal causal influence is a distinct possibility. Methodologically, researchers should be attuned to the possibilities that (a) models assuming unidirectional causal influence from personality to political preferences might overestimate the magnitude of this effect and (b) political salience in the survey context might produce overestimates of the association between personality and political preferences. From a normative standpoint, this adds a concerning wrinkle to the standard story on political polarization. Specifically, political polarization may be exacerbated by people on different sides of the ideological spectrum adopting—or perceiving themselves as possessing—different personality traits. Rather than merely reflecting nonpolitical psychological differences, opposite political loyalties might motivate people to enhance such differences.
Supplementary Materials
To view supplementary material for this article, please visit http://dx.doi.org/10.1017/S0003055421000605.
Data Availability Statement
The data that support the findings of this study are openly available at the American Political Science Review Dataverse: https://doi.org/10.7910/DVN/WZI945 for the GSS panel study and the experiments. The Dutch LISS panel and the German GESIS panel cannot be shared in the American Political Science Review Dataverse due to user agreements. At the American Political Science Review Dataverse, we posted a document, “Data Access,” and we explain how to access these datasets. The code to reproduce all results reported here, in the Online Appendix, and in the Supplementary Information on the Dataverse can be found at the American Political Science Review Dataverse: https://doi.org/10.7910/DVN/WZI945. The research materials—item wording and materials—can be found in the Online Appendix placed online.
Acknowledgments
We thank the APSR editors and anonymous reviewers, as well as Vin Arceneaux, Mark Brandt, Matthijs Rooduijn, and Gijs Schumacher for comments on earlier versions of this paper. An earlier version of this paper was presented at the SPSP political psychology preconference, the Hot Politics Lab at the University of Amsterdam, and the Political Psychology Research Group at Stanford University. This research was supported by the Amsterdam School of Communication Research, University of Amsterdam, and the Annenberg School for Communication, University of Pennsylvania.
Funding Statement
This research was funded by Annenberg School for Communication (Y.L.) and Amsterdam School of Communication Research (B.N.B.).
Conflict of Interest
The authors declare no ethical issues or conflicts of interest in this research.
Ethical Standards
The panel studies in the Netherlands (LISS panel), Germany (GESIS panel), and US (GSS panel) were not collected by the authors, but the panels adhere to APSA’s Principles and Guidance for Human Subject Research (see Appendix 7.1). The authors declare that the human subjects research in the Big Five experiment and Authoritarianism experiment was deemed exempt from review by the University of Pennsylvania (see Appendix 7.1 and the APSR Dataverse).


 Open access
Comments
No Comments have been published for this article.