

In the last three decades, changes in eating habits among children and adolescents have led to increased consumption of processed foods by these age groups( Reference Nielsen, Siega-Riz and Popkin 1 – Reference Monteiro, Cannon and Levy 3 ). Brazilian data from 2008 from the Brazilian Diet and Nutrition Surveillance System revealed that 45 % of children consumed cream-filled cookies, 27 % consumed soft drinks and 54 % consumed salty crackers or packaged salty snacks (such as corn-based snacks) on at least three days per week. Among adolescents, this percentage was 42 %, 30 % and 48 %, respectively( 4 ).
According to He and MacGregor, processed products are responsible for 80 % of the Na consumed by the populations of high-income countries( Reference He and MacGregor 5 ). The main foods contributing to high Na intake in Brazil and worldwide are pizza, processed meats, processed salty snacks, cream-filled cookies and soft drinks( 6 – 10 ). It is worth noting that these foods are also consumed by children and adolescents( Reference Colucci, Philippi and Slater 11 – Reference Conceição, Santos and Silva 13 ). High Na intake beginning in childhood is associated with a consequent increase in blood pressure and can lead to elevated blood pressure into adulthood( Reference He and MacGregor 5 , Reference He and MacGregor 14 , Reference Tavares, Fonseca and Garcia Rosa 15 ). The main implications of high blood pressure include cardiovascular and kidney diseases, stomach cancer and obesity( Reference He and MacGregor 14 , Reference Tavares, Fonseca and Garcia Rosa 15 ).
Nutrition labelling (e.g. nutrition information panels) is the main vehicle used to inform consumers of the amount of Na and other nutrients present in foods( 16 ). There are two main regulations in Brazil and Mercosur that establish the items that must be reported on nutrition information panels (such as Na), the reference serving size for each food type and its respective household measurement( 17 , 18 ).
Nutrition labelling can guide consumers to make healthier choices. In this perspective the reduction of Na consumption can be included( Reference Malik, Willett and Hu 19 ). To this end, Traffic Light Labelling has existed in the UK since 2004. Although it is not mandatory, it is the most widely discussed tool in the scientific literature that aims to alert consumers about the content of various nutrients present in processed foods, including Na. Thus, the Na content is classified in grams of salt and it is shown on the front of food packages as high, medium or low( 20 ).
Nevertheless, there are few studies that have analysed the Na content of processed foods consumed by children and adolescents( Reference Nielsen, Siega-Riz and Popkin 1 , Reference Monteiro, Cannon and Levy 3 , Reference Elliott 7 – Reference Elliott and Conlon 9 ), despite the high processed food consumption among this population, which leads to high Na intake. We also observed a lack of studies in the literature about Na levels in Brazilian processed foods( Reference Álvares, Araújo and Borgo 21 – Reference Rodrigues, Silva and Ferreira 23 ), especially those targeted at children and adolescents( Reference Lobanco, Vedovato and Cano 24 , Reference Fiates, Muller and Machado 25 ). Therefore, the present study assessed the Na levels and serving sizes reported on the labels of processed foods sold in Brazil that are usually consumed as snacks by children and adolescents.
Method
Data collection
The present study was a cross-sectional survey that assessed the Na content and reported serving sizes of all processed snack foods consumed by children and adolescents that were available for sale at a large Brazilian supermarket. This supermarket was chosen intentionally and belongs to one of the ten largest supermarket chains in Brazil( 26 ), with twenty-six stores in the southern region of Brazil, six of which are located in the city of Florianópolis. The products sold in this store are similar to those sold in other large supermarket chains throughout the country. The supermarket manager authorized the research.
Census-type data collection was done to collect the information of all processed foods available for sale at the supermarket from October to December 2011. Foods to which Brazilian nutrition labelling law does not apply were excluded( 18 ), as were those that did not contain added salt or Na-based additives and those that did not have serving sizes defined in grams.
Collection of label information was done with a pre-tested instrument. In this pre-test, information was collected from fifteen processed foods belonging to different food groups according to Brazilian nutrition labelling law. The pre-test data collection was done in a different supermarket from where the study’s data collection occurred. Adjustments were made to the instrument after the pre-test. The final instrument included the following variables: product identification, ingredients list (appearance and position of salt on the list and Na-containing food additives appearing on the list) and Na information (Na, in milligrams, in the nutrition information panel and serving size in grams). Food additives containing Na were identified using the specific Brazilian resolution for food additives( 27 ) and Mercosur’s Harmonized General List of Food Additives and Their Functional Classes( 28 ).
The data collection team was trained and participated in the instrument’s pilot test. The pilot test consisted of filling out the data collection instrument (individually and without assistance) based on the information reported on the labels of five foods. Afterwards, there was a conference of notes by the responsible researchers. For quality control, information on one key question (Na content in mg per serving) was collected twice for 2·0 % of the foods assessed (n 49). Non-conformities in Na content values were found in just two of the forty-nine processed foods assessed and, according to the Bland–Altman test, the difference in means for the variable ‘Na content in mg per serving’ was −2·8 mg (interval of ±2 sd of −43·6 to 37·9 mg). We consider this result satisfactory, since it had a low mean difference for the variable assessed.
Criteria for inclusion of processed foods in the study
We selected processed foods that, based on a review of the literature( Reference Colucci, Philippi and Slater 11 – Reference Conceição, Santos and Silva 13 , Reference Carvalho, Nogueira and Teles 29 – 34 ), met the following criteria: (i) they were present in the diets of Brazilian children and adolescents according to studies and/or official documents that assessed dietary intake in these age groups; and (ii) they were characterized as snacks or snack ingredients.
In the present study, snacks are defined as any food consumed at any time of the day, at home or away from home, in which foods and liquids consumed are not characteristic of a complete meal due to their rapid preparation and/or convenience( Reference Anderson 35 – Reference Andersson, Nydahl and Gustavsson 38 ).
A literature review was performed in the PubMed/MEDLINE – National Library of Medicine and SciVerse/Scopus databases using the following keywords in English and Portuguese: ‘food intake’, ‘Brazil’, ‘children’ and ‘adolescents’. In addition, a search was done on official Brazilian government agency websites to research official documents reporting the foods consumed by children and adolescents. We selected references whose results included lists of foods consumed by Brazilian children and adolescents, totalling eight studies and two official documents( Reference Colucci, Philippi and Slater 11 – Reference Conceição, Santos and Silva 13 , Reference Carvalho, Nogueira and Teles 29 – 34 ).
Data analysis
Collected data were entered into two separate databases and were later checked for errors and validated in EpiData® 3·1 (EpiData Association, Odense, Denmark). The food products were categorized into groups, which were categorized into subgroups, predefined by Brazilian nutrition labelling legislation( 17 ). Na content was assessed by serving size as reported on the nutritional label of each processed food and converted to 100 g or 100 ml of the product. Na content per 100 g or 100 ml was classified as high (>600 mg Na), medium (>120 and ≤600 mg Na) and low (≤120 mg Na), according to the Traffic Light Labels of the UK Food Standards Agency( 20 ). The χ 2 test was used to verify the proportions of foods classified as low Na, medium Na and high Na, and then to associate this classification among the food groups.
The absolute frequency of processed foods by group and subgroup was calculated. In addition, due to the asymmetry of the variables ‘Na content per serving’ and ‘reported serving size’ we checked the median and dispersion of the data in minimum and maximum values.
We assessed compliance of serving sizes reported on nutrition information panels with the reference serving sizes established by Brazilian law( 17 ). Considering that this legislation permits a ±30 % variation from the reference value on labels, the reported serving sizes were classified as being in accordance with the Brazilian law when they were within the 30 % range above or below the reference value. Foods with reported serving sizes above or below the 30 % range were classified as inadequate under the law. We associated serving size adequacy with Na content per gram of food by processed food group by applying the Mann–Whitney test. In addition, we calculated median Na content in milligrams per gram of processed food as well as minimum and maximum values. Calculation of minimum and maximum values was done to obtain a comprehensive view of data variability, including extreme values. Na content values per gram of food aimed to determine the Na content of the processed foods without considering serving size, since serving sizes differ for each food type. This calculation was determined by dividing the Na content per serving size by the serving size reported on the processed food labels. For powdered foods that need to be diluted prior to consumption, this calculation was done by dividing the Na content per serving by the yield stipulated by law.
The statistical software package Stata® version 11·0 was used for the statistical analyses and a two-tailed P value <0·05 was considered indicative of statistical significance.
Results
We selected 2945 processed foods for the present study (Table 1), which were divided into eight groups and forty-one subgroups( 17 ). The processed food groups are: (i) Bread products, cereals, legumes, roots, tubers and their derivatives (n 459); (ii) Fresh and canned vegetables (n 128); (iii) Fruits, juices, nectars and fruit drinks (n 134); (iv) Milk and derivatives (n 537); (v) Meats (n 163); (vi) Oils, fats and seeds (n 82); (vii) Sugars and products providing energy from carbohydrates and fat (n 1319); and (viii) Sauces, ready-to-consume seasonings, broths, soups and prepared dishes (n 123).
Description of recommended and reported serving sizes and sodium content per serving, by processed food subgroup, in a survey of all processed snack foods consumed by children and adolescents available for sale at a large Brazilian supermarket, Florianópolis, October to December 2011
* Reference serving size under Brazilian law( 17 ).
† Reference serving size under Brazilian law( 17 ): amount sufficient to prepare 120 g.
‡ Reference serving size under Brazilian law( 17 ): amount sufficient to prepare 50 g.
§ Reference serving size under Brazilian law( 17 ): amount sufficient to prepare 200 ml.
|| Reference serving size under Brazilian law( 17 ) in kilocalories (up to 500 kcal).
Serving size
Of the 2945 processed foods, 274 were excluded from serving size analyses. Thus, a total of 2671 processed foods were assessed. Powdered foods (n 192) were excluded because the reference serving size under Brazilian law( 17 ) is not determined by a food’s content but rather by its yield. For example, the reference serving size for the gelatin powder subgroup is the ‘amount sufficient to prepare 120 g’ and not a fixed amount in grams of powder( 17 ). Therefore, we excluded from the analysis the subgroups of powders used to prepare flan and desserts, bread mix, powdered milk, powdered gelatin and powdered drinks. Another eighty-two processed foods were excluded because their serving sizes were reported in kilocalories instead of grams.
Of the 2671 processed foods, 86·2 % complied with the reference serving sizes established by Brazilian law. The following subgroups are noteworthy as they complied with the legislated reference serving sizes without using the allowed ±30 % range: frozen pre-fried potatoes and cassava; frozen cheese bread; microwave popcorn; canned vegetables; liquid milk; meat-based hamburger; and mayonnaise (n 145; 5·4 %). In contrast, 9·5 % of the processed foods reported serving sizes smaller and 4·3 % reported serving sizes larger than the reference serving size range, particularly the flour, cereal and cheese subgroups.
We further highlight the great variability among the serving sizes reported on the labels of processed foods belonging to the same subgroup (Table 1). For example, the juice, nectar and fruit drink subgroup had foods with serving sizes with a range of up to 285 ml. This is also the case for the yoghurt, non-alcoholic beverages (carbonated or not) and prepared/semi-prepared dishes subgroups, which had serving size ranges of 225 ml, 200 ml and 200 g, respectively.
Table 2 shows the comparison (by food group) between serving size adequacy and Na content per gram of food. Median Na levels (mg) per gram of food in the groups Bread and cereals, Milk and derivatives and Sugar were higher among those foods with adequate serving sizes, while the highest Na levels in the groups Fruit and juices and Meats were found in foods that reported their serving sizes incorrectly according to Brazilian law (P<0·05 in all cases). It is worth noting that the group Meats had the highest median and, although the median was higher among those foods with inadequate serving sizes, the range between the minimum and maximum Na content values per gram of food was larger for the foods with serving sizes that complied with the law. As in the group Meats, the other groups also had a greater range for those foods with appropriate serving sizes according to Brazilian law.
Comparison between serving size adequacyFootnote * and sodium content per serving, by processed food group, in a survey of all processed snack foods consumed by children and adolescents available for sale at a large Brazilian supermarket, Florianópolis, October to December 2011
* Adequacy according to reference serving size established by Brazilian law( 17 ).
† Mann–Whitney test.
Na content
Na content was assessed for the 2945 processed foods included in the study. In Table 1, it can be observed that fifteen of the forty-one subgroups had Na content medians equal to or higher than 5 mg/g processed food. The cold cuts, sausages and mayonnaise subgroups stand out for having the highest Na levels per gram of food (more than 10 mg/g). In addition, when analysing the minimum and maximum Na content levels per gram of processed food, it can be seen that the cold cuts, microwave popcorn and cereal-based snack subgroups had the greatest variability. The cereal-based snacks subgroup, despite having a median Na level of 6·2 mg/g food, included foods with 20 mg Na/g food, representing a variation of more than 300 %. A similar situation was found in the microwave popcorn and cold cuts subgroups, in which the variations between the median and maximum values were greater than 180 % in both subgroups.
With regard to the maximum Na content values per serving, it was noted that the following subgroups had the highest values (≥500 mg Na/serving): bread, canned vegetables, pickled vegetables, tomato sauce, yoghurt, cheese, tuna, sardines, fish, shellfish, other fish pickled with or without sauces, cold cuts, sausages, hamburgers, cereal snacks, and prepared and semi-prepared dishes. The cold cuts subgroup included foods with up to 3150 mg Na/serving and the hamburger, sausage and prepared/semi-prepared dish subgroups had foods with up to 1063, 1289 and 2390 mg Na/serving, respectively. These same subgroups also had the highest medians and largest ranges of Na content per serving. The chewing gum subgroup had the smallest range; i.e. a 14 mg difference between the foods with the highest and lowest Na content.
Figure 1 shows the Na content per 100 g of processed food by food group and classified as low (≤120 mg Na), medium (>120 and ≤600 mg Na) and high (>600 mg Na) according to the parameters established by the Traffic Light Labelling( 20 ). Of the 2945 processed foods assessed, 21 % had Na content classified as high, 35 % as medium and 43 % as low. It can be noted in Fig. 1 that the group Fruits and juices, which is composed of a single subgroup (juices, nectars and fruit drinks), had the lowest Na content per 100 g, followed by Milk and derivatives and Sugars. On the other hand, the groups Meats; Oils, fats and seeds; and Prepared dishes had the highest percentages of foods with high Na levels (81 %, 58 % and 53 %, respectively). These same groups had the lowest percentage of processed foods classified as low Na (P<0·001).
Relationship between food groups* and the percentage of processed foods classified as low sodium (![]() ), medium sodium (
), medium sodium (![]() ) and high sodium (
) and high sodium (![]() )† in a survey of all processed snack foods consumed by children and adolescents available for sale at a large Brazilian supermarket, Florianópolis, October to December 2011. *The food groups were predefined by Brazilian nutrition labelling legislation (2003)(
17
). †Sodium content per 100 g or 100 ml was classified as high (>600 mg), medium (>120 and ≤600 mg) and low (≤120 mg) according to the Traffic Light Labels of the UK Food Standards Agency (2007)(
20
). This classification was significantly different among the food groups (two-tailed P<0.001, χ
2 test)
)† in a survey of all processed snack foods consumed by children and adolescents available for sale at a large Brazilian supermarket, Florianópolis, October to December 2011. *The food groups were predefined by Brazilian nutrition labelling legislation (2003)(
17
). †Sodium content per 100 g or 100 ml was classified as high (>600 mg), medium (>120 and ≤600 mg) and low (≤120 mg) according to the Traffic Light Labels of the UK Food Standards Agency (2007)(
20
). This classification was significantly different among the food groups (two-tailed P<0.001, χ
2 test)
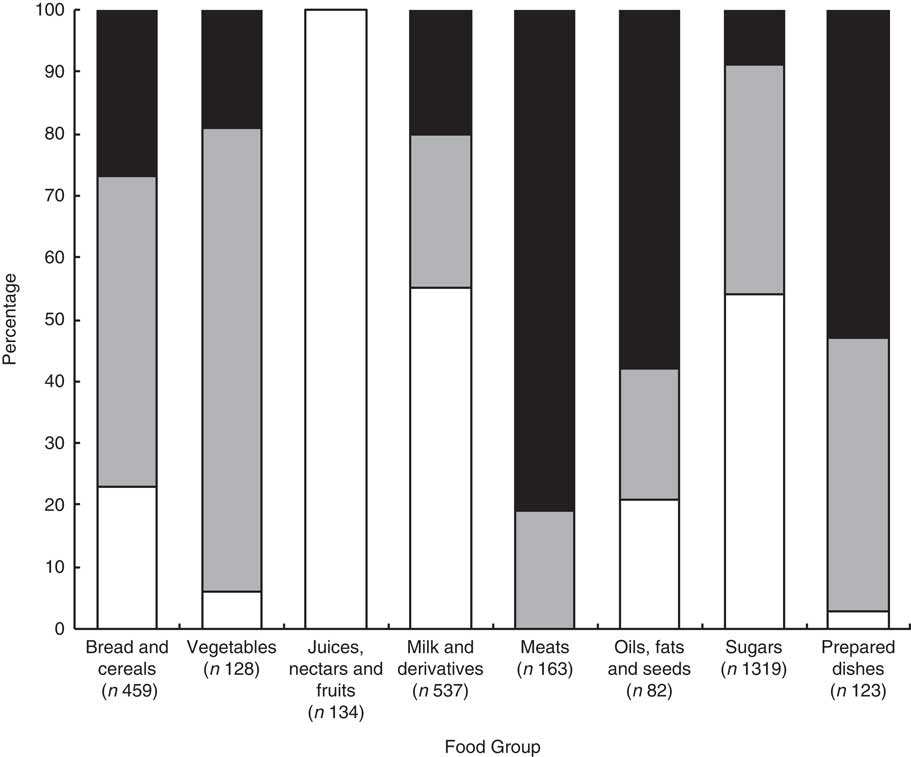
It is noteworthy that the group Sugars and products providing energy from carbohydrates and fat had the greatest number of assessed processed foods – approximately 45 % of the total. Thus, although only 9 % of the foods were high in Na, this percentage represents 126 processed foods that are used for snacks by Brazilian children and adolescents. The 126 processed foods belong to the following subgroups: cookies (n 7), powders for gelatins (n 43), powders to prepare drinks (n 33) and cereal-based snacks (n 43). This represents more foods than are included in the group Oils, fats and seeds or 53 % of the foods in the group Prepared dishes (n 65), that are classified as high Na. It also represents almost the same number of high-Na products as in the group Meats (n 132). It is also worth noting that, with the exception of the group Juices, nectars and fruits, all of the groups had at least 20 % of their foods classified as medium Na, in particular the groups Bread and cereal products (50 %) and Vegetables (75 %). Finally, it can be observed that all of the processed foods in the group Meats were classified as medium Na or high Na.
Discussion
Three main findings can be highlighted based on the study’s results. First, although there is a Brazilian law that establishes serving sizes, 14 % of all the processed foods assessed had non-compliant serving sizes. Second, more than a half of the foods assessed had medium or high Na levels, especially cold cuts, sausages, hamburgers and prepared/semi-prepared dishes. Finally, there is potential for reducing Na levels in most processed foods by using alternatives that already exist in similar foods.
With respect to the labels whose serving sizes did not comply with current law, these foods violate the Consumer Defense Code, which guarantees consumers the right to clear and accurate information about the products they buy and in accordance with the legislation that regulates it( 39 ). In addition, the reporting of serving sizes smaller than the recommendations (observed in 9·5 % of the processed foods) can mislead consumers when making food choices. The authors emphasize that reporting smaller serving sizes on labels may be a way to present nutritional characteristics that will be perceived positively by consumers( Reference Bryant and Dundes 40 – Reference Steenhuis and Vermeer 42 ); in the present case, Na content.
We observed serving size ranges (maximum value minus the minimum value) of up to 285 g or ml, especially in the following subgroups: juices, nectars and fruit drinks; yoghurt; carbonated and non-carbonated non-alcoholic beverages; and prepared/semi-prepared dishes. Lack of serving size standardization was also reported in a study conducted in Australia, which assessed 1070 processed snack foods( Reference Walker, Woods and Richard 41 ). The serving sizes of these foods ranged from 18 to 100 g, which is in line with our study’s findings.
Serving size variability makes it difficult to compare similar foods( Reference Anderson, Barton and Craigie 43 ). Thus, the lack of serving size standardization can cause variability in the content of energy and nutrients such as Na. Therefore, the goals of nutritional labelling can be compromised by the potential for making mistakes when choosing foods( Reference Walker, Woods and Richard 41 , 44 ). An example of this situation was found in our study, with chocolates. On the nutrition information panel, chocolate A had 36 mg Na (serving size=50 g) and chocolate B had 19 mg Na (serving size=17 g). However, when adjusting the Na content to a standard serving size (100 g), it can be seen that actually chocolate B has more Na (111 mg) than chocolate A (72 mg). A similar situation was reported by Temple and Fraser in a study conducted in the USA and Canada( Reference Temple and Fraser 45 ). The authors reported an example of two brands of canned sardines that had the same Na content per 100 g. However, due to the different serving sizes used on their labels, this situation was not clear, which can lead to incorrect interpretation by consumers. Thus, such a situation can cause confusion about the nutritional composition of foods, which goes against Codex Alimentarius guidelines( 16 ). It is further emphasized that consumers will rarely have the time, interest or even the knowledge necessary to perform such calculations, potentially compromising their food choices( 44 ).
The present study also found that in the group Meats, the foods with serving sizes above or below the range recommended by Brazilian law had higher levels of Na per gram of foods. This fact supports the hypothesis suggested by Walker et al., in which the authors point out that serving sizes that do not comply with the law (especially those below the reference range) can be used to confer characteristics considered positive onto processed foods – in the present case, lower Na content( Reference Walker, Woods and Richard 41 ).
We therefore emphasize the importance of establishing standard serving sizes for processed food labelling. Sharp discusses this situation in an article in The Lancet, considering official publications and documents, and suggesting that nutritional information should be reported per serving as well as per 100 g of food( Reference Sharp 46 ).
We found that 21 % of the processed foods were classified as high Na according to the Traffic Light Labelling criteria( 20 ). Noteworthy groups were Meats; Oils, fats and seeds; and Sauces, ready-to-consume seasonings, broths, soups and prepared dishes, as more than half of the foods were classified as high Na. It was observed that only two subgroups (cold cuts and hamburger) did not have foods classified as low Na. Since 95 % of the subgroups have foods classified as low Na, this indicates that the public generally has the option of choosing low-Na foods from a particular subgroup. In addition, this situation suggests the potential to reduce Na content in most of the processed foods assessed, especially those classified as high Na, which is also mentioned by Webster et al.( Reference Webster, Dunford and Neal 47 ).
With regard to reducing Na levels in processed foods, various initiatives are being undertaken in Brazil and around the world. Webster et al. conducted a review study on salt intake reduction strategies around the world. They found initiatives in thirty-two countries, including ones that had positive results in the UK, Finland, Japan, France and Ireland. Strategies undertaken by these countries included: setting targets for reducing salt/Na intake; signing agreements with the food industry to reduce Na levels in processed foods; launching consumer education campaigns; and using nutrition labels with alerts for high salt/Na levels( Reference Webster, Dunford and Hawkes 48 ). In 2011, an agreement was signed between the Brazilian Health Ministry and the food industry. This agreement aimed to set targets for reducing Na levels in processed foods, separating these targets by food group. The food industry must meet these targets by 2020( 49 , 50 ).
According to official Brazilian data, the bread, salty and cream-filled crackers, soft drinks and packaged salty snacks subgroups are the snack foods most consumed by children and adolescents in Brazil( 4 , 10 ). According to the Brazilian Diet and Nutrition Surveillance System (2008), 45 % of children consumed cream-filled cookies, 27 % consumed soft drinks and 54 % consumed salty crackers or packaged salty snacks at least three days per week( 4 ). In addition, the last Family Budget Survey conducted by the Brazilian Geography and Statistics Institute showed that 61 % of adolescents consumed bread daily on the days surveyed from 2008 to 2009( 10 ). Among these subgroups, the bread and cereal-based (salty) snacks subgroups stand out due to their maximum Na values of more than 500 mg/serving. Furthermore, the ranges between the minimum and maximum Na values in these subgroups were greater than 190 mg, particularly for breads, which had a range of 564 mg.
Traffic Light Labelling is the most commonly used reference to classify the Na content of processed foods( Reference Malik, Willett and Hu 19 ). However, it should be noted that its parameter of 600 mg Na/100 g food (high Na) is excessive according to the daily intake needs of children and adolescents. This value represents 60 % of the daily Na intake recommendation for children up to age 3 years, 50 % of the requirement for children aged 4–9 years and 40 % of the requirement for adolescents( 51 ). Thus, it can be inferred that the cut-off for defining high Na levels for children and adolescents could be lower, such as that defined by Brazilian law, which sets 400 mg Na/100 g food as the value to consider a processed food high in Na for these age groups( 52 ).
One possible limitation of the present study is the use of the nutrition labelling to determine a product’s Na content without running chemical analyses. Nevertheless, the study considered that consumers only have access to what is reported on packaging, so the accuracy of such information should be ensured by the manufacturer and tested for compliance with the law( 17 , 18 ). Another potential limitation of the study was the inclusion of products sold in a single store. However, the store is a large supermarket in an urban area that belongs to a large chain and offers a wide variety of food products. Most of these products are sold by other chains throughout the country, since the supermarket does not have its own brand. Thus, this fact is not likely to affect the study’s external validity. Finally, Traffic Light Labelling, the main reference for classifying Na content in processed foods, does not have specific parameters for children and adolescents. Thus, the cut-offs set by this reference to classify foods as high, medium and low in Na may be high for these age groups.
Conclusion
Most of the processed foods assessed in the present study had medium or high Na levels. In addition, it was shown that serving size variability in processed food labels can make comparison of Na content of similar foods difficult. Therefore, we stress the importance of revising Brazilian nutrition labelling law to standardize the serving sizes that must appear on labels. For example, requiring nutrition information to be reported per 100 g or 100 ml and not allowing variations in this serving size could help consumers to compare the levels of Na and other nutrients present in similar foods. Furthermore, we have identified the need to develop a new method to classify Na levels in processed foods, with specific parameters for children and adolescents. Finally, we point out the potential for reducing Na levels in most processed foods, as evidenced by the variability in Na content within subgroups.
Acknowledgements
Financial support: The present study was supported by Capes Foundation, Ministry of Education of Brazil, Brasilia, DF, Brazil. The funders had no role in the design, analysis or writing of this article. Conflict of interest: None. Authorship: M.V.S.K. contributed to collection, analysing and interpreting the data, and drafting the manuscript. R.C.O. was responsible for revision of the final manuscript. D.A.G.-C. was responsible for data analysis and the interpretation of results. R.P.C.P. was responsible for the design of the original study, research coordination, and revision of the final manuscript. All of the authors approved the version for publication. Ethics of human subject participation: Ethical approval was not required.


