


Grocery and corner store nutrition intervention trials are increasingly being conducted throughout the USA and other countries to improve the food environment and, subsequently, dietary behavioursReference Adam and Jensen (1) . Given that grocery stores account for over 50 % of all food expenditures in the USA (2) , nutrition interventions that successfully increase purchases of healthier food items could significantly impact public health and nutritional outcomesReference Hartmann-Boyce, Bianchi and Piernas (3) .
The field of behavioural economics, which examines how psychological, social, cognitive and emotional factors affect people’s economic decision makingReference Goodwin, Harris, Nelson and Lobell (4) , may offer new insights and tools for informing the design of retail-based nutrition interventionsReference Ammerman, Hartman and De Marco (5) . ‘Nudges’, which are a key component of behavioural economics, aim to alter behaviour in a predictable way without forbidding any options or significantly changing shoppers’ economic incentivesReference Thaler and Sunstein (6) . Examples of nudges in grocery or corner store settings may include focused lighting on promoted items, moving promoted items to the front of the store, installing shelf labels that advertise the promoted items and bundling of promoted food itemsReference Ammerman, Hartman and De Marco (5) .
A number of studies have examined the impact of nudges on sales of nutritious food items in grocery and corner store settings(7–11). A 2010 quasi-experimental study by Gittelsohn et al. in Baltimore, Maryland, USA, found that shoppers in intervention stores (which included seven corner stores and two grocery stores) were more likely to report purchasing of a healthy item due to the presence of a shelf labelReference Gittelsohn, Song and Suratkar (7) . Additionally, a 2018 shopping simulation study by Carroll et al. found that bundling of fruits and vegetables together led to increased fruit and vegetable purchasesReference Carroll, Samek and Zepeda (8) . In 2017, a natural experiment in Canada by Hobin et al. found that relative to control supermarkets, a ‘Guiding Stars’ shelf-labelling nudge led to changes towards purchases of foods with higher nutritional ratings; however, shifts varied in direction and magnitude across food categoriesReference Hobin, Bollinger and Sacco (9) . Additionally, a 2014 cluster randomized controlled trial in Philadelphia, Pennsylvania, USA, and Wilmington, Delaware, USA, by Foster et al. found that various placement and promotion nudges, such as extending the shelf space for promoted intervention products, increased sales of skimmed and 1 % milk, water, and two out of three types of frozen meals compared with control store sales during the same time periodReference Foster, Karpyn and Wojtanowski (10) . However, the authors found no significant differences in sales of cereal, whole or 2 % milk, beverages or diet beveragesReference Foster, Karpyn and Wojtanowski (10) . Lastly, a 2016 quasi-experimental study in Denmark by Winkler et al. found that a ‘healthy checkout’ nudge increased sales of carrot snack packs in intervention stores when compared with sales before the intervention in control stores, but found no significant effect on sales of other promoted intervention items including baked sweets, dried fruit, fresh fruit and fruit barsReference Winkler, Christensen and Glümer (11) .
The inconclusive findings of these studies support further examination of the impact of nudges on sales of promoted intervention items in grocery stores and in smaller food retail settings, such as corner stores or convenience stores. The present study therefore aimed to design and evaluate three different behavioural economics nudges on store sales of targeted healthy items. Four interventions were implemented to test the three nudges in both a grocery store and a convenience store setting: a ‘cognitive fatigue’ experiment, in which floor arrows guided customers to the store’s produce section (three floor arrows were installed in the grocery intervention store and one floor arrow was installed in the convenience intervention store); a ‘scarcity’ experiment, in which one sign in one area of the produce section portrayed a ‘limited amount’ message; and a ‘product placement’ experiment, where granola bars were moved into the candy bar aisle. The fourth intervention was the implementation of all three nudges simultaneously.
Methods
Study design
A multiple interrupted time-series design was conducted to test four retail-based nutrition interventions from March to August 2017. Each intervention ran for 4 weeks, followed by a 2-week washout period. The interventions were implemented in both a convenience store setting (one intervention store and one control store) and a grocery store setting (one intervention store and one control store), for a total of four stores. Researchers defined a convenience store as ‘a retail outlet that sells a limited range of prepared and ready-to-eat foods, bottled and fountain beverages, household staples, tobacco products, and periodicals, and are typically small in size, open extended hours, and staffed by a relatively small team of cashiers, stock workers, and managers’ (12) . In contrast, a grocery store was defined as ‘a retail outlet that specializes in the selling of food, both fresh and prepackaged, as well as nonfood household goods, such as paper towels, toilet paper, cleaning products and over-the-counter medicines’ (12) .The interventions were implemented in the following order in the convenience intervention store: ‘cognitive fatigue’ nudge, all three nudges combined, ‘product placement’ nudge and ‘scarcity’ nudge. In the grocery store, the implementation order was: ‘scarcity’ nudge, ‘product placement’ nudge, all three nudges combined and ‘cognitive fatigue’ nudge. Randomization was used to determine the order in which the stores received the nudges. The research team decided to implement the nudges in a different order to prevent ‘double dosing’ of a nudge in case a shopper visited both the intervention convenience store and intervention grocery store during an intervention period. However, this was unlikely to happen because the grocery and convenience intervention stores are located 108 km (67 miles) from each other.
Store settings
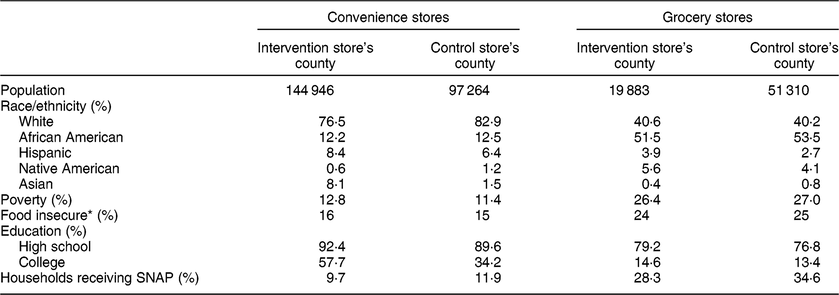
The convenience store interventions were conducted in one store located in a predominantly rural county in central North Carolina. The county is ‘predominantly’ rural because there is a town with approximately 60 000 people and a large university located within this county. However, the intervention convenience store was not located in this town, but in a rural area of the county. This convenience store belonged to a chain of convenience stores that has over fifty locations throughout the Southeast USA. A control convenience store was recruited from the same chain, but from a different county with similar demographics as the intervention store’s county (Table 1). The control convenience store was located 148 km (92 miles) away from the intervention convenience store.
Demographic information for the four rural counties in central North Carolina, USA, where the two grocery stores and two convenience stores are located, 2017
SNAP, Supplemental Nutrition Assistance Program.
* Defined as the percentage of the population who lack adequate access to food(33).
The grocery store interventions were conducted in one grocery store located in a rural county in north central North Carolina. This store belonged to a chain of grocery stores that has six locations throughout North Carolina. A control store was recruited from the same grocery store chain, but from a different county with similar demographics as the intervention grocery store’s county (Table 1). The control grocery store was located 51·5 km (32 miles) away from the intervention grocery store.
To be included in the study, a store had to be officially registered as a business with the state of North Carolina and have a North Carolina business licence, provide electronic sales data to the research team, accept SNAP (Supplemental Nutrition Assistance Program) Electronic Benefit Transfer (EBT) benefits, and be located in a county where food insecurity rates are 15 % or greater. Because food-insecure residents tend to shop more frequently in convenience storesReference Ma, Liese and Hibbert (13) , the research team wanted to evaluate the interventions in both a convenience store and a grocery store setting. Therefore, both grocery stores and convenience stores were recruited for the study. The first four stores that were recruited for the study agreed to participate. This success was most likely due to the existing partnerships that existed between the research team and the stores. The study was approved by the University of North Carolina at Chapel Hill Institutional Review Board.
Interventions
In both the convenience and grocery store settings, four low-cost nutrition interventions were conducted that tested three different behavioural economics nudges. Researchers chose to promote healthy items that the store was already selling, rather than request that the retailer procure and sell new items, for feasibility and sustainability purposes. The targeted intervention items in the convenience store for the ‘cognitive fatigue’ and ‘scarcity’ nudges were apples, bananas and oranges, and the ‘product placement’ nudge promoted granola bars. In the grocery intervention store, the targeted intervention item for the ‘cognitive fatigue’ and ‘scarcity’ nudges was bananas, and the ‘product placement’ nudge promoted granola bars.
Nudge 1: cognitive fatigue
The first nudge that the research team evaluated was based on the concept of ‘cognitive fatigue’, which poses that prolonged active engagement on cognitively demanding tasks often leads to cognitive overload and wearinessReference Massar, Csathó and Van der Linden (14) . Previous studies have found that cognitive fatigue may result in diminished motivation, increased distractibility and changes in information processingReference Mullette-Gillman, Leong and Kurnianingsih (15) . Most American grocery stores contain over 40 000 brands, which may lead to cognitive fatigue and distract customers from a planned healthy purchaseReference Ruhlman (16) . Thus, to prevent cognitive fatigue among shoppers (and therefore enhance shoppers’ abilities to make informed decisions about their food purchases), the research team installed floor arrows to guide customers to the produce section of the stores. Researchers installed one floor arrow in the convenience intervention store and three floor arrows in the grocery intervention store due to the larger square footage. The floor arrows were large (~1 m × ~1 m (3 ft × 3 ft)) and orange. Within the arrow, there was text that contained the phrase: ‘This way to healthy food!’ In the convenience store, researchers placed the floor arrow approximately 1·5 m (5 ft) from the store entrance and pointed the arrow directly towards the produce section. In the grocery intervention store, researchers placed the first floor arrow near the store entrance. The remaining two arrows were placed on the most direct path leading to a large display of bananas in the produce section of the store.
Nudge 2: scarcity
Human adults often show a preference for scarce over abundant goodsReference John, Melis and Read (17) ; the research team therefore tested a ‘scarcity’ nudge, which consisted of displaying signage in the produce section that contained the phrase ‘Only a few left in stock!’ (displayed in the convenience store) or ‘While Supplies Last!’ (displayed in the grocery store). In the convenience store, one scarcity sign was placed next to a three-tiered basket stand that contained apples, oranges and bananas. In the grocery store, one scarcity sign was placed next to a large display of bananas.
To develop the scarcity messages for the signage, researchers first compiled a list of example scarcity messages commonly used by businesses from CXL, a digital marketing and e-commerce optimization agency (18) . The effectiveness of each message was then examined using Amazon’s Mechanical Turk (MTurk). MTurk is an online platform where ‘requesters’ (in this case, the research team) post online HITs (human intelligence tasks) for ‘workers’ to completeReference Sheehan and Pittman (19) . Anyone who registers for an Amazon account is eligible to become an MTurk workerReference Sheehan and Pittman (19) . The scientific literature overwhelmingly concludes that MTurk is an efficient, reliable and cost-effective tool for generating sample responses that are largely comparable to those collected via more conventional meansReference Mortensen and Hughes (20) . While results from MTurk may not be generalizable to all populations, a 2017 review of seventy-five articles by Keith et al. found that, on average, MTurk participants have lower incomes compared with nationally representative samples of survey participantsReference Keith, Tay and Harms (21) . Thus, because food insecurity is associated with lower income (22) , MTurk results may be applicable to food-insecure populations.
The research team paid fifty MTurk workers $US 0·45 to rate eleven scarcity messages. Workers were asked how effective each message would be in persuading them to buy a particular item. The highest-ranked message (‘Only a few left in stock!’) was selected as the message that would be displayed on the scarcity signs for the intervention in both the convenience store and grocery store. However, the grocery store manager did not like this message and requested that a ‘softer’ scarcity message be displayed. The research team and grocery store manager therefore worked together to create the ‘While Supplies Last!’ message to use for the scarcity sign in the grocery store.
Nudge 3: product placement
Research indicates that cues, such as a product’s appearance, name, description or brand, can significantly influence individuals’ expectations of how a new product will taste and, thus, how likely individuals are to try a new product(Reference Tuorila, Meiselman and Cardello23–25). These cues can also influence an individual’s post-consumption opinion of taste and experience with the product(Reference Tuorila, Meiselman and Cardello23–25). Based on this research, the research team selected a brand of granola bars to move from the granola bar section to the candy bar section of the intervention stores in the hope of increasing the appeal, taste expectations and, therefore, sales of those granola bars. The research team chose to promote granola bars rather than produce for this nudge because the team expected that a granola bar was more likely to be swapped for a candy bar than a piece of fruit or vegetable. Additionally, it was not feasible to put produce items near the candy due to the lack of appropriate shelf space and the need to maintain freshness.
A registered dietitian conducted a nutrient analysis on all granola bars that the stores carried to determine which granola bars to promote. The specific granola bars that were promoted were selected based on saturated fat, added sugar and fibre content. The research team also displayed a shelf hanger below the granola bars that displayed the message ‘Real Food Real Fuel’.
Outcome measures
The following were measurement components to the study: weekly store fidelity checks, customer intercept surveys during the intervention washout periods, weekly aggregated grocery store and convenience store transaction data, and store manager exit interviews. Based on information provided by the store managers on store traffic patterns, fidelity checks and customer intercept surveys were administered on weekdays between 10.00 and 15.00 hours when stores were most busy.
Research assistants conducted weekly fidelity checks in each of the intervention stores during the 22-week intervention period. Research assistants filled out checklists regarding the quality and locations of the promoted intervention items and intervention materials. Additionally, because price influences food purchasing behavioursReference DiSantis, Grier and Odoms-Young (26) , research assistants recorded the prices of the promoted intervention items during each fidelity check. Lastly, customer interactions with the intervention materials were also recorded. To assess customer interaction with the intervention materials, research assistants observed the intervention materials for at least 5 min during all fidelity checks. The research assistants would record whether any customers looked at the materials, touched the materials, or spoke with a store employee or fellow shopper about the materials.
Additionally, during the 22-week intervention period, research assistants administered customer intercept surveys in intervention stores at the end of each 4-week intervention (during the 2-week washout periods) to evaluate whether customers noticed or were influenced by the intervention materials. The research team chose to survey customers during the washout periods instead of the intervention periods to avoid encouraging customers to engage with the intervention materials when they otherwise would not have and, therefore, potentially bias the study. Research assistants stood at store entrances and approached customers to complete a survey until thirty surveys had been completed. The surveys were two pages long (one page, front and back) and were self-administered. Shoppers received $US 1 for completing the survey. Survey questions included demographic information, questions regarding the frequency of shopping at the store and whether intervention materials encouraged the customer to purchase healthier items. Responses were based on a six-point Likert scale, ranging from 1 = ‘completely disagree’ to 6 = ‘completely agree’.
The customer intercept surveys also asked shoppers whether they recognized images of the intervention materials. For example, the customer intercept surveys that were administered after the implementation of the ‘cognitive fatigue’ nudge included photos of the orange floor arrow, plus three other photos of ‘fake’ promotion signs that were never present in the store. Customers were asked to select which photo(s) they remembered seeing over the past 4 weeks. The surveys administered after the ‘scarcity’ nudge included photos of either the ‘While Supplies Last!’ sign (in the grocery intervention store) or the ‘Only a few left in stock!’ sign (in the convenience intervention store), plus three other photos of ‘fake’ promotion signs that were never present in the store. Additionally, the customer intercept surveys administered after the ‘product placement’ nudge included a photo of the ‘Real Food Real Food’ shelf hanger, as well as three other photos of ‘fake’ promotion signs that were never present in the store. After the combined intervention, the customer intercept surveys included photos of the orange floor arrow, the appropriate scarcity sign and the ‘Real Food Real Fuel’ shelf tag, as well as three other photos of ‘fake’ promotion signs that were never present in the store.
All stores provided weekly aggregated sales data from November 2016 to November 2017. Total store and featured intervention item sales data were provided for 14 weeks before the intervention (baseline), the 22 weeks of the intervention and 14 weeks after the intervention (post-intervention).
Store manager interviews were conducted upon the completion of all four interventions in August 2017. The research team conducted one 30 min semi-structured qualitative interview with each intervention store’s manager (for a total of two interviews). Interview items included questions regarding their motivation for involvement in the project, their perceived effectiveness of the interventions, the ease of the interventions’ implementation and their suggestions for improvement. Both interviews were recorded and transcribed verbatim by the research team.
Statistical analysis
Analysis of sales data and survey data was conducted using the statistical software package Stata/se version 15 (2017). Sales data were analysed using ANOVA with the proportions of mean weekly sales of the intervention items to total store sales compared for baseline and intervention. Analysing the proportion of mean weekly sales of intervention items to total store sales (rather than just analysing mean weekly sales) controlled for the general sales activity at the store. Analyses of sales data were conducted separately for convenience stores and grocery stores because sales data units were dissimilar (convenience stores provided units sold, whereas grocery stores provided the amount sold in dollars).
Qualitative software was not used to analyse store manager exit interviews because of the small sample size and short transcript length. The research team used Sandelowski’s method for writing memos and Maxwell and Miller’s method of developing matrices to conduct thematic content analysis for all qualitative data(Reference Sandelowski27,Reference Maxwell, Miller, Hesse-Biber and Leavy28) .
Results
Customer intercept surveys: convenience store
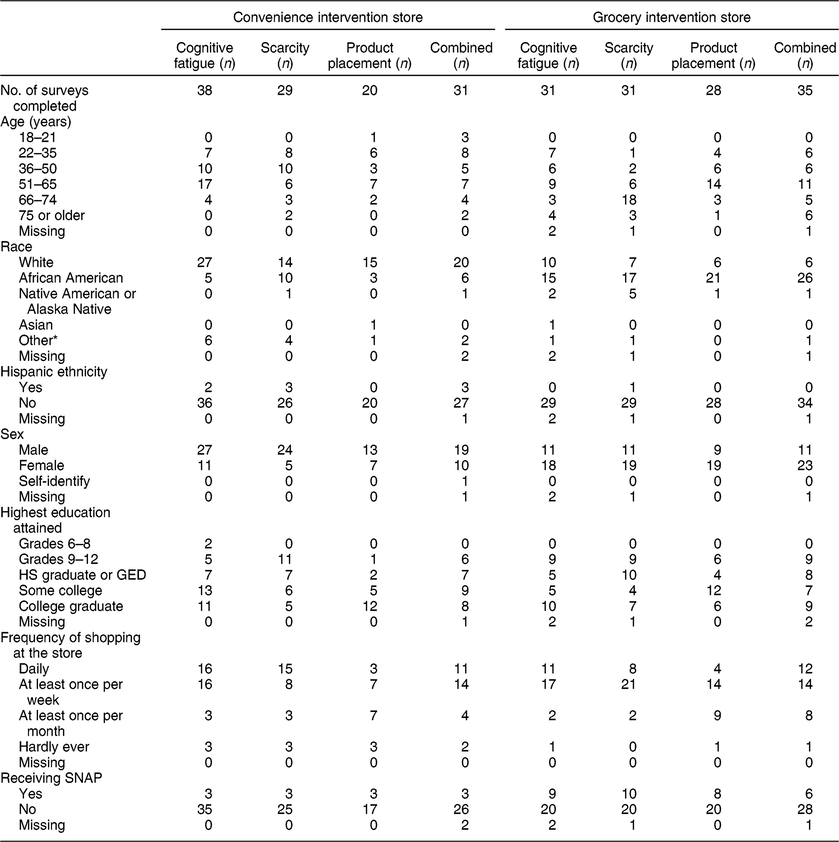
One hundred and eighteen shoppers completed customer intercept surveys throughout the four survey administration periods in the convenience intervention store. The majority of shoppers who completed the customer intercept surveys in the convenience intervention store were male (n 83) and non-Hispanic White (n 76). The age range of survey respondents varied across the different survey administration periods. For a breakdown of demographics by intervention type, see Table 2.
Customer demographics by store type and intervention type among a convenience sample of shoppers from one grocery and one convenience store in rural central North Carolina, USA, 2017
HS, high school; GED, General Education Development; SNAP, Supplemental Nutrition Assistance Program.
* Includes Native Hawaiian or Pacific Islander, two or more races, or self-identify.
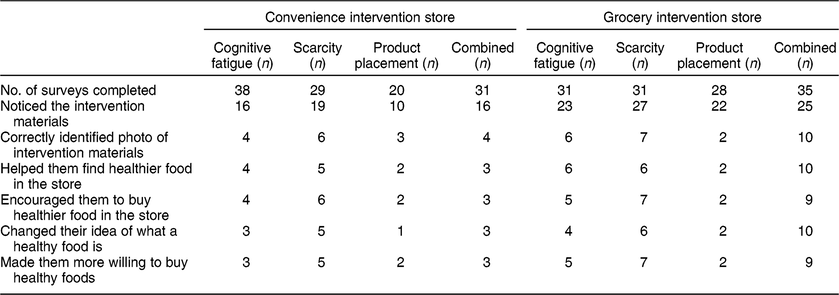
Out of the 118 shoppers who completed the surveys, sixty-one reported that they remembered seeing the intervention materials. Of these respondents, seventeen were able to correctly identify pictures of the intervention materials. Among the seventeen shoppers who correctly identified the materials, the majority agreed that the intervention materials helped them find healthy food in the store (n 14), encouraged them to buy healthier food (n 15), changed their idea of what a healthy food is (n 12) and made them more willing to buy healthy foods (n 13). For a breakdown of survey responses by intervention type in the convenience intervention store, see Table 3.
Customer intercept survey results by store type and intervention type among a convenience sample of shoppers from one convenience store and one grocery store in rural North Carolina, USA, 2017
Customer intercept surveys: grocery store
One hundred and twenty-five shoppers completed customer intercept surveys throughout the four survey administration periods in the grocery intervention store. The majority of shoppers who completed the customer intercept surveys were female (n 79), African American (n 79) and between the ages of 51 and 65 years (n 52). For a breakdown of demographics by intervention type, see Table 2.
Out of the 125 shoppers who completed the surveys, ninety-seven reported that they remembered seeing the intervention materials. Of these respondents, twenty-five were able to correctly identify pictures of the intervention materials. Among the twenty-five shoppers who correctly identified the materials, the majority agreed that the intervention materials helped them find healthy food in the store (n 24), encouraged them to buy healthier food (n 23), changed their idea of what a healthy food is (n 22) and made them more willing to buy healthy foods (n 23). For a breakdown of survey responses by intervention type in the grocery intervention store, see Table 3.
Changes in sales
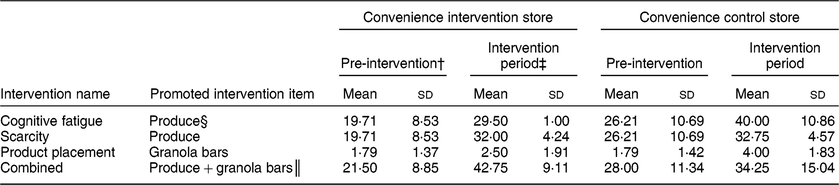
Average weekly baseline sales from 14 weeks prior to the beginning of the first intervention, as well as average weekly sales during the 4-week intervention periods, are summarized in Tables 4 and 5. Table 4 provides information regarding units sold in convenience stores, whereas Table 5 provides information regarding the amount sold in US dollars in grocery stores.
Average weekly units sold of featured food items from four different nutrition interventions in two convenience stores in rural North Carolina, USA, 2017*
*These are raw numbers and do not take account of total store sales.
†Weekly average of 14 weeks of baseline sales data (December 2016–March 2017).
‡Weekly average of 4 weeks of intervention period sales data.
§Produce includes bananas, oranges and apples.
║Granola bars include CLIF® and Special K® Protein Meal Bars.
Average weekly sales, in US dollars, of featured food items from four different nutrition interventions in two grocery stores in rural North Carolina, USA, 2017*
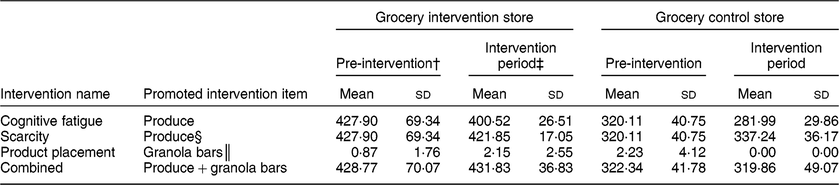
*These are raw numbers and do not take account of total store sales.
†Weekly average of 14 weeks of baseline sales data (December 2016–March 2017).
‡Weekly average of 4 weeks of intervention period sales data.
§Produce included bananas.
║Granola bars included a variety of Nature Valley® Bars.
Results from the ANOVA are presented in Tables 6 and 7. Among the convenience stores, there were no significant differences between sales of the promoted items during the intervention period for the ‘cognitive fatigue’, ‘scarcity’ or ‘product placement’ nudge compared with baseline sales (Table 6). However, compared with baseline sales, implementation of all three nudges simultaneously was associated with an increase in sales of the promoted intervention items (apples, oranges, bananas and granola bars) during the 4-week intervention period based on proportional computations (P = 0·001), whereas no significant changes in sales were observed in the control convenience store (Table 6). Among the grocery stores, there were no significant differences between sales of the promoted items (bananas or granola bars) during the 4-week intervention period for the ‘cognitive fatigue’, ‘scarcity’ or ‘product placement’ nudge or the combined intervention compared with baseline sales (Table 7).
Mean proportion of units sold of featured food items to total units sold from four different nutrition interventions in two convenience stores in rural North Carolina, USA, 2017

*Proportions were multiplied by 10 000 to be easier to read and interpret. Statistical analyses were conducted using unadjusted values.
†P values are based on ANOVA, comparing pre-intervention with intervention.
‡Produce includes bananas oranges and apples.
§Granola bars include CLIF® and Special K® Protein Meal Bars.
Mean proportion of units sold of featured food items to total units sold from four different nutrition interventions in two grocery stores in rural North Carolina, USA, 2017

*Proportions were multiplied by 10 000 to be easier to read and interpret. Statistical analyses were conducted using unadjusted values.
†P values are based on ANOVA, comparing pre-intervention with intervention.
‡Produce included bananas.
§Granola bars include a variety of Nature Valley® Bars.
Intervention adherence: convenience store
Research assistants conducted weekly fidelity checks in the convenience intervention store for each of the four interventions, which resulted in a total of sixteen fidelity checks. Overall, adherence to the intervention in the convenience store was high. The promoted intervention products were stocked for 100 % of all fidelity checks in the convenience store. Price tags were displayed for the promoted products for fifteen out of the sixteen fidelity checks (four out of four for the ‘cognitive fatigue’ fidelity checks; four out of four for the ‘scarcity’ fidelity checks; four out of four for the ‘product placement’ fidelity checks; three out of four for the combined intervention fidelity checks) and prices for all promoted items remained consistent during the 22-week intervention period. Promoted items appeared appealing (no bruising or damage to the products) in fifteen out of the sixteen fidelity checks (four out of four for the ‘cognitive fatigue’ fidelity checks; four out of four for the ‘scarcity’ fidelity checks; four out of four for the ‘product placement’ fidelity checks; three out of four for the combined intervention fidelity checks). Intervention materials were in place for sixteen out of the sixteen of fidelity checks (however, the floor arrow was ‘slightly creased and had several marks’ in two out of the four fidelity checks for the combined intervention).
Intervention adherence: grocery store
Research assistants also conducted weekly fidelity checks in the grocery intervention store for each of the four interventions, which resulted in a total of sixteen fidelity checks. Overall, adherence to the intervention in the grocery store was high. The promoted intervention products were stocked for 100 % of all fidelity checks. Price tags were displayed for the promoted products for 100 % of all fidelity checks and prices for all promoted items remained consistent during the 22-week intervention period. Promoted items appeared appealing (no bruising or damage to the products) in 100 % of fidelity checks. Intervention materials were in place for eleven out of the sixteen of fidelity checks (two out of four ‘cognitive fatigue’ fidelity checks; four out of four ‘scarcity’ fidelity checks; two out of four ‘product placement’ fidelity checks; three out of four combined intervention fidelity checks). Reasons for out-of-place intervention products or materials included removing floor arrows in order to strip and re-wax the grocery store floors, clerks mistakenly moving granola bars back to the original granola bar section and scarcity signs missing for unknown reasons. When intervention products or materials were missing or out of place, research staff informed the store managers and the store managers corrected the issue.
Store manager interviews
Both convenience and grocery store managers believed that the ‘cognitive fatigue’ intervention was the most successful intervention. Most of the discussion during the store manager interviews revolved around ways to improve the floor arrows. Both managers discussed ideas for making the floor arrows more engaging for the customers. One manager mentioned adding healthy food designs on the arrows. Other suggestions included having multiple arrows or a cardboard cut-out pointing to a specific area of the store. With these designs, the store managers thought that customers might be more inclined to follow the arrows and potentially purchase healthier food options.
An issue that was also addressed by store managers was the perceived ineffectiveness of the scarcity sign. The scarcity sign was used for bananas, oranges and apples, which were previously popular purchases for the produce section and produce department. Instead of advertising a popular item, managers stated that it might be more effective to have a scarcity sign for a less favoured food, such as broccoli.
The ‘product placement’ was the least discussed out of all the interventions; however, one manager proposed that healthier items should be placed right in front of the cash register. With this implementation, customers might be less likely to ‘impulse buy’ the unhealthy options that are normally next to the register.
Discussion
Results from the present study indicate that there were no significant differences between sales of the promoted items during any of the four the intervention periods compared with baseline sales in the grocery store setting. However, implementation of three nudges simultaneously was associated with an increase in sales of the promoted intervention items compared with baseline sales in a convenience store setting. This suggests that one nudge alone may not be influential enough to alter purchasing behaviour in a store setting; instead, multiple concurrent nudges may be needed to influence purchasing behaviour. Additionally, these results may also be due to design flaws with the nudges, as highlighted by the store managers during the store manager exit interviews. For example, perhaps the ‘scarcity’ nudge alone would have increased sales of the promoted produce items if the nudge had promoted a less favoured food, such as broccoli, instead of an already popular food, such as bananas.
Consistent with the results reported by Gittelsohn et al.Reference Gittelsohn, Song and Suratkar (7) , the present study found that that a store-level nudge was associated with increased sales of produce purchases in a convenience store setting, although our study found that multiple nudges, rather than one nudge, were required in order to be associated with increased purchases. Unlike the results from Hobin et al.Reference Hobin, Bollinger and Sacco (9) , Foster et al.Reference Foster, Karpyn and Wojtanowski (10) and Winkler et al.Reference Winkler, Christensen and Glümer (11) , the present study found no significant differences between sales of the promoted items during the intervention periods compared with baseline sales in a grocery store setting.
There are several possible reasons for the discordant findings between the convenience store and grocery store results. According to the results from the customer intercept surveys, the convenience store contained a higher sample of shoppers who visited the store daily (38·1 % of shoppers, whereas 28·0 % of shoppers reported shopping at the grocery store daily). Thus, more customers may have interacted with the intervention materials in the convenience store, causing them to purchase the promoted items. However, the customer intercept surveys were based on a convenience sample and therefore may not be representative of overall shopping patterns and shopper demographics. Additionally, the convenience intervention store had a higher adherence than the grocery intervention store to all four of the interventions. Furthermore, shopper demographics were different between the convenience and grocery intervention stores; convenience store shoppers were predominantly White and male, whereas grocery store shoppers were predominantly African American and female. Perhaps the present study’s nudges resonated more with White males than African-American females due to cultural or gender-related factors. Lastly, due to the quasi-experimental study design, it is possible that events occurring concurrently with the intervention could have caused the observed association in the convenience store, rather than the nudges.
Strengths of the present study include testing low-cost, innovative and easy-to-implement nutrition interventions, the use of objective sales data to evaluate the primary outcome, and the evaluation of nudges in an actual store setting v. a simulated shopping experiment in a research lab. The research team also evaluated nudges in both a convenience store and a grocery store setting. Additionally, the research team was able to obtain sales data from control stores located in counties with similar demographics as the intervention stores, which strengthened the ability to draw conclusions from the data.
The present study has several limitations. First, the lack of intervention randomization limits the ability to make causal inferences about the data; thus, these results are preliminary, and randomized controlled trials should be conducted in the future to test the effect of the study’s nudges on store sales of promoted items. Additionally, the 2-week washout periods may not have completely removed the effect of the previous intervention; therefore, any observed intervention effect may be partially due to spillover effects from the previously implemented intervention. Furthermore, the researchers did not promote the same item across the different interventions; thus, it is possible that the nudges may have had different results had the same products been promoted across the different nudges. Moreover, because the scarcity messages differed between the intervention grocery store and the intervention convenience store, this also may have impacted the study’s results and contributed to the discordant findings between the grocery and convenience stores. Future retail intervention research should test signage for acceptability with store managers first before finalizing the intervention’s design. Additionally, each nudge was assessed at different time points. Because food purchasing patterns vary based on season(Reference Ziegler, Wilcox and Mason29–Reference Fahey, Sasaki and Kobayashi32), the present study is limited in its ability to extrapolate the effects (or lack of effects) to other times of the year and to compare effects across the different nudges. Lastly, the counties where the stores are located, as well as the sample of shoppers who completed the customer intercept surveys, do not have socio-economic and demographic characteristics that are similar to the national average, which limits the generalizability of the study’s findings. However, these study results are likely generalizable to other stores located in rural counties in the American South. Future research should be conducted to examine the impact of the study’s nudges on store sales in urban and suburban settings throughout other regions of the USA. Future research should also examine whether the study’s nudges increase shoppers’ actual consumption of promoted intervention items.
Conclusions
The present study found that relative to a control store, implementing three nudges concurrently in a convenience store setting was associated with an increase in sales of the promoted intervention items compared with baseline sales. However, before stores consider implementing these nudges to increase sales of nutritious items, further research is warranted. Future randomized controlled trials should examine the impact of the study’s nudges on store sales of promoted intervention items in suburban and urban settings and in other regions of the USA.
Acknowledgements
Acknowledgements: The authors thank Daniella Uslan, Bill Kearney, Brett Sheppard and Tiki Windley for their assistance with this project. They are also grateful to the two convenience stores and two grocery stores for their participation and cooperation during the study. Financial support: Funding for this project was provided by a grant from the US Department of Agriculture through the North Carolina Department of Health and Human Services, Division of Social Services (federal award identification numbers: 17165NC4062514 and 18175NC4062514). The funder had no role in the design, analysis or writing of this article. Conflict of interest: None. Authorship: M.D.M. obtained funding for the study and originated the research ideas. M.D.M., L.E.C. and C.S. designed and implemented the study. L.E.C. and C.S. collected the data. L.E.C. and C.Z. analysed the quantitative data. M.K. and C.S. analysed the qualitative data. L.E.C. wrote the first draft with contributions from M.D.M. All authors reviewed and commented on the subsequent drafts of the manuscript. Ethics of human subject participation: This study was conducted according to the guidelines laid down in the Declaration of Helsinki and all procedures involving human subjects were approved by the University of North Carolina at Chapel Hill Institutional Review Board. Verbal informed consent was obtained from all subjects. Verbal consent was witnessed and formally recorded.



