


Nutrition is an important modifiable factor influencing bone health( Reference Mitchell, Cooper and Dawson-Hughes 1 ), and thus an optimised diet could help reduce age-related osteoporotic bone deterioration and risk for fracture, an increasingly critical issue in our ageing population. The significance of dietary Ca and vitamin D to bone, especially during development, has been well established in the literature( Reference Gennari 2 ), although the true benefits of supplementation in later life has been subject to recent debate( Reference Michaelsson 3 ). Research has now begun to appreciate that other nutrients may be similarly important. In particular, growing evidence supports the importance of micronutrients and antioxidants abundant in fruit and vegetables, including Mg, K( Reference Hayhoe, Lentjes and Luben 4 ) and vitamin C( Reference Finck, Hart and Jennings 5 ).
Carotenoids are a class of phytochemicals found in particular abundance in yellow–orange and dark-green leafy vegetables( Reference Arscott 6 ). Their chemical structure contains a conjugated double-bond chain forming a chromophore, which confers a specific colour, for example, yellow (lutein), orange (β-carotene) or red (lycopene), and provides antioxidant properties and the potential for energy transfer reactions( Reference Arscott 6 ). They were originally hypothesised to exert their effects on bone via provitamin A activity, as vitamin A, in its active form as retinoic acid, is known to regulate the balance between osteoblastic bone formation and osteoclastic bone resorption, to up-regulate vitamin D receptors, and to have an anabolic effect on bone, except at high doses where it may accelerate bone resorption( Reference Yamaguchi 7 ). However, some carotenoids (lutein, zeaxanthin and lycopene) do not possess provitamin A activity, and thus the positive effect of non-provitamin A carotenoids on bone health supports the concept of a mechanism independent of vitamin A. Reactive O species have been shown by in vitro experiments, including those using human cell lines, and in vivo animal studies to be involved in multiple processes with the potential to adversely affect bone remodelling. These include suppressing osteoblastic differentiation( Reference Mody, Parhami and Sarafian 8 ), increasing osteoclastogenesis( Reference Garrett, Boyce and Oreffo 9 , Reference Lee, Choi and Baik 10 ) and osteoclastic differentiation( Reference Lee, Choi and Baik 10 , Reference Bai, Lu and Liu 11 ), and activating the transcription factor NF-κB, which is involved in bone resorption signalling( Reference Bai, Lu and Liu 11 ). Thus, the potent independent antioxidant activity of carotenoids has the potential to reduce bone resorption and lower fracture risk( Reference Tanumihardjo and Binkley 12 ). In vitro studies suggest that carotenoids may also have direct stimulatory effects on osteoblast proliferation and differentiation( Reference Kim, Rao and Rao 13 – Reference Uchiyama and Yamaguchi 15 ).
A number of epidemiological studies have investigated links between carotenoids and bone health. There is some evidence of associations between higher specific carotenoid intakes and greater bone density( Reference Wattanapenpaiboon, Lukito and Wahlqvist 16 – Reference de Jonge, Kiefte-de Jong and Campos-Obando 19 ) or lower incidence of hip fractures( Reference Dai, Wang and Ang 20 , Reference Sahni, Hannan and Blumberg 21 ), and of higher plasma carotenoid concentrations being associated with greater bone density( Reference Sugiura, Nakamura and Ogawa 22 ) and a lower risk for developing osteoporosis( Reference Sugiura, Nakamura and Ogawa 23 , Reference Yang, Zhang and Penniston 24 ). However, these studies have had limited generalisability because of their focus on discrete population groups with a small cohort size, and on predominantly non-European participants. The current study thus aimed to explore potential associations of dietary carotenoid intakes and plasma concentrations (α-carotene, β-carotene, β-cryptoxanthin, lutein and zeaxanthin, and lycopene) with the bone density status and risk for osteoporotic fractures in a general UK population of middle-aged and older men and women. This was achieved using data from a large prospective cohort and performing cross-sectional analysis of broadband ultrasound attenuation (BUA) of the heel bone in addition to longitudinal analysis of the occurrence of incident fractures of the hip, spine and the wrist.
Methods
Study population
The European Prospective Investigation into Cancer and Nutrition (EPIC) was established as a collaboration involving ten Western European countries. EPIC-Norfolk is one of the UK subcohorts, described in detail previously( Reference Day, Oakes and Luben 25 ). A baseline health check was attended by 25 639 free-living men and women aged 39–79 years between 1993 and 1997. A second health check was attended by 17 304 of the participants aged 42–82 years between 1998 and 2000. The Norfolk District Health Authority Ethics Committee approved all procedures and written informed consent was provided by participants according to the Declaration of Helsinki.
Exposure variables
Dietary carotenoids
Daily dietary intakes of α-carotene, β-carotene, β-cryptoxanthin, lutein and zeaxanthin, lycopene, and preformed retinol, were estimated from 7-d food diaries using the methodology described below for dietary covariates.
Plasma carotenoids
Blood was sampled by peripheral venepuncture at baseline, and plasma fractions with sodium citrate were stored in liquid N2 at –196°C until analysis by reversed-phase HPLC to determine plasma concentrations of α-carotene, β-carotene, β-cryptoxanthin, lutein and zeaxanthin, lycopene, and retinol( Reference Al-Delaimy, van Kappel and Ferrari 26 ).
The correlation between matched dietary and plasma continuous scale variables was assessed using Pearson’s correlation coefficient.
Covariates
At each health check, height and weight were recorded according to standard protocols( Reference Day, Oakes and Luben 25 ), and participants completed a health and lifestyle questionnaire. Smoking status was categorised as current, former or never; family history of osteoporosis was categorised as yes or no; menopausal status (women only) was categorised as premenopausal, perimenopausal (<1 year), perimenopausal (1–5 years) or postmenopausal; and hormone replacement therapy (HRT) status (women only) was categorised as current, former, or never users. Physical activity over the preceding 12 months was assessed using a questionnaire, which placed participants into inactive, moderately inactive, moderately active and active categories using a method validated against heart-rate monitoring data( Reference Wareham, Jakes and Rennie 27 ). A 7-d food diary was used to estimate the dietary intake of each participant( Reference Bingham, Gill and Welch 28 ); participants recorded the quantity and type of all food, drink and supplements consumed within a 7-d period. Validation has shown this to be more accurate in estimating dietary nutrient intake than FFQ( Reference Day, Oakes and Luben 25 , Reference Riboli, Hunt and Slimani 29 ). DINER (Data Into Nutrients for Epidemiological Research) software was used to record the 7-d food diary information( Reference Welch, McTaggart and Mulligan 30 ), before further translation of the data for nutrient analysis using DINERMO( Reference Lentjes, McTaggart and Mulligan 31 ). All data entries were checked by nutritionists trained in use of the system( Reference Lentjes, McTaggart and Mulligan 31 ). The contribution of supplements was quantified using the Vitamin and Mineral Supplement (ViMiS) database( Reference Lentjes, Bhaniani and Mulligan 32 ).
Outcome variables
Quantitative ultrasound measurements of the calcaneus (heel bone) were taken at the second health check using a contact ultrasound bone analyser (CUBA) device (McCue Ultrasonics) following standard protocols. BUA (dB/MHz) measurements were taken at least in duplicate for each foot of the participant, and the mean of the left and right foot measures was used for analysis. Each of the five CUBA devices used in the study was calibrated daily with its physical phantom. In addition, calibration between devices was checked monthly using a roving phantom. The CV was 3·5 %. The CUBA method of bone density assessment has been shown to be capable of predicting fracture risk( Reference Welch, Camus and Dalzell 33 ), and is cheaper and simpler to conduct in general practice settings compared with the gold-standard of dual X-ray absorptiometry.
Fracture incidence data were collected using questionnaires at each health check, and the East Norfolk Health Authority database (ENCORE) of hospital attendances by Norfolk residents was also available for data linkage to corroborate self-reported data( Reference Moayyeri, Kaptoge and Dalzell 34 ). Incidence of all osteoporotic fractures in the cohort, up to the end of March 2009, was thus determined by retrieving data using each participant’s National Health Service (NHS) number and by searching for events logged using the International Classification of Diseases 9 and 10 diagnostic codes for osteoporotic hip, spine or wrist fractures (the three most common sites of osteoporotic fracture( Reference Kanis, Oden and Johnell 35 )).
Statistical analysis
The High Performance Computing Cluster supported by the Research and Specialist Computing Support service at the University of East Anglia was used for statistical data analysis with STATA software (version 13; StataCorp LP.). A previous study of this population has shown sex-specific differences in age-related changes in bone, with greater deterioration evident in women( Reference Welch, Camus and Dalzell 33 ), and thus stratification by sex was used in all our analyses. Differences between values of variables for men and women were tested using the t test for continuous variables or the χ 2 test for categorical variables. P<0·05 was considered to be statistically significant in individual analyses.
Cross-sectional analyses
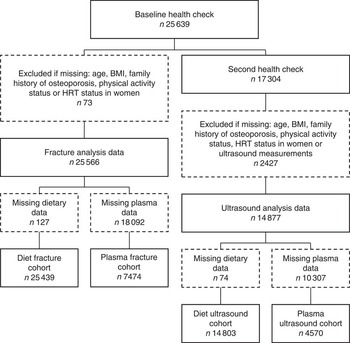
Cross-sectional analyses were conducted using data taken at the second health check, combined with dietary or plasma data from the first health check; 14 803 participants had complete data for diet and ultrasound analyses, and 4570 had complete data for plasma and ultrasound analyses (see Fig. 1). Multivariable adjusted regression with ANCOVA was used to investigate differences in calcaneal BUA across sex-specific dietary intake quintiles of carotenoid or preformed retinol. Trend testing was achieved by treating the median values for quintiles as a continuous variable( Reference Chiuve, Sampson and Willett 36 ). Each model was adjusted for important biological, lifestyle and dietary factors: age, BMI, family history of osteoporosis, menopausal and HRT status in women, corticosteroid use, smoking status, physical activity, Ca intake, total energy intake, and Ca- and vitamin D-containing supplement use, known to influence BUA in this population( Reference Welch, Camus and Dalzell 33 , Reference Jakes, Khaw and Day 37 – Reference Heaney 40 ). To help correct for dietary misreporting, the days of food diary completed and the ratio of energy intake:estimated energy requirement( 41 ) were included in all diet models. A number of different models were also tested for comparison purposes: models using residual adjustment for energy intake( Reference Willett 42 ) where we adjusted for energy before defining the nutrient quintiles, in place of using unadjusted nutrient quintiles and adding energy as a covariate in the regression model; models including dietary fat or fibre as covariates as evidence suggests that these may affect dietary carotenoid absorption( Reference Goltz and Ferruzzi 43 ); models including a variable quantifying total fruit and vegetable intake; and models combining food and supplement intakes, as excluding supplements may underestimate total nutrient intake( Reference Lentjes, Mulligan and Welch 44 ). Least square means for each quintile were calculated for all models. To minimise missing data exclusions, some missing values were recoded as follows: missing menopausal status data (2·8 %) as premenopausal if age <50 years and never-user of HRT, or as postmenopausal if age >55 years or a current or former HRT user; missing smoking status data (0·7 %) as former smokers. Participants missing data for other variables in the multivariable model were excluded. In separate analyses, calcaneal BUA was investigated across sex-specific plasma concentration quintiles of specific carotenoids in a model with the covariates described above, but excluding dietary and supplement use data.
Study population flow chart. HRT, hormone replacement therapy.
Longitudinal analyses
Longitudinal analyses used data from the first health check together with data of hospital recorded fractures for the cohort participants (all cohort hip, spine and wrist fracture cases up to 31 March 2009; follow-up time was calculated as the time between an individual’s first health check and this cut-off date, or death if earlier); data for diet and fracture analyses were available for 25 439 participants, and for plasma and fracture analyses for 7474 participants (see Fig. 1). The Prentice-weighted Cox regression was used to investigate associations between incidence of fractures and sex-specific quintiles of specific carotenoid or retinol dietary intakes, or plasma concentrations, using the same adjustments as for the BUA models. Missing values were treated in the same way as in the BUA models. Total risk for hip, spine or wrist fracture was calculated as the risk for the first occurrence of one of these fractures; this does not consider multiple fractures, and therefore the sum of the specific-site fracture incidences does not sum to the total.
Results
Selected characteristics are summarised in Table 1. The significant differences evident according to sex supports our use of sex-specific model analyses. Mean dietary and supplement-derived intakes of specific carotenoids and preformed retinol are shown for the study population (α-carotene, β-cryptoxanthin, lutein and zeaxanthin, and lycopene supplement contributions were negligible; individual means ≤150 ng/d). However, no UK Reference Nutrient Intake values( 45 ) for carotenoids are currently available for comparison. Retinol plasma concentrations <100 μg/l are considered to indicate severe deficiency; 100–200 μg/l indicates mild deficiency( 46 ). Three individuals (0·07 %) with plasma carotenoid data in the ultrasound cohort (n 4570) were mildly deficient according to these criteria and one (0·02 %) was severely deficient; eleven individuals (0·15 %) of the fracture cohort with plasma data (n 7474) were mildly deficient and three (0·04 %) were severely deficient.
Selected characteristics of the ultrasound analysis cohort (n 14 803) and the fracture cohort (n 25 439) from European Prospective Investigation into Cancer and Nutrition-Norfolk, stratified by sex (Mean values and standard deviations; numbers and percentages)
BUA, broadband ultrasound attenuation.
* Ultrasound group characteristics at second health check (time of ultrasound).
† Fracture group characteristics at first health check or time of consent.
‡ Differences between men and women using t test for continuous or χ 2 for categorical variables.
§ Retinol as preformed intake only.
|| n 2362.
¶ n 2208.
** n 3817.
†† n 3657.
Correlations between dietary carotenoid intakes and plasma concentrations
A number of weak, but significant, correlations were identified between dietary carotenoid intakes and plasma concentrations. Dietary α-carotene intake was significantly correlated with plasma α-carotene concentration in both men (r 0·497, P<0·001, n 2355, ultrasound cohort; r 0·496, P<0·001, n 2380, fracture cohort) and women (r 0·373, P<0·001, n 2201, ultrasound cohort; r 0·368, P<0·001, n 2219, fracture-case cohort). Dietary β-carotene intake was significantly correlated with plasma β-carotene concentration in both men (r 0·311, P<0·001, n 2355, ultrasound cohort; r 0·311, P<0·001, n 2380, fracture cohort) and women (r 0·280, P<0·001, n 2201, ultrasound cohort; r 0·275, P<0·001, n 2219, fracture-case cohort). Dietary β-cryptoxanthin intake was significantly correlated with plasma β-cryptoxanthin concentration in both men (r 0·395, P<0·001, n 2355, ultrasound cohort; r 0·397, P<0·001, n 2380, fracture cohort) and women (r 0·390, P<0·001, n 2201, ultrasound cohort; r 0·388, P<0·001, n 2219, fracture-case cohort). Dietary lutein and zeaxanthin intake was significantly correlated with plasma lutein and zeaxanthin concentration in both men (r 0·211, P<0·001, n 2355, ultrasound cohort; r 0·212, P<0·001, n 2380, fracture cohort) and women (r 0·214, P<0·001, n 2201, ultrasound cohort; r 0·212, P<0·001, n 2219, fracture cohort). Dietary lycopene intake was significantly correlated with plasma lycopene concentration in both men (r 0·275, P<0·001, n 2355, ultrasound cohort; r 0·279, P<0·001, n 2380, fracture cohort) and women (r 0·294, P<0·001, n 2201, ultrasound cohort; r 0·293, P<0·001, n 2219, fracture cohort). Preformed dietary retinol intake was not significantly correlated with plasma retinol concentration in either men (r 0·039, P=0·056, n 2355, ultrasound cohort; r 0·038, P=0·062, n 2380, fracture cohort) or women (r 0·013, P=0·539, n 2201, ultrasound cohort; r 0·014, P=0·516, n 2219, fracture cohort).
Associations between dietary carotenoid intakes and bone density
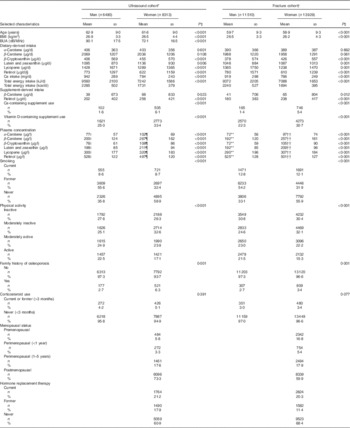
Mean calcaneal BUA values stratified by sex and quintiles of specific dietary carotenoid or by preformed retinol intakes are shown in Fig. 2 for the fully adjusted model (unadjusted data are shown in the online Supplementary Table S1). In women, significant positive linear trends were apparent across quintiles of α-carotene intake (P=0·029), β-carotene intake (P=0·003), β-cryptoxanthin intake (P=0·031), combined lutein and zeaxanthin intakes (P=0·010), and lycopene intake (P=0·005) for fully adjusted BUA; a significant negative trend was apparent across retinol intake quintiles (P=0·037). Individual significant differences in fully adjusted BUA in different quintiles v. quintile 1 were also identified for women for quintile 3 (1·5 % higher; n 1662, P=0·023) and quintile 5 (2·3 % higher; n 1662, P=0·001) for β-carotene intake; and for quintile 4 (1·8 % higher; n 1663, P=0·007) and quintile 5 (1·7 % higher; n 1662, P=0·011) for combined lutein and zeaxanthin intake (see Fig. 2). The associations described between BUA and carotenoid intake were no different when food and supplement contributions were combined in the model, except that with the combined intake data no trend in BUA across retinol quintiles was evident.
Fully adjusted calcaneal broadband ultrasound attenuation (BUA) of 6490 men and 8313 women from the European Prospective Investigation into Cancer and Nutrition-Norfolk cohort, stratified by sex and dietary intake quintiles (Q) of specific carotenoids or retinol. Full model: age, BMI, family history of osteoporosis, menopausal and hormone replacement therapy status in women, corticosteroid use, smoking status, physical activity, calcium intake, total energy intake, calcium- and vitamin D-containing supplement use, days of food diary completed, and the ratio of energy intake:estimated energy requirement. Retinol as preformed intake only. Values are means and standard deviations represented by vertical bars. ![]() , Q1;
, Q1; ![]() , Q2;
, Q2; ![]() , Q3;
, Q3; ![]() , Q4;
, Q4; ![]() , Q5. Mean α-carotene intake per quintile: men – 406 (sd 363) μg/d; Q1, 40 (sd 36) μg/d; Q2, 188 (sd 41) μg/d; Q3, 339 (sd 46) μg/d; Q4, 515 (sd 60) μg/d; Q5, 948 (sd 399) μg/d; women – 403 (sd 356) μg/d; Q1, 50 (sd 40) μg/d; Q2, 196 (sd 40) μg/d; Q3, 337 (sd 44) μg/d; Q4, 509 (sd 60) μg/d; Q5, 922 (sd 416) μg/d. Mean β-carotene intake per quintile: men – 2069 (sd 1207) μg/d; Q1, 757 (sd 254) μg/d; Q2, 1366 (sd 146) μg/d; Q3, 1871 (sd 150) μg/d; Q4, 2472 (sd 212) μg/d; Q5, 3877 (sd 1199) μg/d; women – 2036 (sd 1206) μg/d; Q1, 758 (sd 247) μg/d; Q2, 1352 (sd 139) μg/d; Q3, 1832 (sd 142) μg/d; Q4, 2428 (sd 206) μg/d; Q5, 3813 (sd 1294) μg/d. Mean β-cryptoxanthin intake per quintile: men – 406 (sd 569) μg/d; Q1, 15 (sd 9) μg/d; Q2, 56 (sd 17) μg/d; Q3, 168 (sd 52) μg/d; Q4, 447 (sd 123) μg/d; Q5, 1343 (sd 622) μg/d; women – 455 (sd 570) μg/d; Q1, 25 (sd 13) μg/d; Q2, 89 (sd 29) μg/d; Q3, 243 (sd 61) μg/d; Q4, 540 (sd 124) μg/d; Q5, 1380 (sd 613) μg/d. Mean lutein and zeaxanthin intake per quintile: men – 1095 (sd 870) μg/d; Q1, 334 (sd 127) μg/d; Q2, 642 (sd 72) μg/d; Q3, 899 (sd 80) μg/d; Q4, 1244 (sd 130) μg/d; Q5, 2355 (sd 1144) μg/d; women – 1136 (sd 930) μg/d; Q1, 363 (sd 123) μg/d; Q2, 659 (sd 71) μg/d; Q3, 915 (sd 80) μg/d; Q4, 1263 (sd 132) μg/d; Q5, 2482 (sd 1256) μg/d. Mean lycopene intake per quintile: men – 1428 (sd 1671) μg/d; Q1, 126 (sd 117) μg/d; Q2, 556 (sd 121) μg/d; Q3, 1028 (sd 160) μg/d; Q4, 1693 (sd 242) μg/d; Q5, 3735 (sd 2416) μg/d; women – 1289 (sd 1365) μg/d; Q1, 147 (sd 116) μg/d; Q2, 524 (sd 104) μg/d; Q3, 932 (sd 134) μg/d; Q4, 1546 (sd 233) μg/d; Q5, 3297 (sd 1764) μg/d. Mean retinol intake per quintile: men – 773 (sd 1297) μg/d; Q1, 177 (sd 52) μg/d; Q2, 295 (sd 29) μg/d; Q3, 403 (sd 35) μg/d; Q4, 561 (sd 68) μg/d; Q5, 2431 (sd 2212) μg/d; women – 622 (sd 1159) μg/d; Q1, 138 (sd 41) μg/d; Q2, 233 (sd 22) μg/d; Q3, 309 (sd 25) μg/d; Q4, 425 (sd 45) μg/d; Q5, 2004 (sd 2069) μg/d. * P<0·05 v. Q1, ** P<0·01, according to ANCOVA.
, Q5. Mean α-carotene intake per quintile: men – 406 (sd 363) μg/d; Q1, 40 (sd 36) μg/d; Q2, 188 (sd 41) μg/d; Q3, 339 (sd 46) μg/d; Q4, 515 (sd 60) μg/d; Q5, 948 (sd 399) μg/d; women – 403 (sd 356) μg/d; Q1, 50 (sd 40) μg/d; Q2, 196 (sd 40) μg/d; Q3, 337 (sd 44) μg/d; Q4, 509 (sd 60) μg/d; Q5, 922 (sd 416) μg/d. Mean β-carotene intake per quintile: men – 2069 (sd 1207) μg/d; Q1, 757 (sd 254) μg/d; Q2, 1366 (sd 146) μg/d; Q3, 1871 (sd 150) μg/d; Q4, 2472 (sd 212) μg/d; Q5, 3877 (sd 1199) μg/d; women – 2036 (sd 1206) μg/d; Q1, 758 (sd 247) μg/d; Q2, 1352 (sd 139) μg/d; Q3, 1832 (sd 142) μg/d; Q4, 2428 (sd 206) μg/d; Q5, 3813 (sd 1294) μg/d. Mean β-cryptoxanthin intake per quintile: men – 406 (sd 569) μg/d; Q1, 15 (sd 9) μg/d; Q2, 56 (sd 17) μg/d; Q3, 168 (sd 52) μg/d; Q4, 447 (sd 123) μg/d; Q5, 1343 (sd 622) μg/d; women – 455 (sd 570) μg/d; Q1, 25 (sd 13) μg/d; Q2, 89 (sd 29) μg/d; Q3, 243 (sd 61) μg/d; Q4, 540 (sd 124) μg/d; Q5, 1380 (sd 613) μg/d. Mean lutein and zeaxanthin intake per quintile: men – 1095 (sd 870) μg/d; Q1, 334 (sd 127) μg/d; Q2, 642 (sd 72) μg/d; Q3, 899 (sd 80) μg/d; Q4, 1244 (sd 130) μg/d; Q5, 2355 (sd 1144) μg/d; women – 1136 (sd 930) μg/d; Q1, 363 (sd 123) μg/d; Q2, 659 (sd 71) μg/d; Q3, 915 (sd 80) μg/d; Q4, 1263 (sd 132) μg/d; Q5, 2482 (sd 1256) μg/d. Mean lycopene intake per quintile: men – 1428 (sd 1671) μg/d; Q1, 126 (sd 117) μg/d; Q2, 556 (sd 121) μg/d; Q3, 1028 (sd 160) μg/d; Q4, 1693 (sd 242) μg/d; Q5, 3735 (sd 2416) μg/d; women – 1289 (sd 1365) μg/d; Q1, 147 (sd 116) μg/d; Q2, 524 (sd 104) μg/d; Q3, 932 (sd 134) μg/d; Q4, 1546 (sd 233) μg/d; Q5, 3297 (sd 1764) μg/d. Mean retinol intake per quintile: men – 773 (sd 1297) μg/d; Q1, 177 (sd 52) μg/d; Q2, 295 (sd 29) μg/d; Q3, 403 (sd 35) μg/d; Q4, 561 (sd 68) μg/d; Q5, 2431 (sd 2212) μg/d; women – 622 (sd 1159) μg/d; Q1, 138 (sd 41) μg/d; Q2, 233 (sd 22) μg/d; Q3, 309 (sd 25) μg/d; Q4, 425 (sd 45) μg/d; Q5, 2004 (sd 2069) μg/d. * P<0·05 v. Q1, ** P<0·01, according to ANCOVA.
Associations between plasma carotenoid concentrations and bone density
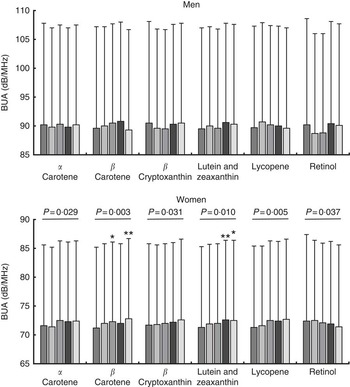
Analysis of bone density measures according to plasma carotenoid concentration quintiles, adjusting for all covariates previously described, with the exception of dietary factors, showed no significant linear trends in BUA for either men or women (see Fig. 3). Nevertheless, a significant difference in fully adjusted BUA was identified for men between quintile 2 and quintile 1 for plasma lutein and zeaxanthin (3·2 % higher; n 473, P=0·015). Unadjusted data are shown in the online Supplementary Table S2.
Fully adjusted calcaneal broadband ultrasound attenuation (BUA) of 2362 men and 2208 women from the European Prospective Investigation into Cancer and Nutrition-Norfolk cohort, stratified by sex and plasma concentration quintiles (Q) of specific carotenoids or retinol. Full model: age, BMI, smoking status, physical activity, family history of osteoporosis, menopausal and hormone replacement therapy status in women, and corticosteroid use. Values are means and standard deviations represented by vertical bars. ![]() , Q1;
, Q1; ![]() , Q2;
, Q2; ![]() , Q3;
, Q3; ![]() , Q4;
, Q4; ![]() , Q5. Mean α-carotene per quintile: men – 77 (SD 57) μg/l; Q1, 25 (SD 8) μg/l; Q2, 46 (SD 5) μg/l; Q3, 65 (SD 6) μg/l; Q4, 89 (SD 9) μg/l; Q5, 160 (SD 73) μg/l; women – 102 (SD 69) μg/l; Q1, 35 (SD 11) μg/l; Q2, 61 (SD 6) μg/l; Q3, 85 (SD 8) μg/l; Q4, 120 (SD 12) μg/l; Q5, 208 (SD 72) μg/l. Mean β-carotene per quintile: men – 200 (SD 124) μg/l; Q1, 79 (SD 21) μg/l; Q2, 129 (SD 12) μg/l; Q3, 174 (SD 15) μg/l; Q4, 235 (SD 21) μg/l; Q5, 383 (SD 141) μg/l; women – 267 (SD 162) μg/l; Q1, 107 (SD 28) μg/l; Q2, 174 (SD 16) μg/l; Q3, 234 (SD 17) μg/l; Q4, 310 (SD 26) μg/l; Q5, 509 (SD 183) μg/l. Mean β-cryptoxanthin per quintile: men – 76 (SD 61) μg/l; Q1, 22 (SD 7) μg/l; Q2, 40 (SD 5) μg/l; Q3, 60 (SD 6) μg/l; Q4, 88 (SD 10) μg/l; Q5, 170 (SD 70) μg/l; women – 108 (SD 86) μg/l; Q1, 32 (SD 9) μg/l; Q2, 57 (SD 7) μg/l; Q3, 85 (SD 9) μg/l; Q4, 125 (SD 16) μg/l; Q5, 239 (SD 103) μg/l. Mean lutein and zeaxanthin per quintile: men – 98 (SD 85) μg/l; Q1, 105 (SD 20) μg/l; Q2, 149 (SD 10) μg/l; Q3, 182 (SD 10) μg/l; Q4, 228 (SD 16) μg/l; Q5, 328 (SD 78) μg/l; women – 211 (SD 94) μg/l; Q1, 110 (SD 20) μg/l; Q2, 155 (SD 11) μg/l; Q3, 195 (SD 11) μg/l; Q4, 240 (SD 16) μg/l; Q5, 355 (SD 89) μg/l. Mean lycopene per quintile: men – 300 (SD 177) μg/l; Q1, 103 (SD 35) μg/l; Q2, 190 (SD 21) μg/l; Q3, 267 (SD 24) μg/l; Q4, 366 (SD 35) μg/l; Q5, 575 (SD 144) μg/l; women – 320 (SD 183) μg/l; Q1, 109 (SD 35) μg/l; Q2, 204 (SD 24) μg/l; Q3, 289 (SD 26) μg/l; Q4, 394 (SD 36) μg/l; Q5, 603 (SD 140) μg/l. Mean retinol per quintile: men – 528 (SD 122) μg/l; Q1, 379 (SD 48) μg/l; Q2, 461 (SD 17) μg/l; Q3, 514 (SD 17) μg/l; Q4, 577 (SD 21) μg/l; Q5, 708 (SD 96) μg/l; women – 497 (SD 120) μg/l; Q1, 350 (SD 39) μg/l; Q2, 431 (SD 16) μg/l; Q3, 485 (SD 16) μg/l; Q4, 546 (SD 19) μg/l; Q5, 674 (SD 96) μg/l. * P<0·05 v. Q1, according to ANCOVA.
, Q5. Mean α-carotene per quintile: men – 77 (SD 57) μg/l; Q1, 25 (SD 8) μg/l; Q2, 46 (SD 5) μg/l; Q3, 65 (SD 6) μg/l; Q4, 89 (SD 9) μg/l; Q5, 160 (SD 73) μg/l; women – 102 (SD 69) μg/l; Q1, 35 (SD 11) μg/l; Q2, 61 (SD 6) μg/l; Q3, 85 (SD 8) μg/l; Q4, 120 (SD 12) μg/l; Q5, 208 (SD 72) μg/l. Mean β-carotene per quintile: men – 200 (SD 124) μg/l; Q1, 79 (SD 21) μg/l; Q2, 129 (SD 12) μg/l; Q3, 174 (SD 15) μg/l; Q4, 235 (SD 21) μg/l; Q5, 383 (SD 141) μg/l; women – 267 (SD 162) μg/l; Q1, 107 (SD 28) μg/l; Q2, 174 (SD 16) μg/l; Q3, 234 (SD 17) μg/l; Q4, 310 (SD 26) μg/l; Q5, 509 (SD 183) μg/l. Mean β-cryptoxanthin per quintile: men – 76 (SD 61) μg/l; Q1, 22 (SD 7) μg/l; Q2, 40 (SD 5) μg/l; Q3, 60 (SD 6) μg/l; Q4, 88 (SD 10) μg/l; Q5, 170 (SD 70) μg/l; women – 108 (SD 86) μg/l; Q1, 32 (SD 9) μg/l; Q2, 57 (SD 7) μg/l; Q3, 85 (SD 9) μg/l; Q4, 125 (SD 16) μg/l; Q5, 239 (SD 103) μg/l. Mean lutein and zeaxanthin per quintile: men – 98 (SD 85) μg/l; Q1, 105 (SD 20) μg/l; Q2, 149 (SD 10) μg/l; Q3, 182 (SD 10) μg/l; Q4, 228 (SD 16) μg/l; Q5, 328 (SD 78) μg/l; women – 211 (SD 94) μg/l; Q1, 110 (SD 20) μg/l; Q2, 155 (SD 11) μg/l; Q3, 195 (SD 11) μg/l; Q4, 240 (SD 16) μg/l; Q5, 355 (SD 89) μg/l. Mean lycopene per quintile: men – 300 (SD 177) μg/l; Q1, 103 (SD 35) μg/l; Q2, 190 (SD 21) μg/l; Q3, 267 (SD 24) μg/l; Q4, 366 (SD 35) μg/l; Q5, 575 (SD 144) μg/l; women – 320 (SD 183) μg/l; Q1, 109 (SD 35) μg/l; Q2, 204 (SD 24) μg/l; Q3, 289 (SD 26) μg/l; Q4, 394 (SD 36) μg/l; Q5, 603 (SD 140) μg/l. Mean retinol per quintile: men – 528 (SD 122) μg/l; Q1, 379 (SD 48) μg/l; Q2, 461 (SD 17) μg/l; Q3, 514 (SD 17) μg/l; Q4, 577 (SD 21) μg/l; Q5, 708 (SD 96) μg/l; women – 497 (SD 120) μg/l; Q1, 350 (SD 39) μg/l; Q2, 431 (SD 16) μg/l; Q3, 485 (SD 16) μg/l; Q4, 546 (SD 19) μg/l; Q5, 674 (SD 96) μg/l. * P<0·05 v. Q1, according to ANCOVA.
Associations between dietary carotenoid intakes and fracture risk
Fully adjusted total risk for hip, spine or wrist fractures showed a significant negative linear association in men with quintiles of dietary α-carotene (n 11 510, P=0·040) and β-carotene (n 11 510, P=0·044) intake. A significant negative trend was also present in women for the association between wrist fracture risk and lutein and zeaxanthin intake quintiles (n 13 929, P=0·022). Table 2 shows all trend P values and quintile 1 v. quintile 5 comparisons. In men, total hip, spine and wrist fracture risk was lower in α-carotene intake quintile 5 v. quintile 1 (0·71; 95 % CI 0·53, 0·95; P=0·020); and hip fracture risk was lower in α-carotene intake quintile 3 v. quintile 1 (0·64; 95 % CI 0·42, 0·99; P=0·046) and β-cryptoxanthin intake quintile 5 v. quintile 1 (0·65 (95 % CI 0·42, 0·99); P=0·046). In women, hip fracture risk was lower in lutein and zeaxanthin quintile 4 v. quintile 1, (0·75; 95 % CI 0·58, 0·98; P=0·032). A negative linear association was evident across preformed retinol intake quintiles for wrist fracture risk (n 11 510, P=0·005) in men. Also in men, compared with dietary retinol quintile 1, total fracture risk was lower in quintile 5 (0·71; 95 % CI 0·52, 0·97; P=0·033); wrist fracture risk was lower in quintile 4 (0·44; 95 % CI 0·24, 0·81; P=0·008) and quintile 5 (0·33; 95 % CI 0·17, 0·65; P=0·001); and spine fracture risk was lower in quintile 3 (0·56 (95 % CI 0·33, 0·96); P=0·033).
Risk of hip, spine and wrist fractures in the European Prospective Investigation into Cancer and Nutrition-Norfolk cohort population at follow-up v. baseline, stratified by sex and dietary intake quintiles (Q) of specific carotenoids or retinol (The Prentice-weighted Cox proportional hazard ratios and 95 % confidence intervals)
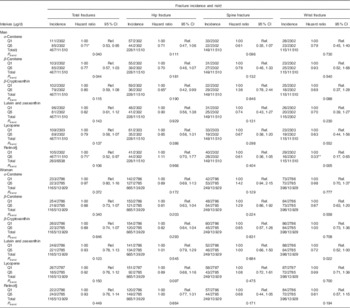
Ref., referent values.
* P<0·05, ** P<0·01 v. Q1, according to ANCOVA.
† Full model: age, BMI, family history of osteoporosis, menopausal and hormone replacement therapy status in women, corticosteroid use, smoking status, physical activity, Ca intake, total energy intake, Ca- and vitamin D-containing supplement use, days of food diary completed and the ratio of energy intake:estimated energy requirement.
‡ Total risk is for the first occurrence of one of these fractures and therefore the sum of the specific-site fracture incidences do not sum to the total.
§ Retinol as preformed intake only.
The associations between carotenoid intakes and fracture risk were no different when food and supplement contributions were combined in the model. However, preformed retinol analyses showed a number of differences when supplements were included. There was no significant difference in total fracture risk in men between retinol quintile 1 and quintile 5 with the combined intake data, although the differences in risk between quintile 2 and quintile 1 (0·67; 95 % CI 0·50, 0·90; P=0·008) and between quintile 3 and quintile 1 (0·72; 95 % CI 0·53, 0·96; P=0·028) were significant. Other significant retinol inter-quintile differences, in addition to those found in diet only analyses, were: wrist fracture risk for men in quintile 3 v. quintile 1 (0·37; 95 % CI 0·20, 0·69; P=0·002); spine fracture risk for men in quintile 2 (0·31; 95 % CI 0·17, 0·56; P=0·048), quintile 4 (0·59; 95 % CI 0·36, 0·96; P=0·036) and quintile 5 (0·54; 95 % CI 0·30, 0·97; P=0·040) v. quintile 1; and wrist fracture risk for women in quintile 5 v. quintile 1 (0·64; 95 % CI 0·43, 0·96; P=0·031).
Associations between plasma carotenoid intakes and fracture risk
In men, but not in women, there was a significant linear trend for lower hip fracture risk across plasma α-carotene quintiles (P=0·026) and plasma β-carotene quintiles (P=0·027) (see Table 3). In women, fracture risk was significantly lower in α-carotene quintile 3 than in quintile 1 in the fully adjusted model for both total fracture (0·70; 95 % CI 0·50, 0·96; P=0·028) and hip fracture (0·63; 95 % CI 0·41, 0·97; P=0·035); hip fracture risk in women was also lower in plasma retinol quintile 4 v. quintile 1 (0·64; 95 % CI 0·41, 0·99; P=0·044).
Risk of hip, spine and wrist fractures in the European Prospective Investigation into Cancer and Nutrition-Norfolk cohort population at follow-up v. baseline, stratified by sex and serum concentration quintiles (Q) of specific carotenoids or retinol (The Prentice-weighted Cox proportional hazard ratios and 95 % confidence intervals).
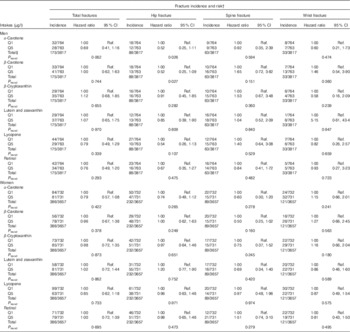
Ref., referent values.
† Full model: age, BMI, family history of osteoporosis, menopausal and hormone replacement therapy status in women, corticosteroid use, smoking status, physical activity.
‡ Total risk is for the first occurrence of one of these fractures and therefore the sum of the specific-site fracture incidences do not sum to the total.
Discussion
This study has shown that significant associations between dietary carotenoid intake and a quantitative measure of bone density exist in a UK population cohort, after adjustment for important biological, lifestyle and other dietary covariates. In women, dietary intake quintiles of dietary α-carotene, β-carotene, β-cryptoxanthin, combined lutein and zeaxanthin, and lycopene were all positively linearly associated with calcaneal BUA, such that individuals with a higher intake of each of these carotenoids had higher BUA measurements; preformed retinol was negatively associated. Significant associations of BUA with quintiles of plasma carotenoid concentration were much more limited, with no significant trends apparent, and only a single inter-quintile association evident for lutein and zeaxanthin in men. Nevertheless, the magnitude of the effects seen with the dietary analyses is highly relevant to bone health( Reference Welch, Camus and Dalzell 33 ); for example, the difference between the median β-carotene intakes in quintile 5 and quintile 1 for women (3462 and 792 μg/d) could be accounted for by the additional intake of just one small carrot and yet is associated with 2·3 % greater BUA. Moreover, this study included longitudinal analysis of the risk for osteoporotic fracture, demonstrating significant linear trends for lower risk for wrist fracture across dietary retinol quintiles in men and dietary lutein and zeaxanthin quintiles in women, and lower hip fracture risk across plasma α-carotene and β-carotene concentration quintiles in men. A number of significant differences in fracture risk were also shown between individual quintiles of dietary carotenoid intake or plasma concentration. These include lower total risk for hip, spine and wrist fracture in the highest v. the lowest intake quintiles of dietary α-carotene in men, as well as lower hip fracture risk in the highest β-cryptoxanthin intake quintile in men and in higher lutein and zeaxanthin intake quintiles in women. This study is, to our knowledge, the first comprehensive epidemiological analysis of the relevance of specific dietary and plasma carotenoids with bone density status and risk for osteoporotic fractures in a large European mixed-sex cohort. The findings thus provide an important advance to the current research evidence.
Inclusion of a variable quantifying total fruit and vegetable intake in our regression models caused an attenuation of the associations of carotenoids with BUA (data not shown), suggesting potential effects of other components in fruit and vegetables in addition to carotenoids. However, despite this attenuation, the associations of carotenoids with BUA remained significant, indicating that the effects of carotenoids independent of total fruit and vegetable consumption are important. The mechanisms by which carotenoids may influence bone metabolism are not fully understood, although a number of theories have been proposed. Some, but not all, carotenoids have provitamin A activity and therefore may have effects on bone health via this mediator( Reference Yamaguchi 7 ), all have antioxidant activity likely to be protective of bone( Reference Tanumihardjo and Binkley 12 ), and members of the carotenoid family have also been shown experimentally to have direct stimulatory effects on osteoblast proliferation and differentiation at physiologically relevant concentrations( Reference Dai, Wang and Ang 20 ).
Our results suggest that the effects on bone health may differ for specific carotenoids, a situation also evident in previous carotenoid research( Reference Wattanapenpaiboon, Lukito and Wahlqvist 16 , Reference Sahni, Hannan and Blumberg 17 , Reference Sahni, Hannan and Blumberg 21 ). In the Framingham Osteoporosis Study, participants had lower risk for hip fracture or non-vertebral fracture if they were in the highest tertile of total carotenoid or lycopene intake, respectively, but no associations were evident for α-carotene or β-carotene, β-cryptoxanthin, or lutein and zeaxanthin( Reference Sahni, Hannan and Blumberg 21 ). It is possible that this occurrence may be due to differing ranges and magnitude of intakes for different carotenoids. Indeed, specific carotenoids are found in differing concentrations in different fruit and vegetables: unpublished composition analysis conducted for the EPIC-Norfolk cohort showed that α-carotene was predominantly sourced from root vegetables, especially carrots (65 % of total); β-carotene was also sourced significantly from carrots (35 %) and other root, dark-green leafy and fruiting vegetables; β-cryptoxanthin was sourced from citrus fruits, mainly oranges; lutein was sourced mainly from peas (16 %), with broccoli, cabbages and other leafy vegetables providing approximately 10 % each; zeaxanthin was sourced mostly from citrus fruits (19 % from oranges), apples (>10 %) and green leafy and fruiting vegetables; and lycopene was sourced from fruiting vegetables, mainly tomatoes (35 %) and tinned beans in tomato sauce (15 %). However, it is also possible that underlying mechanisms of action may be different and more potent for some carotenoids compared with others. We know that all carotenoids are capable of antioxidant activity with potential to counter the negative influence of oxidative stress on bone health( Reference Tanumihardjo and Binkley 12 ), but some, for example, β-cryptoxanthin( Reference Yamaguchi 7 ), have been shown to have direct effects on bone metabolism. The fact that differing magnitudes of effects appear to exist leads us to speculate that universal antioxidant activity may not be the dominant mechanism for all carotenoids. Another factor is the potential for differential absorption, which may affect interpretation, but makes the plasma data presented in this study particularly useful. Indeed, although low serum concentrations of α-carotene and β-carotene, lycopene, β-cryptoxanthin and zeaxanthin have been demonstrated in a study of Italian women with osteoporosis, and likewise for lycopene and β-cryptoxanthin in US women( Reference Tanumihardjo and Binkley 12 ), only one small Japanese study has been published detailing a longitudinal analysis of serum carotenoids and bone health, observing lower risk for osteoporosis development with higher serum β-carotene and β-cryptoxanthin( Reference Sugiura, Nakamura and Ogawa 23 ).
Our findings showed correlation between dietary intakes of carotenoids and their plasma concentrations, corroborating previous studies( Reference Brady, Mares-Perlman and Bowen 47 , Reference Talegawkar, Johnson and Carithers 48 ). The relatively weak nature of these correlations has also been noted previously and attributed to various influences including seasonality, obesity and day to day variation in an individual’s dietary intake and plasma concentrations( Reference Scott, Thurnham and Hart 49 ). No correlation was identified for dietary retinol intake and plasma retinol concentration. Between the extremes of severe deficiency and excess, plasma retinol is tightly homoeostatically controlled( Reference Tanumihardjo 50 ), which could explain the lack of correlation with dietary intake in our data( Reference Lentjes, Mulligan and Welch 44 ). Our results for bone density status in women confirm the detrimental effects of higher dietary vitamin A retinol-equivalent intakes reported elsewhere( Reference Binkley and Krueger 51 ), and although not directly replicated in associations of diet and fracture risk, plasma retinol data corroborates this with a lower comparative risk for fracture in quintile 4 v. quintile 1 than in quintile 5 v. quintile 1.
Strengths and limitations
This study provides important observational evidence of associations between specific carotenoid dietary intakes or plasma concentrations and bone health, in the largest European study on this subject to date. Nevertheless, we were limited in the data available for analysis. In particular, plasma carotenoid data were only available for a smaller subset of the full cohort, which may have reduced the power of our analyses. In terms of anthropometric indices, blood pressure and blood lipids, the EPIC-Norfolk cohort is representative of the UK population( Reference Day, Oakes and Luben 25 ). We acknowledge that hospital admission data may underestimate fracture incidence, particularly of spine fractures, and this could differ by sex. Furthermore, record linkage used to determine fracture cases precluded the ability to discriminate between low- and high-trauma fractures. The influence of this on our findings is expected to be small, as the proportion of high-trauma fracture cases in this demographic group is likely to be low(52). It is an advantage of our study that data for both sexes were analysed, as different effects were evident in men and women, a situation often apparent in bone health. For example, data from a Chinese cohort study showed that total carotenoid and α-carotene or β-carotene, and lutein/zeaxanthin were all inversely associated with hip fracture risk in men, but no significant associations were identified for women( Reference Dai, Wang and Ang 20 ). Our data similarly show the strongest associations for fracture risk in men, although the ultrasound data are conversely more significant in women. Sex differences in fruit and vegetable consumption or reporting may be responsible for differences in the associations with bone identified here and in previous studies( Reference Myint, Welch and Bingham 53 ), although, as carotenoids are fat soluble, the different adiposity of men and women could also influence their bioavailability and effects.
Accurate estimation of dietary nutrient intake is critical to the validity of the findings of this type of study. The quantitative 7-d food diary method used here has been validated previously and is expected to provide more precise dietary intake figures compared with FFQ or 24-h recall methods( Reference Lentjes, McTaggart and Mulligan 31 ). Dietary and lifestyle data used in longitudinal analyses were collected at baseline, and thus variation in food consumption and lifestyle behaviours could have influenced our findings. We have focused our attention on models using nutrient composition data from food intake only; thus, we potentially underestimate total nutrient intakes, including supplements. Carotenoids from supplements have been suggested to have greater bioavailability than those derived from foods and thus may make an important contribution to plasma carotenoid concentrations( Reference Arscott 6 ). In this cohort, no fundamental differences were apparent between models combining food and supplement contributions and those using food contributions only, although some additional inter-quintile differences in fracture risk were apparent for preformed retinol analyses when supplements were included, a likely result of the extension of the upper intake range. Previous studies have shown that the absorption of carotenoids is positively associated with dietary lipid intake, in particular, MUFA intake, and it may also be affected by dietary fibre( Reference Goltz and Ferruzzi 43 ). However, in our dietary BUA model, the effect of inclusion of dietary fat or fibre was minimal (data not shown). Food preparation may also affect carotenoid stability, which, combined with food carotenoid content variability due to cultivation practices, season and ripening status( Reference Arscott 6 ), may have reduced the accuracy of carotenoid intake estimations from the food diaries used in this study. In addition to the direct influence of dietary carotenoid intake, plasma carotenoid concentrations are influenced by the rate of uptake into and efflux from other tissues( Reference Burri, Neidlinger and Clifford 54 ). Inter-individual variability in these processes may thus make plasma concentrations less reliable as a biomarker of dietary intake and may partly explain the discrepancies between diet and plasma results presented here. Indeed it has been suggested that adipose tissue concentrations are likely to give a better indication of long-term carotenoid status( Reference Wallstrom, Wirfalt and Lahmann 55 , Reference Kardinaal, van ’t Veer and Brants 56 ). Metabolism and absorption of carotenoids, and thus their measurable plasma concentrations, may also be influenced by other physiological or lifestyle factors, including the inflammatory profile( Reference Wood, Strachan and Thies 57 ), adiposity( Reference Hosseini, Saedisomeolia and Skilton 58 ) and smoking( Reference Handelman, Packer and Cross 59 ). The inflammatory profile may be particularly relevant to the cohort analysed here, as chronic low-grade inflammation is common in older populations and thus should be investigated by future studies with reference to bone health.
Conclusions
This study has shown positive associations of dietary intake and plasma concentration of specific carotenoids with a quantitative ultrasound measure of bone density status and lower fracture risk in a general population group. The results are insufficiently consistent to make definitive conclusions, but are nevertheless supportive of the hypothesis that dietary intakes of fruit and vegetables rich in carotenoids and other antioxidants are beneficial to adult bone, which, once confirmed by clinical trials, may provide a valuable approach for public health strategies to improve bone health in our ageing population.
Acknowledgements
The authors thank the EPIC staff and the participants enrolled in the study.
The EPIC-Norfolk study received grants from the Medical Research Council (G9502233) and from Cancer Research UK (SP2024-0201 and SP2024-0204).
A. A. W. developed the research question with R. P. G. H. who analysed the data and drafted the manuscript. A. A. W. also arranged data collection in conjunction with R. N. L., who implemented record linkage. M. A. H. L. and A. A. M. prepared dietary and supplement data. K.-T. K. is the principal investigator of the EPIC-Norfolk Study. All authors contributed to data interpretation, review of the manuscript and its approval.
None of the authors has any conflicts of interest to declare.
Supplementary material
For supplementary material/s referred to in this article, please visit https://doi.org/10.1017/S0007114517001180


